
 1,1
1,1- 1Imperial College London, Department of Earth Science and Engineering, Department of Earth Science and Engineering, London, United Kingdom of Great Britain – England, Scotland, Wales (s.gupta@imperial.ac.uk)
- 2Imperial College London, Department of Computing, London, United Kingdom of Great Britain
- 3Imperial College London, Data Science Institute, London, United Kingdom of Great Britain
Recent orbital and rover images of the surface of Mars provide exceptional high-resolution views of the martian landscapes and its surface geology. These extensive datasets provide remarkable resources to teach undergraduate and graduate students about geological concepts and planetary geology. However, despite the panoramic aspect of many of these image datasets and their often very high resolution, the data are generally studied by students on small laptop computer screens or low-resolution projection systems in a classroom setting. This limits the ability to easily explore and interrogate the martian surface. Here, we describe how we use a large visualisation system at Imperial College to enhance student learning about the modern surface of Mars and its ancient past through group-based exploration of geological data returned by probes. Essentially, we take students on ‘fieldtrips’ to Mars.
Imperial College Data Observatory
Imperial College's Data Science Institute houses a remarkable facility, the Data Observatory (DO). This expansive, semi-circular display, spanning approximately ~ 6 m in width and extending from the floor to the ceiling, offers a truly immersive experience [https://www.imperial.ac.uk/data-science/facilities/data-observatory/]. With 313 degrees of visual coverage, it boasts over 132 million pixels provided by 64 fine-bezel, full HD screens. Figure 1 showcases the Data Observatory, featuring a control panel that empowers the presenter to select the desired demonstration, with a rendering of the London map on half of the visual canvas.
Scalable-resolution display environments, including immersive data observatories, are evolving into potent tools for joint data exploration and decision-making. However, effective operation of these platforms depends heavily on specialized middleware. Existing solutions often fall short in this domain, particularly in supporting scalable data visualization rendering effectively. To address these challenges, the Digital Output team developed the Open Visualization Environment (OVE), an innovative, modular, open-source middleware designed to overcome these limitations and enable groundbreaking advancements in large-scale data visualization.
Leveraging OVE as the core rendering engine, we have introduced two instrumental tools to enhance user interaction and streamline workflows. The first tool, next-ove, offers a visual editor that simplifies the design and implementation of large-scale demonstrations, facilitating efficient management of complex projects. The second tool, ove-jupyter, is a Jupyter Notebook extension that allows easy visualization of notebook cell outputs on a Data Observatory with just a couple of lines of configuration code, integrating seamlessly into users' existing workflows and significantly boosting the visualization capabilities within these advanced display environments.
A field- trip to Mars in the Imperial College Data Observatory
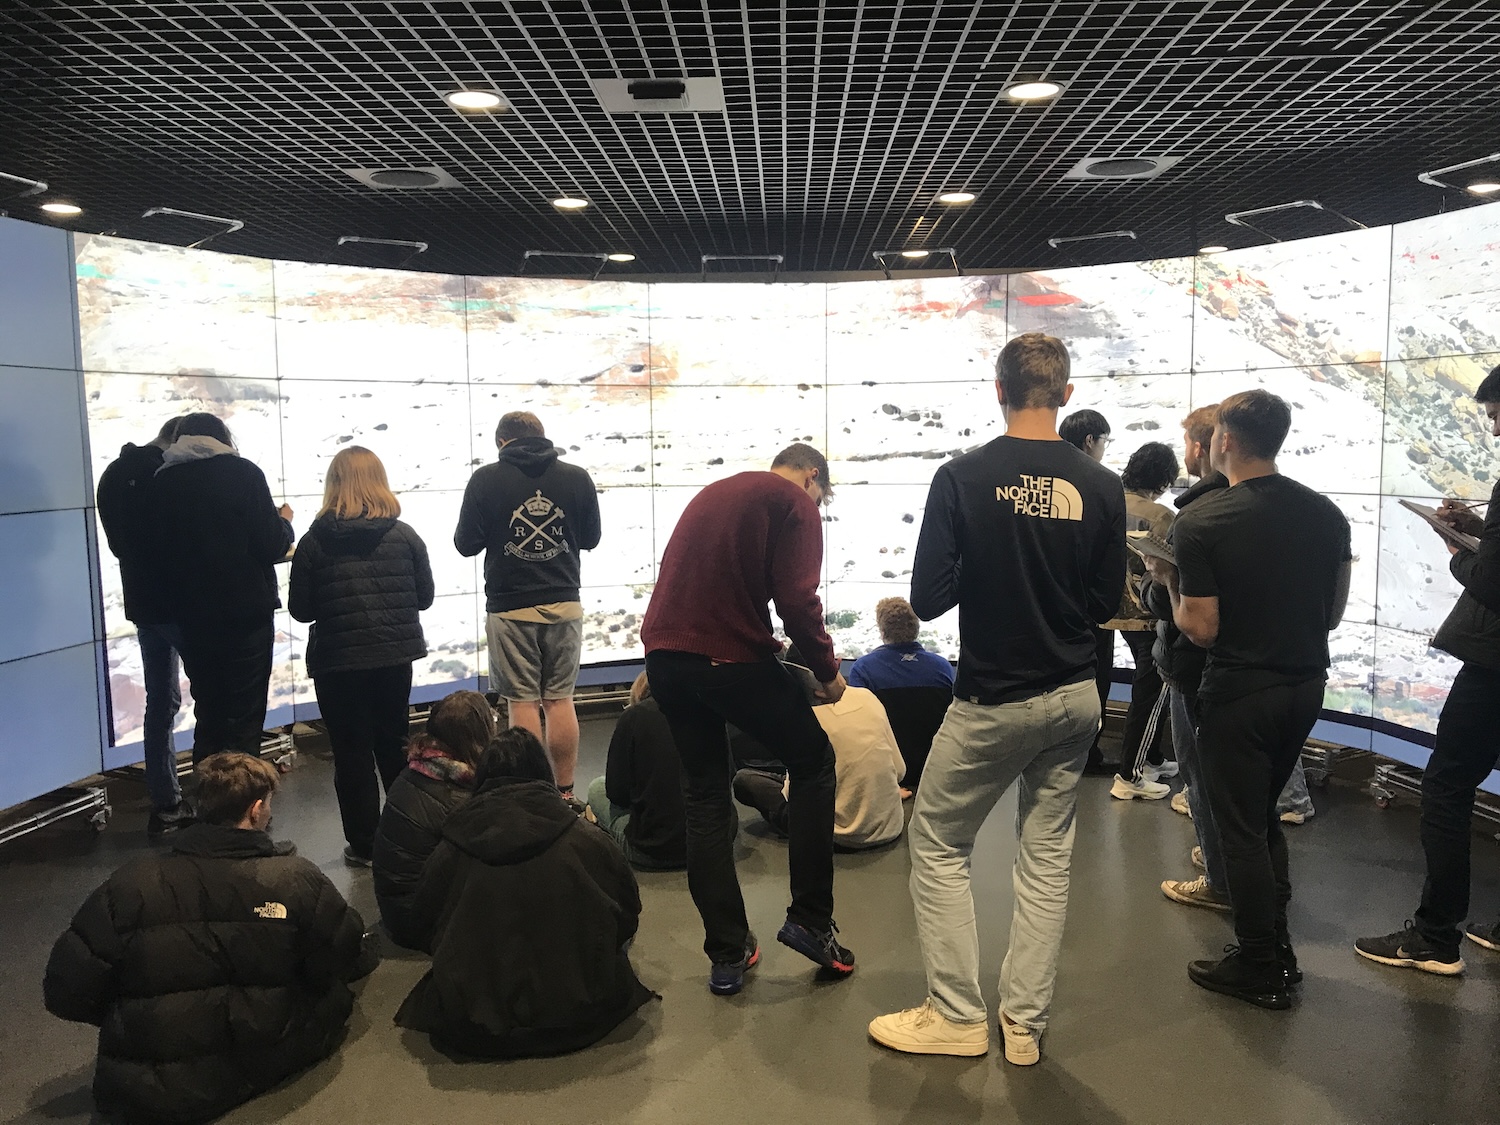
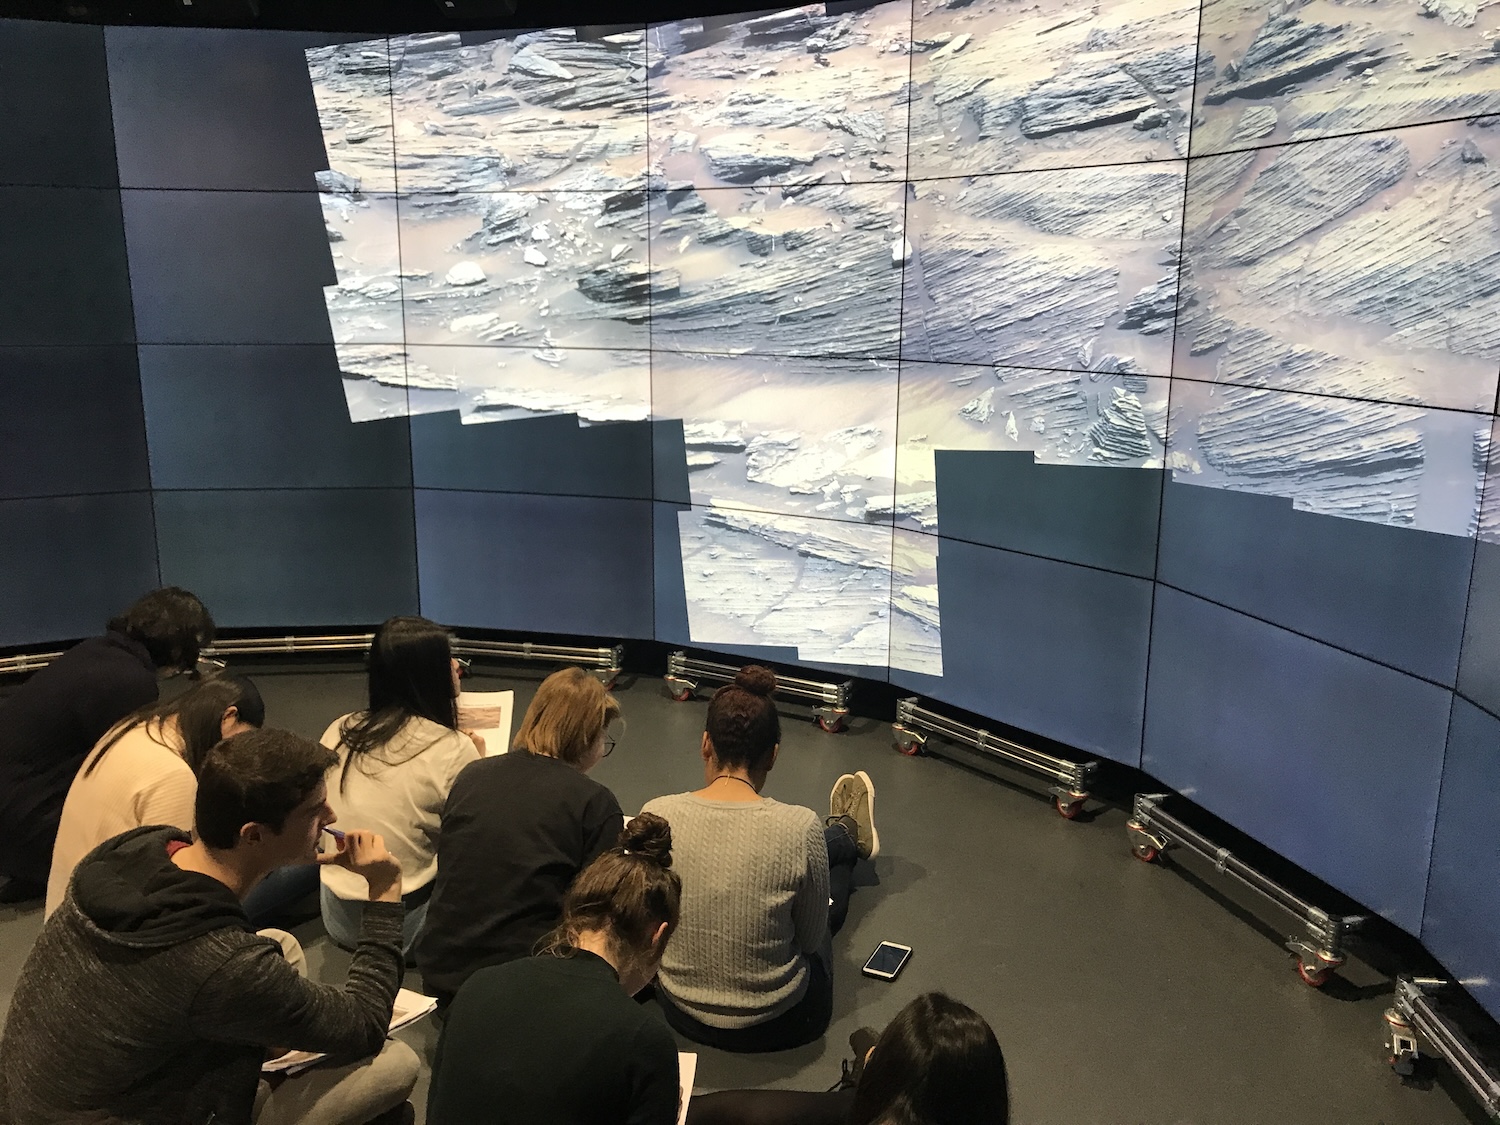
Whilst many planetary educational strategies highlight Virtual Reality and Augmented Reality as learning tools these are commonly solo activities. The very large-scale display system in the Imperial Data Observatory enables a combination of self-exploration and guided learning for up to ~20-25 students in a collective environment – much like a real-world fieldtrip on Earth. OVE enables rapid processing and display of very large image datasets in the Data Observatory. Typically, a learning session will involve a preliminary lecture introducing a planetary topic or case study, for example aeolian processes on Mars. This provides essential background enabling common entry to all students to the topic we will explore in the Data Observatory session. Subsequently we make the ‘trip’ on campus to the Observatory with students bringing their field notebooks and rucksacks much as they would on a real fieldtrip. During an educational session we typically explore 4-5 individual image mosaics depending on the learning activity and its goals. Students are then ‘allowed’ to explore the image of a geomorphic feature, for example a barchan dune or a sedimentary rock outcrop by themselves (Figure 2). They are strongly encouraged to explore and discuss jointly with their peers if they so wish. Typically no point-by-point task list or worksheet is provided. On questioning students have explained how they really appreciate the chance to look for themselves with no detailed instructor guidance on tasks. Typically, we allow 15-20 minutes per image (depending on image/topic complexity) for students to explore, make annotated sketches in their field notebooks (Figure 3) and draw interpretations and conclusions from their observations, just as they would in the field. We then discuss our findings in a group setting with students offering their observations, and as a group we develop and discuss interpretations and limitations.
A big advantage of the very large scale of the Data Observatory display system is that rather than zooming in and out of an image as you would do on a computer screen, , the large display allows students to ‘walk around’ the martian rock outcrop, looking up close at details and being able to step back to get the big picture. This ‘big picture’ context is often lost when interrogating the up-close details of a martian outcrop on a smaller screen. Whilst exploring a 2-D panorama is relatively simple compared to being able to view outcrops in 3-D in VR and AR systems, the simplicity of focussing and analysing a single panorama and collaborative nature of the learning activity, enhances the student experience. Significant value can be attached to group discussion with their peers.
In summary, ‘field excursions’ to the Data Observatory at Imperial enable the possibility of partially simulating the field experience in a remote place and in the case of Mars not currently accessible to humans. Here, we are able to navigate from the orbital scale down to the rover-derived outcrop scale enabling students to contextualise their observations. Virtual field trips to the Observatory not only provide a new extra-terrestrial experience for students, but can also act as a ‘primer’ for fieldwork on Earth. Virtual ‘fieldwork’ enables initial development of observational and data capture skills allowing valuable time in the field to be spent on more advanced learning activities. Finally, the DO offers accessibility for students who are unable to readily participate in fieldwork, and provides students the opportunity to gain a sense of actual fieldwork – without the rain!
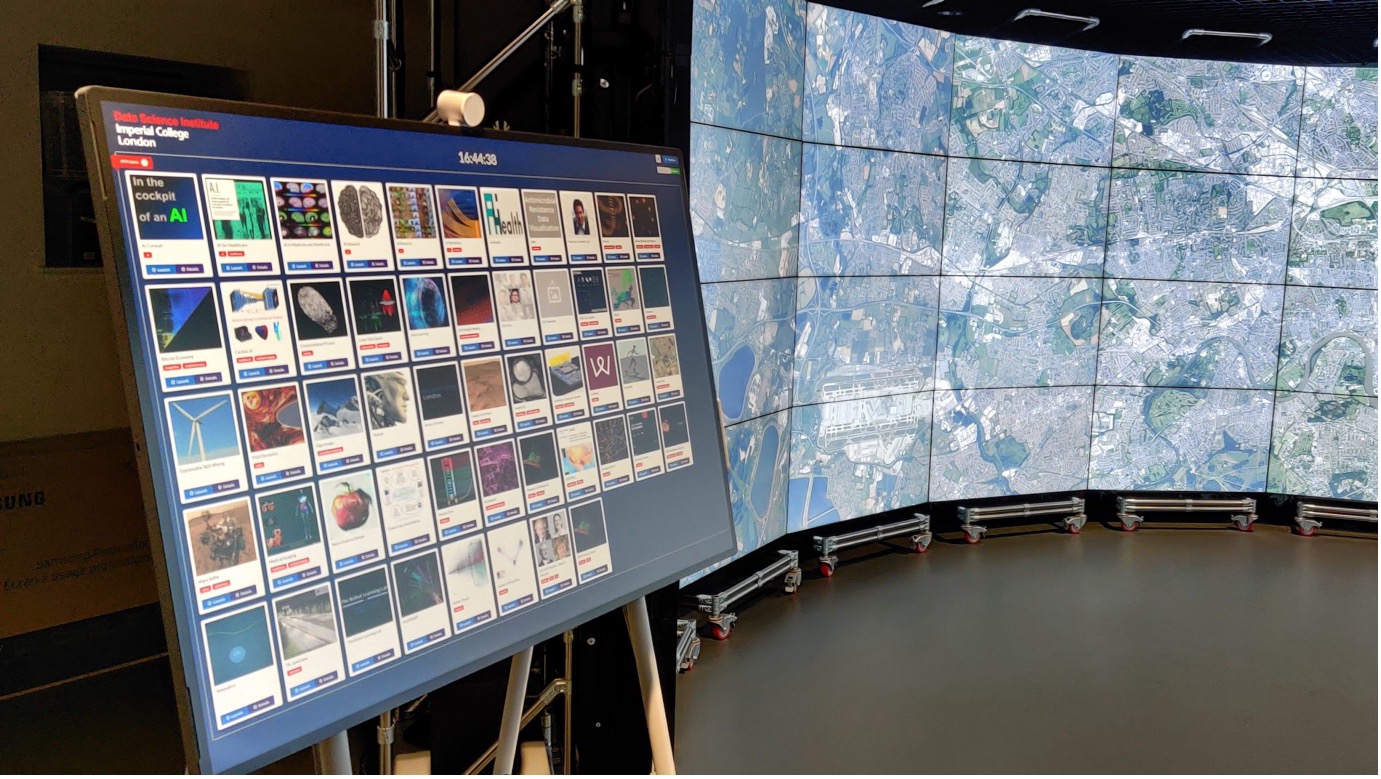
Figure 1 Overview of the Data Observatory
How to cite: Gupta, S., Ovidiu, S., Caley-Davies, B., Barnes, R., and Jones, A.: Fieldwork teaching on Mars using a Large-Scale Visualisation System, Europlanet Science Congress 2024, Berlin, Germany, 8–13 Sep 2024, EPSC2024-814, https://doi.org/10.5194/epsc2024-814, 2024.