
Tagging Titan's Terrains as Potential Sediment Deposits from the joint analysis of Cassini Active and Passive RADAR Observations
 1
1- 1LESIA, Observatoire de Paris, Université PSL, Paris France (robin.sultana@obspm.fr)
- 2LATMOS/IPSL, UVSQ Université Paris‐Saclay, Sorbonne Université, CNRS, Paris, France
Context and motivation
Under its thick atmosphere, Titan hosts a unique variety of geomorphological features [1] including indications of evidence of fluvial and/or pluvial activity [2,3,4]. Rivers, canyons, and alluvial fans have been mapped by the RADAR on board the Cassini probe which explored the cronian System from 2004 to 2017 [5]. Operating at a wavelength of 2.2-cm, the Cassini RADAR measured the variations of the surface normalized backscatter cross section coefficient (NRCS or σ°) in its active mode, while assessing the surface’s 2.2-cm emissivity (e) in its passive mode [6]. By virtue of the Kirchhoff's law of thermal radiation, these two quantities (σ° and e) are expected to be anti-correlated. However, they can sometimes be correlated, meaning they are sensitive to different properties of the surface/subsurface and can therefore bring complementary information. Typically, σ° is very sensitive to surface roughness while e is tightly related to near-subsurface composition and temperature (through brightness temperature).
Investigating the relationship between σ° and e may highlight regions with peculiar structural and/or composition properties or temperature anomalies. In particular it has been proposed as a way to detect (cryo-)volcanic hot spots on Titan and Venus [7].
For this work, we have analysed the relationship between σ° and e considering all active and passive data acquired by the Cassini RADAR during the mission. This investigation has led to the detection 10 areas for which σ° and e are highly correlated. Relying on the geomorphological interpretation of these areas as well as on a combined radar and radiometry model we propose an explanation for this correlation which involves the presence of sediment deposition layers.
Methods
By the end of the Cassini mission, the Cassini RADAR had recorded simultaneously the backscatter σ° and brightness temperature Tb of about 65% of Titan’s at a resolution of, at best, 5km (the size of the real-aperture footprint on the ground). Tb is easily converted into emissivity thanks to the surface temperature model derived from the Composite InfraRed Spectrometer (CIRS) observations [8]. We developed a code investigating the correlation between e and σ° and in particular to search for areas where these two quantities are spatially correlated during at least 15 consecutive footprints. We have thus identified ten regions of interest (RoI) where the correlation coefficient is greater than 0.9 (Fig. 1b). Most of them (eight) are located in the austral hemisphere, and seven in the polar region (Fig. 1a).
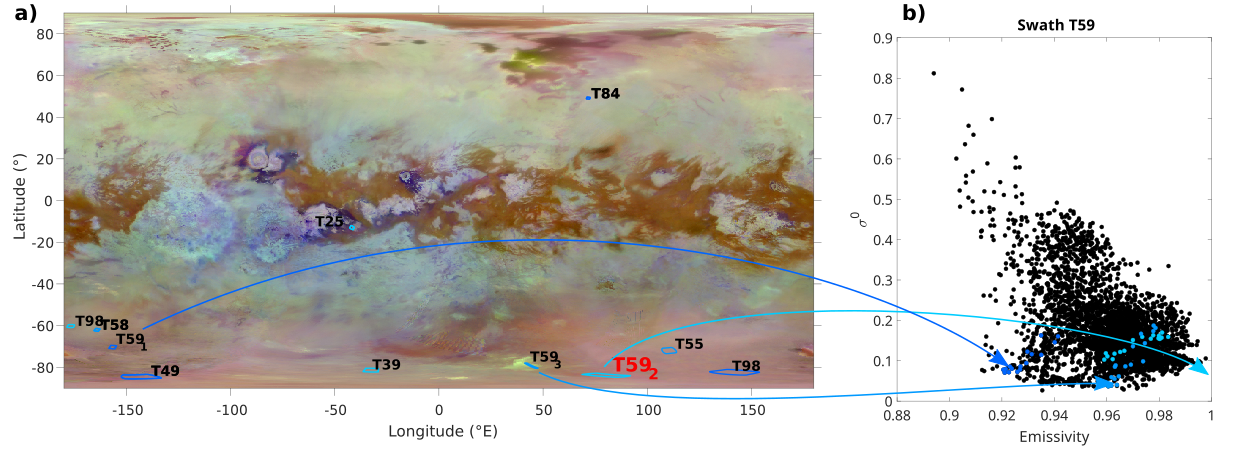 Figure 1: a) Geographical location of the RoIs where e and σ° are spatially correlated (correlation coefficient >0.9) overlaid on a global VIMS mosaic of Titan’s surface [9]. b) Scatterplot of σ° versus e for the T59 swath (black dots) and the RoIs identified in this swath (blue dots).
Geomorphological analysis: The case of T592
For each RoI, we generated a comprehensive set of maps (Fig. 2 for the T592 RoI, highlighted in red on Fig. 1a), including a SAR image (Fig. 2a), an emissivity map (Fig. 2a), and a geomorphological analysis of the RoI and adjacent terrains (Fig. 2c). Terrain units were discerned from SAR images, building upon the framework established by [1] and tailored to the specific scale of this study.
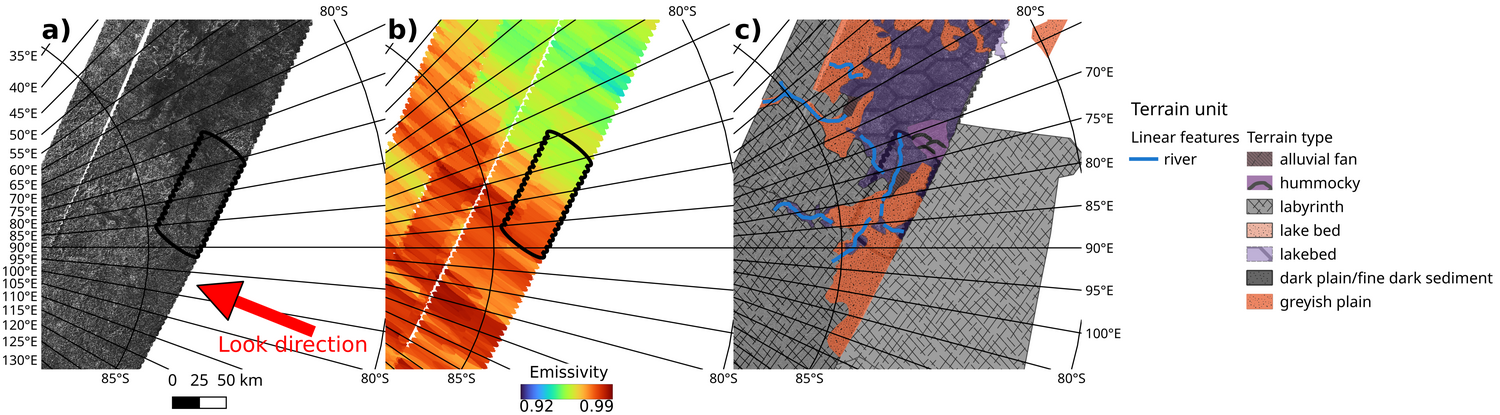 Figure 2: Cassini SAR image a), emissivity map b) and geomorphological analysis c) of a portion of the T59 RADAR swath where a RoI was identified.
In the case of T592 RoI, the vicinity of the correlation zone includes labyrinthic terrains, plains and rivers flowing into a large radar-dark region of low altitude (according to topography data) identified as a possible dry paleolake. The RoI is centred on a triangularly-shaped radar-dark feature of dimension 19x47km2, crossed by a canyon (digged by rivers) and tagged as an alluvial fan. A similar but smaller triangular dark feature can be seen on the west despite not being detected.
Comparison to a combined radar and radiometer model
Consistent with our geomorphological analysis, we propose that the correlation between e and σ° could be explained by the presence of two superimposed layers with the bottom layer having a lower permittivity and a larger roughness than the top layer. Top layer could be made of fine-grained organic sediments deposited over a rough substrate of water ice or solidified organics. Such hypothesis is supported by the two-layer radar and radiometry model we developed based on [9,10] for e and [11] for σ° (Fig. 3). Variations along the correlation slope would be simply due to variations of the thickness of the upper layer from one radar/radiometry footprint to the other.
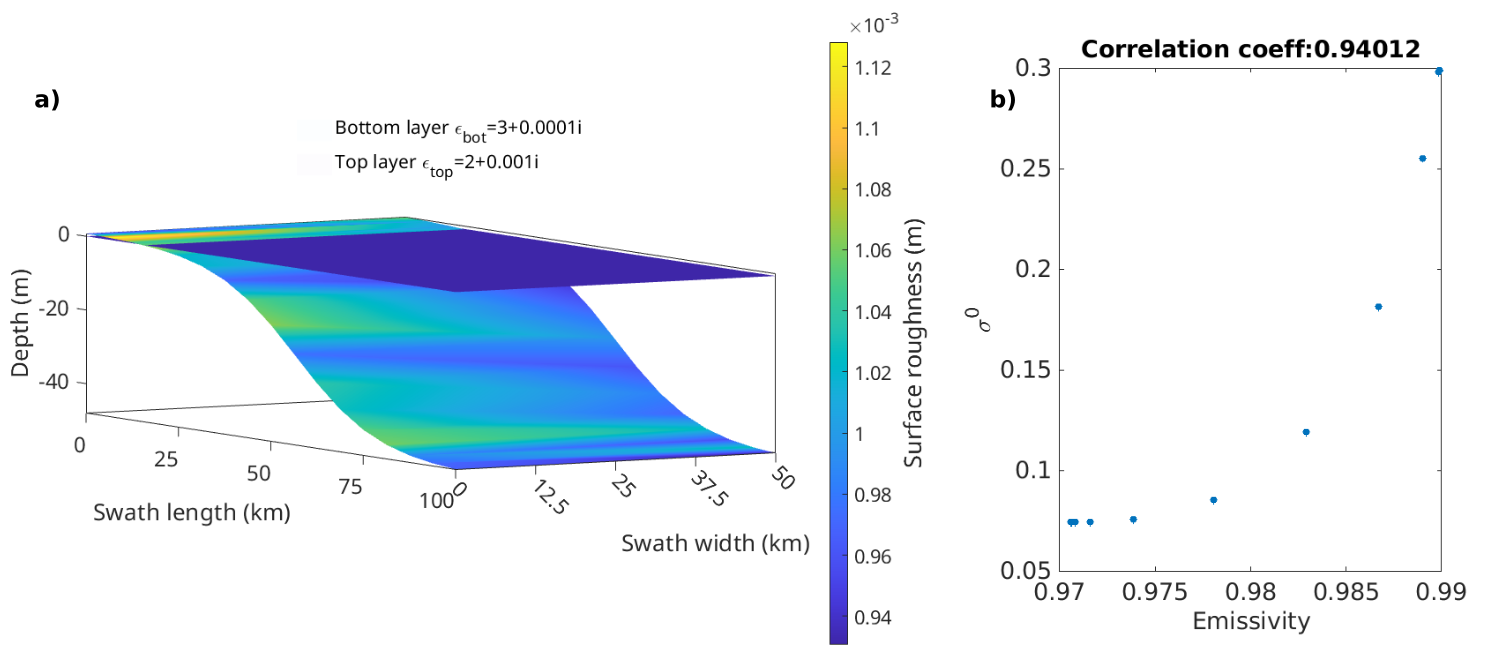
Figure 3: a) 2-layer model displaying the roughness of the upper and lower layers and the distance between the interfaces (i.e. upper layer thickness). The top layer has a permittivity of 2+0.001j and the bottom layer of 3+0.0001j. d) Scatterplot of the simulated emissivities and σ° with the computed correlation coefficient.
Discussion and Perspectives
We have found that, among the ten RoIs detected as exhibiting a strong positive correlation between Cassini active and passive RADAR dataset, six are geomorphologically consistent with areas of sediment deposition as they exhibit features due to fluvial activity in an ancient lake system. In this paper, we will further describe these regions and how the joint analysis of active and passive radar data can serve as a tool for detecting them.
References
[1] Lopes+2020
[2] Stofan+2007
[3] Malska+2016
[4] Malaska+2020
[5] Elachi+2005
[6] Paganelli+2008
[7] Lorenz+2016
[8] Jennings+2019
[9] Le Mouelic+2008
[10] Ulaby & Long2014
[11] Le Gall+2016
[11] Hayes+2010
How to cite: Sultana, R. and Le Gall, A.: Tagging Titan's Terrains as Potential Sediment Deposits from the joint analysis of Cassini Active and Passive RADAR Observations, Europlanet Science Congress 2024, Berlin, Germany, 8–13 Sep 2024, EPSC2024-824, https://doi.org/10.5194/epsc2024-824, 2024.