
 1,2,1,3,4,2,6
- 1German Aerospace Center, Institute of Optical Sensor Systems; Department In-Situ Sensing, Berlin, Germany (kristin.rammelkamp@dlr.de)
- 2Institut de Recherche en Astrophysique et Planétologie, Toulouse, France
- 3Univ. Lyon, LGL-TPE, France
- 4LPG Nantes Université, France
- 5Georgia Institute of Technology, USA
- 6LANL, Los Alamos, USA
Laser-induced breakdown spectroscopy (LIBS) is a multi-elemental analysis technique which uses laser pulses to ablate material from a target which can be located several meters away from the laser source, making the method particularly useful for in-situ planetary exploration. The first LIBS instrument employed on another planet is ChemCam which belongs to the payload of NASA’s Mars Science Laboratory (MSL) and which has been investigating the surface of Mars in Gale crater since 2012 [1, 2]. During this time and due to its regular use – almost every sol- a very large amount of data was collected: LIBS data were acquired from more than 32 000 points on Martian targets [3]. In order to obtain quantitative elemental abundances, a regression model based on the multivariate methods partial least squares regression (PLS-R) and independent component analysis (ICA) is used to predict the concentrations of the major rock forming oxides (SiO2, TiO2, Al2O3, FeOT, MgO, CaO, Na2O, K2O) by the team [4]. The model was trained on data from more than 400 standards measured on Earth with a replica instrument. This data set was also used in other studies to train for example neural networks (NN) [5]. However, this size of a dataset is still small for the training of advanced machine learning (ML) models and in general the use of supervised ML algorithms for ChemCam data is challenging due to the lack of training data from Mars. Another approach to analyze the big and diverse ChemCam LIBS dataset is to first use unsupervised techniques such as feature extraction methods followed for example by clustering, e.g. [6]. In that way it is possible to (1) identify similar targets based on their LIBS spectra and to (2) use the obtained clusters as labels and train supervised ML models. Here, we present selected unsupervised data exploration methods which have the potential to identify similar targets, dominant compositions of Mars targets measured with ChemCam and transitions between different geological units.
A LIBS measurement on a ChemCam target is typically a raster of 5–25 observation points from which each corresponds to usually 30 laser shots (i.e., 30 spectra) [7]. This allows to track chemical variability also with depth as each laser shot samples material slightly deeper than the previous one. Usually the spectra from shot 6-30 are averaged - the first 5 are omitted due to the surface dust contamination - so that one LIBS spectrum is obtained per measurement point in the raster. If these average spectra are arranged in two-dimensional matrices, they can be analyzed using matrix decomposition techniques (see schematics in Fig. 1) such as principal component analysis (PCA), non-negative matrix factorization (NMF) or ICA. They may rely on different mathematical assumptions, but in general they all return lower-dimensional matrices with so-called scores and loadings. The latter can be interpreted spectrally as they usually show emission lines from the elements similar to the original LIBS spectra, and the scores then indicate how much of each loading is present in a LIBS spectrum. Another possibility is not to average the spectra and to use the 30 spectra of a measurement point as a third dimension, so that the ChemCam data are arranged in a three-dimensional data tensor. Similar to the matrix decomposition techniques, methods from the tensor component analysis (TCA) family can be used to incorporate correlations with depth in the analysis (see schematics in Fig. 2). This can be beneficial for mineral identification based on potential correlations among elemental emission lines in successive LIBS spectra with depth, assuming that the elements primarily belong to one mineral phase.
In this study, we investigate both types of approaches the two- and three-dimensional cases for selected ChemCam LIBS datasets. The results are compared and, in particular, analyzed to figure out where the shot-to-shot analysis adds an additional insight compared to the average spectra. The data sets analyzed are mainly from the sulfate bearing unit, which is the unit that Curiosity has been driving through and investigating with its instruments for almost two Earth years now (started about sol 3700 of the mission). We focus on the general bedrock targets, which show contributions from Mg-and Ca sulfates as well as a strong Fe phase and halite [8]. In addition, when not filtered by target type, float rocks with a more Stimson like composition are also observed as a distinct group of targets [9]. A further target type appears, which is potentially a mixture of Mg and Na sulfate and is characterized by an F-bearing phase [10]. The results of both approaches applied to all these targets summarized in one dataset and to smaller sub-datasets filtered by target type will be presented.

Figure 1: Schematic of the matrix decomposition for ChemCam mean spectra. Each spectrum consists of 6144 wavelength bins, n is the number of observations included in the decomposition and R is the dimensionality of the model to be chosen.
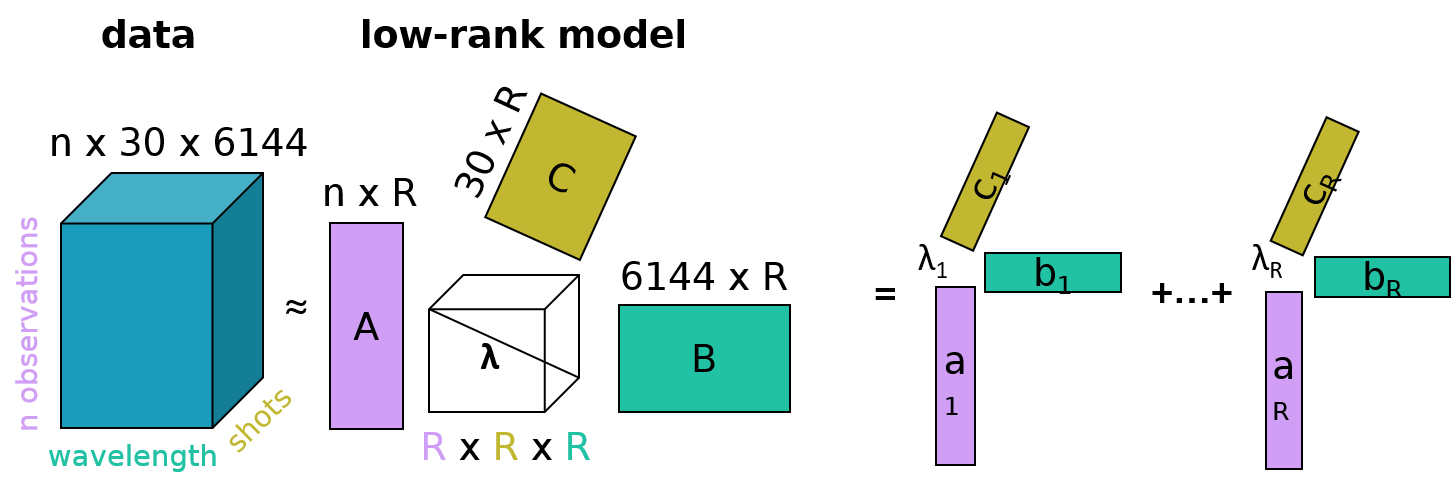
Figure 2: Schematic of TCA for ChemCam LIBS shot-to-shot data. Same meaning of n and R as in Figure 1. λ is a normalization factor so that the columns of matrices A, B, and C are all normalized to one.
References
[1] Maurice et al. (2012), SSR, 170
[2] Wiens et al. (2012), SSR, 170
[3] Gasnault (?) et al. (2024), EPSC, this meeting
[4] Clegg et al. (2017), SAPB, 129, 64
[5] Castorena et al. (2021), SAPB, 178
[6] Rammelkamp et al. (2021), EASS, 8
[7] Maurice et al. (2016), JAAS, 4
[8] Rammelkamp et al. (2024),
[9] Le Deit et al. (2024), 10th int. Mars conference
[10] Hughes et al. (2024), LPSC, #2288
How to cite: Rammelkamp, K., Gasnault, O., Schröder, S., Dehouck, E., Forni, O., Le Deit, L., Cousin, A., Lasue, J., Lomashvili, A., Hughes, E. B., and Lanza, N.: Unsupervised Data Exploration of ChemCam LIBS data from Gale crater, Mars, Europlanet Science Congress 2024, Berlin, Germany, 8–13 Sep 2024, EPSC2024-869, https://doi.org/10.5194/epsc2024-869, 2024.