
Synthetic topography, roughness, albedo, and thermal inertia maps for mesoscale modeling on Titan
 1,2,1,4,4
- 1Sorbonne Université, LMD, Paris, France (lb543@cornell.edu)
- 2LATMOS/IPSL, Sorbonne Universités, UVSQ, CNRS, Paris, France
- 3Cornell Center for Astrophysics and Planetary Science (CCAPS), Cornell University, Ithaca, 14850, NY, USA
- 4Université Paris Cité, Institut de physique du globe de Paris (IPGP), CNRS, Paris, France
Titan’s climate includes dynamic processes at multiple scales, ranging from local turbulence to global super-rotation. Several mesoscale models are currently being developed which will permit simulations of surface winds at kilometric resolutions. However, mesoscale modeling requires high-resolution topography as an input, as it can be one of the primary controls on surface wind directions and amplitudes. The Cassini-Huygens mission, which spent 13 years in orbit around Saturn, mapped Titan’s surface at resolutions up to about 300 m/pixels with its RADAR instrument, which operated at a wavelength of 2.17 cm (13.78 GHz frequency, Ku-band). Titan’s best topography maps (Corlies et al., 2017) consist in a combination of radar altimetry, the SARTopo dataset (Stiles et al., 2009), and SAR stereoradargrammetry, interpolated where data is unavailable. The available topographic information thus has low spatial resolution, unequal coverage, and very variable accuracy (e.g., Fig. 1), rendering it unusable as an input for mesoscale modeling. In the absence of better topography data for the foreseeable future, we create fully parametrized synthetic topography, based on the surface geomorphology and the available topography. A similar method is used to create synthetic maps of the surface albedo, aerodynamic roughness length, and thermal inertia, whose influence on surface winds can thus be tested.
In order to study (1) the surface atmospheric and sedimentary environment at the Dragonfly landing site and (2) the role of surface liquids in mesoscale atmospheric circulation, we focus on two regions: a 1000-km-wide region centered on the Dragonfly landing site near Selk crater, and a 250-km-wide area in the northern small lakes region. We first create a geomorphological map based on Cassini Synthetic Aperture Radar (SAR) images (Fig. 1), simpler than previous geomorphological maps of these regions (Malaska et al., 2016; Birch et al., 2017) in order to minimize the number of parameters. Each geomorphological unit (dune fields, mountains, plains, craters, lakes, valleys…) is given a fully parametrized shape, and a random surface topographic roughness is added everywhere (except on the smooth lakes). Reasonable values of the parameters are chosen from existing topography data, resulting in maps such as the one in Fig. 2. The same method is applied to create synthetic maps of the thermal inertia, surface albedo, and aerodynamic roughness z0: each unit is assigned a value chosen from the literature.
The resulting topography, albedo, thermal inertia, and roughness maps are simplified and assume that all features of a unit are identical: these maps therefore look reasonable, but are non-unique and cannot match well with the observations. However, they have the great advantage of being parametrized, which allows us to vary each parameter and test its influence on mesoscale model outputs such as surface winds. Some key questions that we are seeking to answer include: At what height do crater rims and mountains on Titan start to significantly influence surface winds? How do the winds in a realistic lakes region compare to those over an idealized circular lake? Can topography cause wind patterns responsible for the dune morphologies observed on Titan, including cross-hatched dunes at the Dragonfly landing site?
In the equatorial region, which is a dry, desert environment, we use the mesoscale model developed by Lefèvre et al. (abstract in this session), which couples the Weather-Research Forecast (WRF) nonhydrostatic dynamical core (Skamarock et al., 2008) with the LMD Titan PCM physics package (Lebonnois et al., 2012). Meanwhile, in the North polar small lakes region, we use the mesoscale Titan WRF, which reproduces the methane cycle, and can therefore model the evaporation and transport of methane (Chatain et al., abstract in this session).
While other presentations at EPSC (Chatain et al., Lefèvre et al.) will focus on the mesoscale modeling efforts, including the effect of topography on the model, we will detail the synthetic topography model and present preliminary results on the relationship between surface winds and dune morphology for a “best guess” topography. In particular, we use the surface winds output by the mesoscale model in the equatorial regions as inputs to the IPGP dune morphodynamics model (Narteau et al., 2009) to attempt to reproduce the reticulated dunes observed around Selk crater (Malaska et al., 2016).
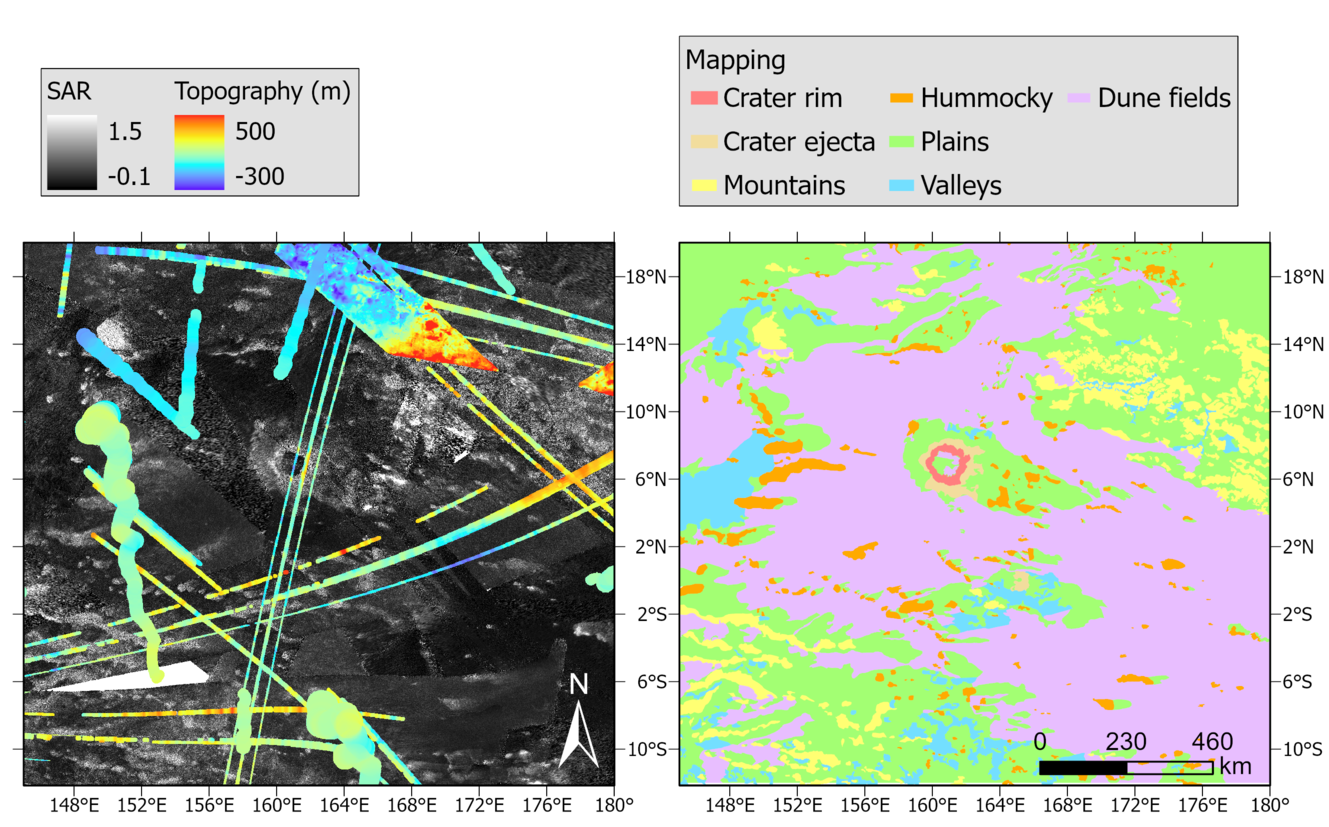
Figure 1: Mapping the Selk crater region from Cassini SAR and topography
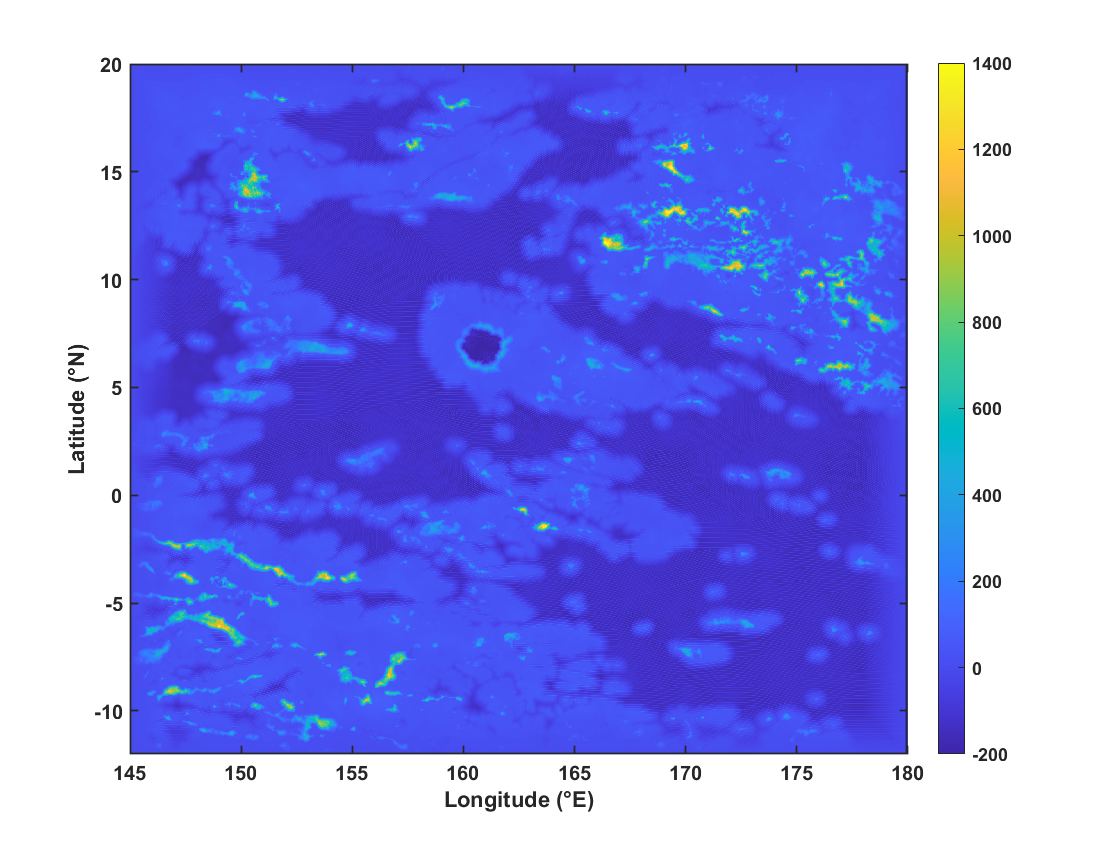
Figure 2: A synthetic topography map of the Selk crater region. Altitude is given in meters.
References:
Birch, S.P.D., A.G. Hayes, W.E. Dietrich, A.D. Howard, C.S. Bristow, M.J. Malaska, J.M. Moore, et al. “Geomorphologic Mapping of Titan’s Polar Terrains: Constraining Surface Processes and Landscape Evolution.” Icarus 282 (January 2017): 214–36. https://doi.org/10.1016/j.icarus.2016.08.003.
Corlies, P., A. G. Hayes, S. P. D. Birch, R. Lorenz, B. W. Stiles, R. Kirk, V. Poggiali, H. Zebker, and L. Iess. “Titan’s Topography and Shape at the End of the Cassini Mission: CORLIES ET AL: TITAN’S TOPOGRAPHY.” Geophysical Research Letters 44, no. 23 (December 16, 2017): 11,754-11,761. https://doi.org/10.1002/2017GL075518.
Lebonnois, Sébastien, Jérémie Burgalat, Pascal Rannou, and Benjamin Charnay. “Titan Global Climate Model: A New 3-Dimensional Version of the IPSL Titan GCM.” Icarus 218, no. 1 (March 2012): 707–22. https://doi.org/10.1016/j.icarus.2011.11.032.
Malaska, Michael J., Rosaly M.C. Lopes, David A. Williams, Catherine D. Neish, Anezina Solomonidou, Jason M. Soderblom, Ashley M. Schoenfeld, et al. “Geomorphological Map of the Afekan Crater Region, Titan: Terrain Relationships in the Equatorial and Mid-Latitude Regions.” Icarus 270 (May 2016): 130–61. https://doi.org/10.1016/j.icarus.2016.02.021.
Narteau, C., D. Zhang, O. Rozier, and P. Claudin. “Setting the Length and Time Scales of a Cellular Automaton Dune Model from the Analysis of Superimposed Bed Forms.” Journal of Geophysical Research 114, no. F3 (July 28, 2009): F03006. https://doi.org/10.1029/2008JF001127.
Skamarock, William C., and Joseph B. Klemp. “A Time-Split Nonhydrostatic Atmospheric Model for Weather Research and Forecasting Applications.” Journal of Computational Physics 227, no. 7 (March 2008): 3465–85. https://doi.org/10.1016/j.jcp.2007.01.037.
Stiles, Bryan W., Scott Hensley, Yonggyu Gim, David M. Bates, Randolph L. Kirk, Alex Hayes, Jani Radebaugh, et al. “Determining Titan Surface Topography from Cassini SAR Data.” Icarus 202, no. 2 (August 2009): 584–98. https://doi.org/10.1016/j.icarus.2009.03.032.
How to cite: Bonnefoy, L. E., Lefèvre, M., Chatain, A., Spiga, A., Hayes, A. G., Rodriguez, S., and Lucas, A.: Synthetic topography, roughness, albedo, and thermal inertia maps for mesoscale modeling on Titan, Europlanet Science Congress 2024, Berlin, Germany, 8–13 Sep 2024, EPSC2024-907, https://doi.org/10.5194/epsc2024-907, 2024.