
Spectral variability in the south polar region of Mars
 1,3,
1,3,- 1Institute for Planetary Research, DLR, Rutherfordstrasse 2, 12489 Berlin, Germany
- 2Institut d’Astrophysique Spatiale, CNRS, Université Paris-Saclay, 91400 Orsay, France
- 3Institut de Recherche en Astrophysique et Planétologie, CNES, Université Toulouse III Paul Sabatier, CNRS, 31028 Toulouse, France
Introduction. Visible and near-infrared observations of Mars have revealed a wide range of primary and secondary alteration minerals. Hydrated minerals were first identified from orbit with the Observatoire pour la Minéralogie, l’Eau, les Glaces, et l’Activité (OMEGA) instrument. OMEGA data were used to produce global maps of aqueous minerals [1], including the polar regions [5], in particular the northern one [2]. Recently, the Mars Orbital Catalog of Aqueous Alteration Signatures project [3] including OMEGA observations and data from the Compact Reconnaissance Imaging Spectrometer for Mars (CRISM) produced a set of the more accurate and resolved maps of aqueous minerals at latitudes ranging from 70°S to 70°N. However, no recent systematic study of the distribution and nature of the aqueous composition has been carried out in the south polar regions. OMEGA observations highlighted spectral variability of the Martian high latitude surfaces [5, 4]. In particular, the 1.9 µm and 3 µm band depths increase from 60° latitudes towards the poles [1, 5], which suggests that hydrated minerals may participate in this spectral variability. [4] indeed reported the detection of a deep and relatively narrow absorption band at 3 µm coupled with a shallow but significantly wider 4 µm feature in the northern high latitudes of Mars. This feature may be related to sulfates and has no significant counterpart in the south for now. Moreover, the 1.9 µm band is significantly broader and shifts to slightly longer wavelengths in the south polar region which seems to indicate a specific mineralogy, and/or a different hydration state from that of the north [5]. Here we present a spectral analysis and the detection of hydrated minerals in the south polar region.
Method. OMEGA has been observing the Martian surface since 2004 between 0.35 and 5.1 µm. Here, we selected observations acquired during southern spring and summer as high latitudes are covered by seasonal ice during winter. OMEGA data have been processed using the OMEGA-Py Python module [8]. Our analyses focus on the detection and characterization of hydrated minerals using several spectral criteria previously defined: the band depths (BD) at 1.9 µm [4], 2.1 µm [6] and 2.4 µm [4]; the narrow and wide 3 µm band depths [4] and the SINDEX [6]. We have developed a new estimator adapted to the broader and shifted 1.9 band observed in the southern high latitudes, called here the “wide 2 µm band depth (WBD)”. This criterion estimates the band depth centered at 2 µm using the average continuum from 1.75 to 1.85 µm and 2.20 to 2.30 µm. Since the 3 µm band is very sensitive to the presence of water ice at the surface or in the atmosphere [7], we remove pixels with a water ice absorption at 1.5 µm>1%. In order to prevent possible effects related to viewing geometry, we removed pixels with emergence and incidence angles respectively higher than 10° and 75°. We then isolate detections of sulfate-bearing units thanks to a combination of four of these spectral criteria: the BD at 1.9, 2.1 and 2.4 µm and the SINDEX.
Results. The spatial distribution of all the spectral criteria over the whole OMEGA dataset in the south polar region have been investigated. All the criteria exhibit a strong variability in this region. The narrow 3 μm BD identified for the first time by [4] in the north polar region shows a different behavior in the south polar region. This spectral parameter varies mainly from 0 to 10% in the southern polar region while it increases to more than 30% in the northern polar region. The WBD at 2 µm is present at all longitudes between 50°S and 90°S and varies from 1% to 6% (Fig 1). The wide 3 μm BD is almost always higher than 35% and increases over 65% in this region. The WBD at 2 µm and the WBD at 3 µm increase with latitude toward the south pole (Fig 1). In addition to latitudinal variations, the WBD at 2 µm exhibits seasonal variations and decreases over the summer. The map of hydrated minerals detections in the south polar region (Fig 2) shows a high concentration of sulfate-bearing units around the polar cap. High-resolution CRISM observations obtained over this unit confirm that the spectral signatures can be confidently attributed to sulfates.
Perspectives. The spectral signatures between the sulfate detections presented here and the sulfates in Meridiani Planum are different especially around 3 μm which may indicate different sulfates compositions and/or different mixings with other minerals. Such differences may provide clues about the specific sulfates formation and transformation pathways expected at high latitudes. The ring-like structure of the south polar sulfates suggest a formation associated with seasonal frost and/or polar ice cap. The absence of the narrow 3 μm band depth around the south pole differentiate the two Martian poles in term of spectral variations. Further study of the spectral signatures and comparison with geological maps is in progress, and will help constrain the scenario for the formation of these hydrated minerals in the South Polar region.
References
[1] Poulet et al., (2007). JGR: Planets, 112(E8). [2] Langevin et al., (2005). Science, 307, 5715. [3] Carter et al., (2023). Icarus, 389, 115164. [4] Stcherbinine et al., Icarus, 369, 114627 (2021). [5] Poulet et al., GRL, 35(20) (2008). [6] Viviano-Beck et al., JGR:Planets, 119(6), 1403-1431(2014). [7] Jouglet et al., JGR:Planets 112.E8 (2007). [8] Stcherbinine (2023). Zenodo, doi:10.5281/zenodo.10035061
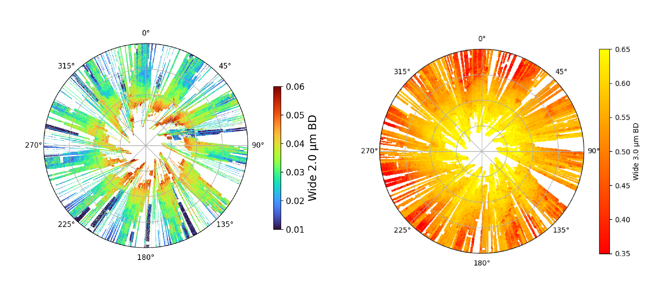
Figure 1: Composite maps of 833 OMEGA observations in the south polar region of Mars. Solar longitude of the observations ranges from 260° to 340°, corresponding to late southern spring and southern summer. Color codes shows the spectral variations of the wide 2 µm band depth (left) and the wide 3 µm band depth (right).
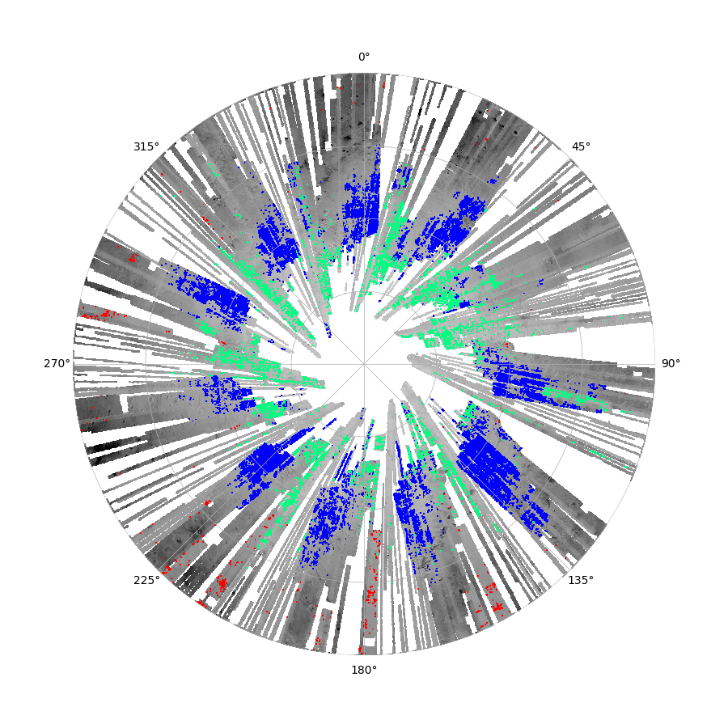
Figure 2: Map of hydrated mineral detections in the south polar region of Mars (50°S-90°S). Pixels in blue represents monohydrated sulfates detection, in green polyhydrated sulfates detection and pixels in red are phyllosilicates detection. Based map is the wide 3 µm band depth.
How to cite: Barraud, O., Carter, J., Vincendon, M., Stcherbinine, A., and Sheppard, R.: Spectral variability in the south polar region of Mars, Europlanet Science Congress 2024, Berlin, Germany, 8–13 Sep 2024, EPSC2024-921, https://doi.org/10.5194/epsc2024-921, 2024.