
Analyzing the variability of zonal winds in Venus mesosphere using VIRTIS/VEx temperature maps
 1,2,2,3,
- 1Royal Belgian Institute for Space Aeronomy (BIRA-IASB), Planetary Atmospheres, Uccle, Brussels, Belgium (arianna.piccialli@aeronomie.be)
- 2INAF - IAPS, Istituto di Astrofisica e Planetologia Spaziali, Via del Fosso del Cavaliere, 100, I-00133 Rome, Italy
- 3LMD/IPSL, CNRS, Sorbonne Université, Paris, France
- 4Institut d'Astrophysique de Paris, Sorbonne Université, CNRS & LESIA, Observatoire de Paris, PSL, France
Introduction
We present zonal thermal winds derived by applying the cyclostrophic balance from the Visible and Infrared Thermal Imaging Spectrometer (VIRTIS) temperature retrievals. VIRTIS was one of the experiments on board the European mission Venus Express [1]. It consisted of two channels: VIRTIS-M and VIRTIS-H. For this study, we analyze the complete VIRTIS-M dataset acquired between December 2006 and January 2010 [2,3], which will allow us to investigate both the day-to-day and local time variability.
Mesosphere dynamics
Venus is a natural laboratory to study the atmospheric circulation on a slowly rotating planet. The dynamics of its upper atmosphere (60-120 km) is a combination of retrograde zonal wind found in the lower mesosphere and solar-to-antisolar winds that characterize the thermosphere, and it is subject to a strong turbulence and a dramatic variability both on day-to-day as well as longer timescales. Moreover, several wavelike motions with different length scales have been detected at these altitudes within and above the clouds and they are supposed to play an important role in the maintenance of the atmospheric circulation. The basic processes maintaining the super-rotation (an atmospheric circulation featuring zonal winds at the clouds level being 60 times faster than the rotation of the planet itself) and other dynamical features of Venus circulation are still poorly understood [4].
Temperature maps
We used temperature retrievals derived from the VIRTIS experiment on board the European mission Venus Express [1]. VIRTIS consisted of two channels: VIRTIS-M and VIRTIS-H. In this study, we analyzed the complete VIRTIS-M dataset acquired between December 2006 and January 2010, corresponding to orbits #23 to #843 [2,3]. Figure 1 shows the latitude-altitude temperature field averaging the whole VIRTIS-M dataset.
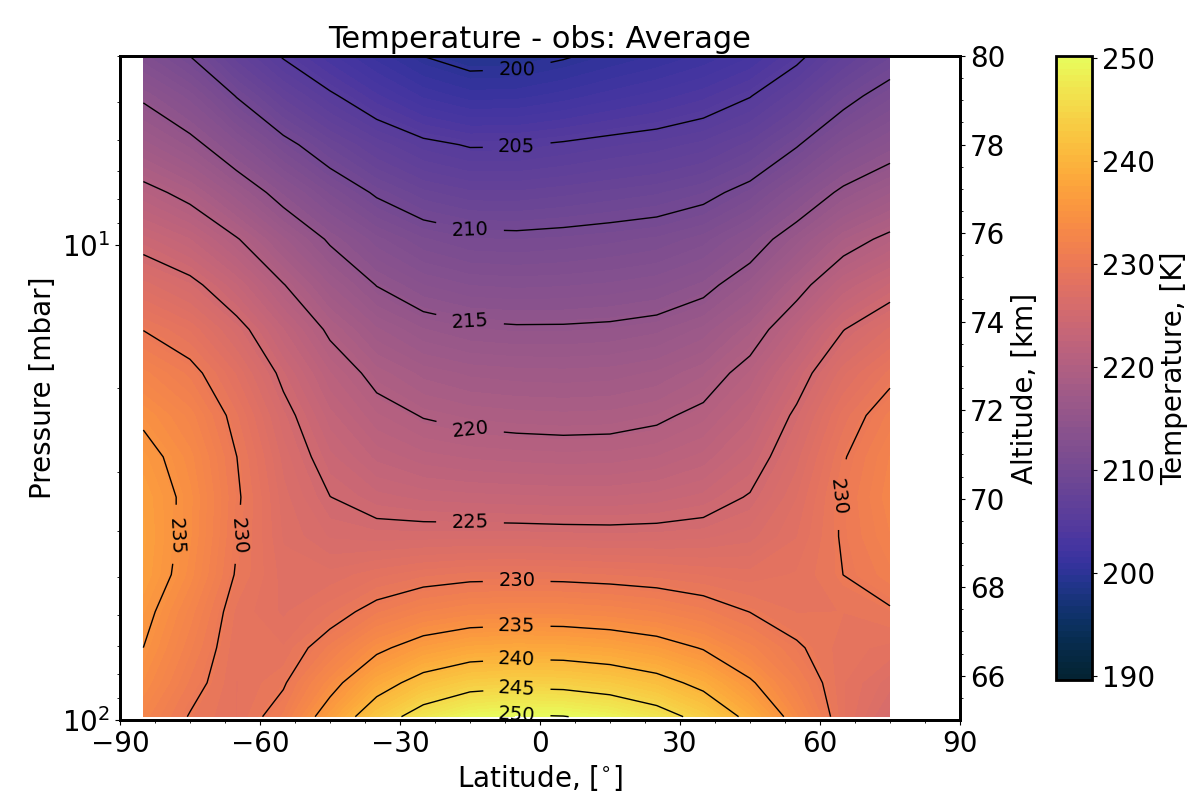
Figure 1: Temperature cross-section obtained averaging the whole VIRTIS-M dataset. The data was acquired between 14 May 2006 and 15 August 2008[1] (orbits 23-843)
Winds maps
Different techniques have been used to obtain direct observations of wind at various altitudes: tracking of clouds in ultraviolet (UV) and near infrared (NIR) images give information on wind speed at cloud top (~70 km altitude) [5] and within the clouds (~61 km, ~66 km) [6], while ground-based measurements of doppler-shift in CO2 band at 10 μm [4] and in several CO (sub-)millimeter lines [7,8] sound thermospheric and upper mesospheric winds, showing a strong variability.
In the mesosphere, at altitudes where direct observations of wind are not possible, zonal wind fields can be derived from the vertical temperature structure using the thermal wind equation. Previous studies [9,10,11,12] showed that on slowly rotating planets, like Venus and Titan, the strong zonal winds at cloud top can be successfully described by an approximation of the Navier–Stokes equation, the cyclostrophic balance in which equatorward component of centrifugal force is balanced by meridional pressure gradient. Figure 2 shows an example of zonal wind derived from VIRTIS temperature retrievals combining all cubes in orbit #151.
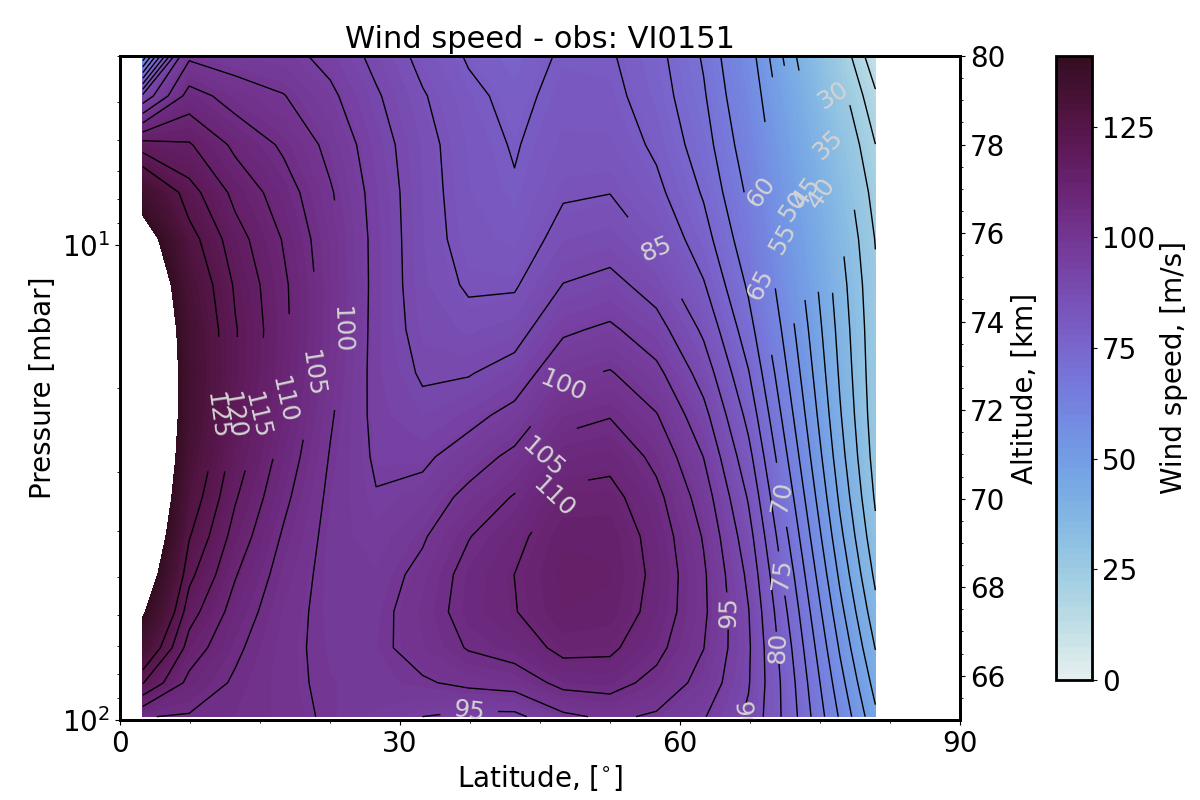
Figure 2: Example of a zonal wind cross-section for orbit #151.
Figure 3 compares 23 zonal wind profiles (thick colored lines) to cloud-tracking measurements (background image, from Goncalves et al., 2020 [5]) at an altitude of 70 km. The wind profiles present a high day-to-day variability, in good comparison with previous observations. As a next step, we plan to analyze more in detail both the day-to-day and the local time variability and compare our results to the Venus Planetary Climate Model [13].
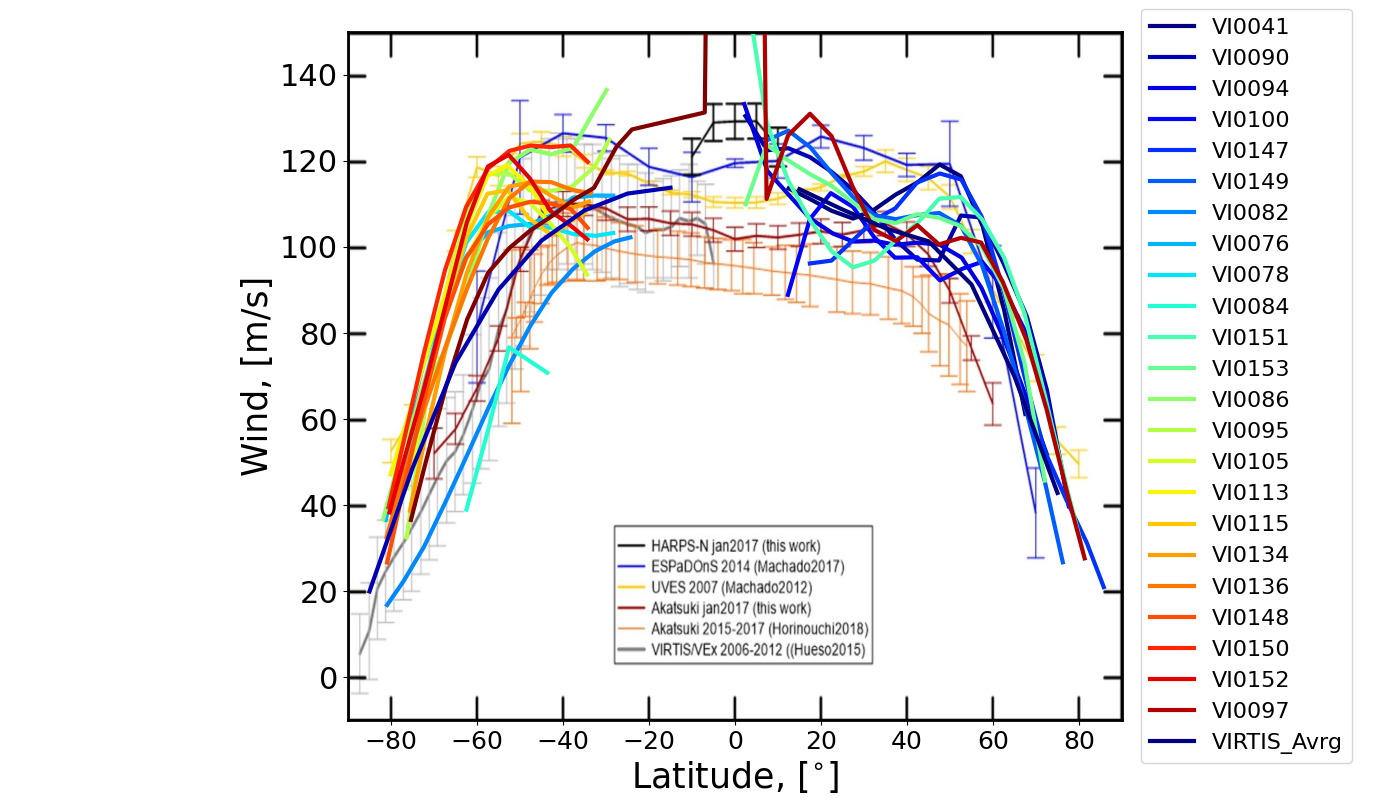
Figure 3: All zonal wind profiles (23 orbits) compared to cloud-tracking observations (from Goncalves R. et al., 2020) at an altitude of 70 km.
References
[1] Drossart, P. et al. (2007) PSS, 55:1653–1672
[2] Grassi D. et al. (2008) JGR., 113, 2, E00B09.
[3] Migliorini, A. et al. (2012) Icarus 217, 640–647.
[4] Sanchez-Lavega, A. et al. (2017) Space Science Reviews, Volume 212, Issue 3-4, pp. 1541-1616.
[5] Goncalves R. et al. Atmosphere, 12:2., 2021. doi: 10.3390/atmos12010002.
[6] Hueso, R. et al. (2012) Icarus, Volume 217, Issue 2, p. 585-598.
[7] Sornig, M. et al. (2013) Icarus 225, 828–839.
[8] Rengel, M. et al. (2008) PSS, 56, 10, 1368-1384.
[9] Piccialli, A. et al. A&A, 606, A53 (2017) DOI: 10.1051/0004-6361/201730923
[10] Newman, M. et al. (1984) J. Atmos. Sci., 41, 1901-1913.
[11] Piccialli A. et al. (2008) JGR, 113,2, E00B11.
[12] Piccialli A. et al. (2012) Icarus, 217, 669–681
[13] Martinez et al. (2023) Icarus, 389, 115272, doi:10.1016/j.icarus.2022.115272
How to cite: Piccialli, A., Grassi, D., Migliorini, A., Lebonnois, S., Politi, R., Piccioni, G., and Drossart, P.: Analyzing the variability of zonal winds in Venus mesosphere using VIRTIS/VEx temperature maps, Europlanet Science Congress 2024, Berlin, Germany, 8–13 Sep 2024, EPSC2024-94, https://doi.org/10.5194/epsc2024-94, 2024.