Atmospheric water abundance of the ice giants - a H2/H2O phase separation approach
- 1DLR, Planetary Research, Berlin, Germany (marina.canoamoros@dlr.de)
- 2University of California (UCSC), Santa Cruz, USA (nadine.nettelmann@gmx.de)
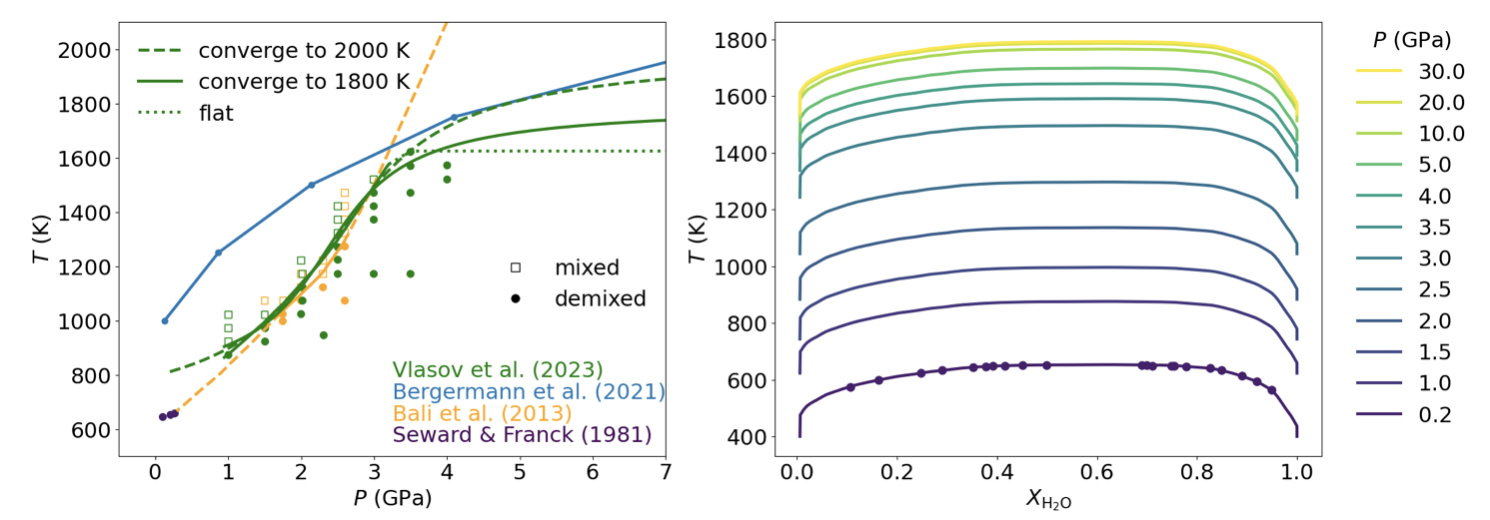
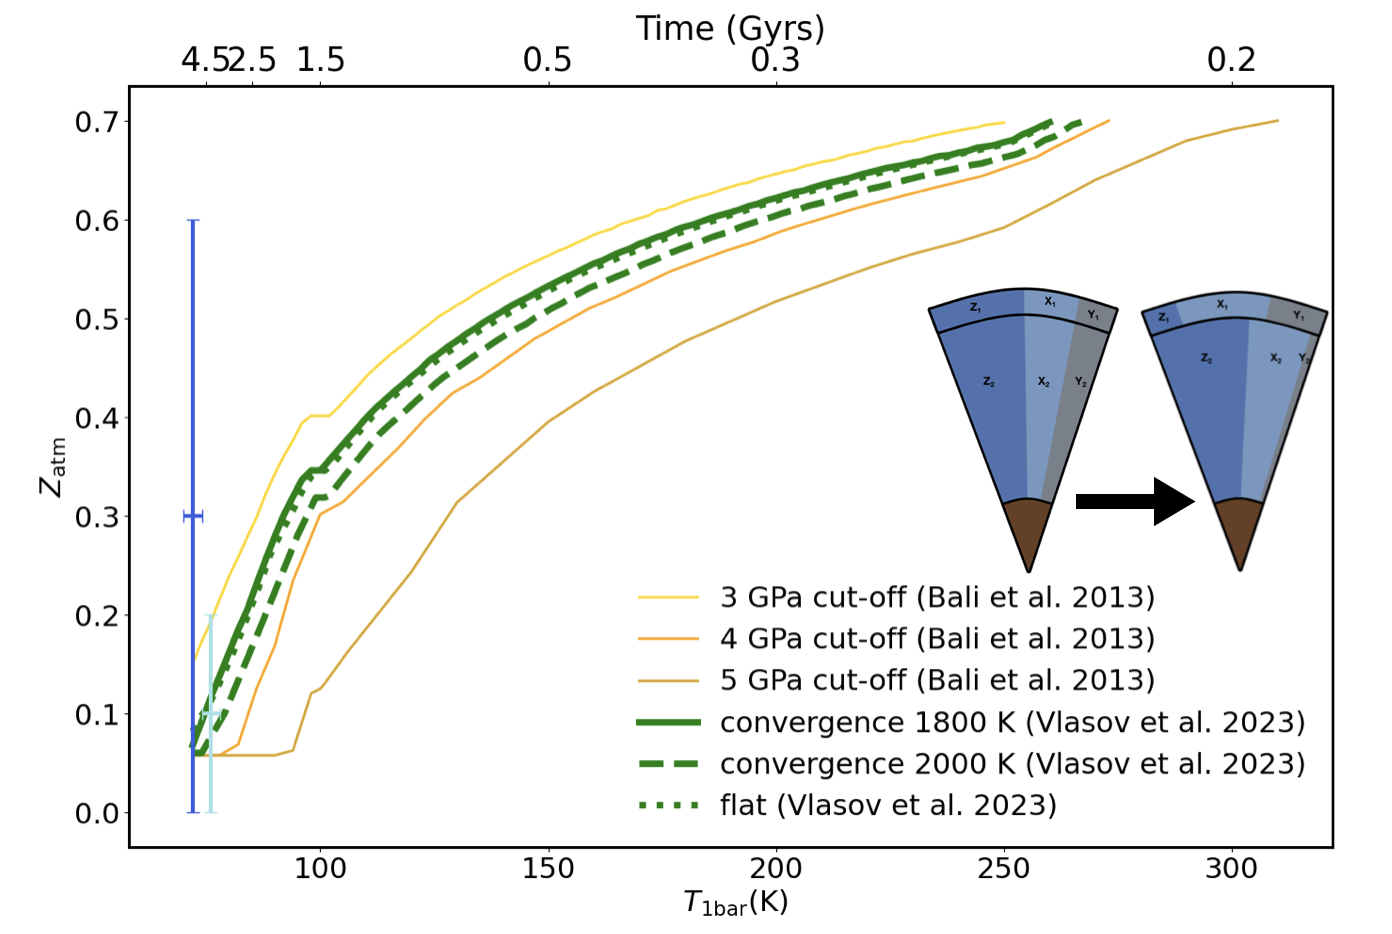
Linking the interior and atmospheric abundances of giant planets is a crucial step in understanding their formation, interior structure, and evolution [1]. In the case of Uranus and Neptune, there are still major uncertainties regarding their bulk composition and distribution of elements. In this work, we present predictions of the atmospheric water abundance of the ice giants, which can reveal important insights into their internal structures. Interior models constrained by the observed gravitational harmonics J2 and J4 indicate that the interiors are composed of a H/He-rich envelope atop an ice/rock-rich interior [2]. To explain such a structure, the phase separation of the two major constituents, water and molecular hydrogen, has been proposed as a possible explanation for this structure [3]. In this scenario, the demixing of hydrogen and water would lead to rain-out of water, leaving the atmosphere depleted of water over time. Here, we employ H2-H2O phase diagrams constrained by experimental data up to 4 GPa [4,5,6] (Figure 1) to predict the atmospheric water abundance over the planets’ evolution (Figure 2). We simulate the process of demixing by applying mass conservation and show that phase separation can occur over a wide range of assumed initial bulk water abundances and may have started already billions of years ago, with higher initial water abundances leading to colder interiors and earlier onsets of demixing. We find that water rain-out can substantially reduce the atmospheric water abundance down to levels between 0.05-0.15wt% whilst the deep water abundance remains essentially primordial.
We also compare the gravity field of our ice giant models to the observed J2 and J4 values [7], noting that the latter also include a contribution from the winds. We compute J2, and J4 both for the models constrained by the H2-H2O phase diagrams and for unconstrained models where the Z-poor/Z-rich transition is variable. We find a preference for models with a water-poor/water-rich transition at 5-15 GPa. For the constrained model, this could imply that the water-poor/water-rich transition could be gradual, or that further transitions perhaps in the C-H system play a role, or that J4 is substantially reduced by zonal winds.
This work connects volatile abundances to gravity field and interior structure of the ice giants, and in light of the exciting Uranus Flagship mission, we stress the importance of obtaining gravity field data as well as in-situ abundance measurements from an atmospheric probe coupled with remote sensing. Such measurements could provide important constraints for the deep water abundance.

Figure 1: (Left): Experimental and computational data points for H2-H2O miscibility from [4] (purple), [5] (yellow), [6] (green) and [8] (blue). Filled symbols correspond to the coexistence of two phases and empty squares to complete mixing of H2 and H2O. The lines indicate different fits to the data points. A linear extrapolation of the data by [5] to 4 and 5 GPa is shown by the dashed yellow line. Three different extensions above 3.5 GPa for the [6] data (flat, convergence to 1800 K and 2000 K) are shown by green dotted, solid and dashed lines, respectively. (Right): Phase diagram based on the shape of the 0.2 GPa curve from [4] (original data: purple dots). Higher isobars are obtained by shifting the 0.2 GPa curve to match the respective 1:1 critical curves in T-P space.

Figure 2: Predicted atmospheric water abundance as a function of the atmospheric temperature at 1 bar for the different phase diagrams used. The older the planet, the colder the adiabat as specified by T1bar, and the more water rains down, depleting the atmosphere. In our simulation, the planet starts completely mixed with homogeneous envelopes and ends with a water-depleted top envelope. For comparison, the atmospheric water abundances determined from structure models are included together with standard Neptune evolution curves from [2] on the top x-axis.
[1] National Academies of Sciences, Origins, Worlds, and Life: A Decadal Strategy for Planetary Science and Astrobiology 2023-2032. (2023), The National Academies Press
[2] Nettelmann N., Helled R., Fortney J., Redmer R., (2013), Planet. Space Sci., 77, 143
[3] Bailey E., Stevenson D. J., (2021), Planet. Sci. J., 2, 64
[4] Seward T., Franck E., (1981), Berichte der Bunsengesellschaft für physikalische Chemie, 85, 2
[5] Bali E., Audétat A., Keppler H., (2013), Nature, 495, 220
[6] Vlasov K., Audétat A., Keppler H., (2023), Contrib. Mineral. Petrol., 178, 36
[7] Helled R., Fortney J.J., (2020), Philos. Trans. R. Soc. Lond. Ser. A, 378, 20190474
[8] Bergermann A., French M., & Redmer R. (2021), Phys. Chem. Chem. Phys., 23, 12637, 23, 12637
How to cite: Cano Amoros, M., Tosi, N., and Nettelmann, N.: Atmospheric water abundance of the ice giants - a H2/H2O phase separation approach, Europlanet Science Congress 2024, Berlin, Germany, 8–13 Sep 2024, EPSC2024-944, https://doi.org/10.5194/epsc2024-944, 2024.