
 1,2,4,
- 1Planetary Science Institute, Tucson, Arizona, United States of America (chowett@psi.edu)
- 2University of Oxford, Clarendon Laboratory, Oxford, OX1 3PU, UK
- 3Universtiy of California, Santa Cruz, Santa Cruz, CA 95064, USA
- 4Southwest Research Institute, 1050 Walnut Street, Suite 300, Boulder, CO 80302, USA,
Introduction: Enceladus’ activity is concentrated across its south polar terrain (SPT). The activity is concentrated along four fractures dubbed tiger stripes. Constraining the magnitude of the endogenic emission from this region has proved challenging, with estimates varying from 4.2 GW to 5.8 ± 1.9 GW and 15.8 ± 3.1 GW [1-3].
The reason for the discrepancy is due to how different studies disentangled the total (passive and endogenic) emission observed to isolate the endogenic component. In the 15.8 GW study estimated the magnitude of the passive emission through modelling and then subtracted from the total. The other studies instead assumed the low-temperature passive component was negligible by only considering only high-temperature (>80 K) endogenic emission across the SPT (5.8 GW), or just the tiger-stripes (4.2 GW).
So the different studies could not be contradicting each other. It’s feasible that the total endogenic emission is ~15.8 GW, but the tiger-stripe only emission is ~4.2 GW with the remaining ~11 GW coming from elsewhere. The most logical place for this extra emission is the region between the stripes, called interstitial (or funiscular) terrain. Thus, it is emission from this is the area that we focus upon in this work.
Data: Cassini Composite Infrared Spectrometer (CIRS) was highly sensitive to the peak power of their blackbody emission. CIRS was a Fourier transform spectrometer with three focal planes covering 10 to 1400 cm-1 (7.1 to 1000 μm) [4]. Focal plane 1 (FP1) covered 10 to 600 cm-1 (16.7 to 1000 μm) with a spatial reolution of 3.9 mrad, enabling it to be sensitive to thermal radiation above 40 K. This made FP1 particularly sensitive to the typical solar heated surface temperatures of the icy satellites and thus the focus of this work . The specific CIRS FP1 data to be analysed is given in Table 1. An example of the CIRS coverage for a single scan is shown in Figure 2.
|
Cassini Orbit # |
Date |
# CIRS Observations |
Spatial Resolution (km/pix) |
|
61 |
03/12/2008 |
110 |
50-80 |
|
80 |
08/11/2008 |
59 |
3-23 |
|
90 |
10/31/2008 |
86 |
4-36 |
|
136 |
08/13/2010 |
219 |
11-29 |
|
228 |
12/19/2015 |
330 |
21-30 |
Table 1 – Details of the CIRS FP1 observations to be analysed. All encounters have a single FP1 scan except for Orbit 136 (6 scans) and Orbit 228 (4 scans).
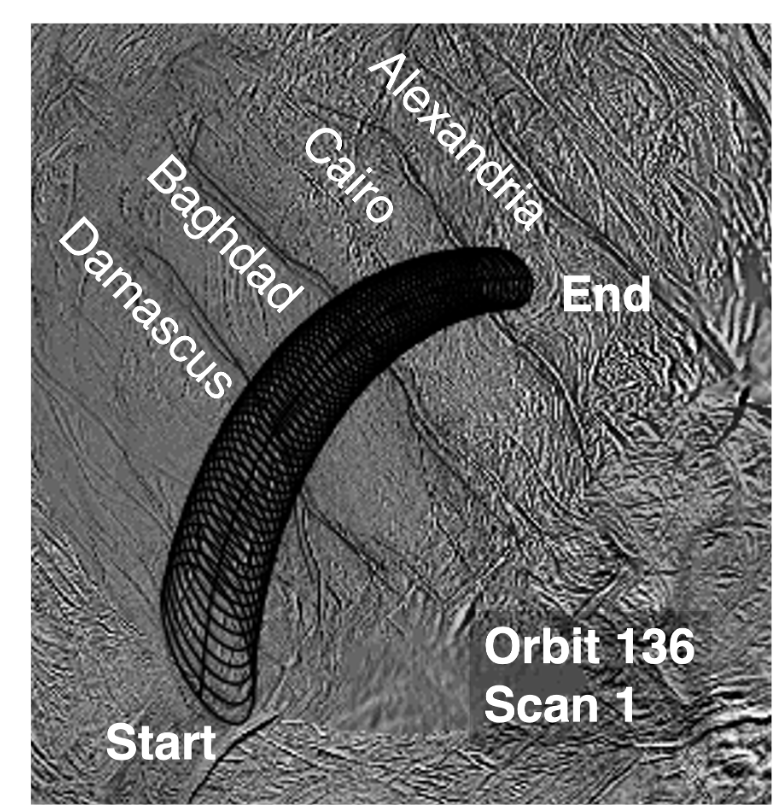
Figure 1 – Footprints (shown by black elipses) of CIRS FP1 over Enceladus’ tiger stripe fractures taken during Orbit 136, first scan. The names of the tiger stripes are given. The solid line indicates the location of the center of the FP1 field of view, where the detector is most sensitive.
Method: Seasonal thermophysical models [5] are run over a range of expected thermophysical properties. The model accounts for Saturnshine and eclipses. The surface temperatures predicted by these models is then determined for each observation. Accounting for the Gaussian response of FP1 the surface temperatures are translated into a predicted radiance for each CIRS footprint and each set of thermophysical properties. These are then compared to the CIRS observed radiances to determine how well they agree.
Models that can fit the CIRS data close to, but not inside the SPT, imply they have thermophysical parameters consistent with those observed close to Enceladus’ SPT and thus provides a reasonable estimate of their value.
For these “good fit” models the difference between the observed and predicted radiances inside of the active regions can then be determined, to provide a constraint on the endogenic emission observed there.
Results: The analysis is ongoing, but here we present new results of a single scan taken during Orbit 136. The ground coverage of this scan was already shown in Figure 1. Model temperatures were obtained for albedos ranging from 0.7 to 0.9 in 0.25 increments, and between 5 and 100 MKS in 5 MKS increments below 50 MKS and 10 MKS increments above it. A subset of the model results are compared to the CIRS-derived temperatures in Figure 2.
The results show that the location of the tiger stripes is obvious in the FP1 data. The location of each stripe (indicated by vertical dotted line) coincides with a distinct increase in surface temperature ~10 K above the background. Between the fractures the temperature decreases to close to non-SPT temperatures. All model parameter sets are able to predict the CIRS observed temperatures at the start of the scan (outside the SPT). So none can be ruled out based on this study alone. However, it is obvious that the discrepancy between the predicted temperatures and those observed across the tiger stripes is highly model dependent.
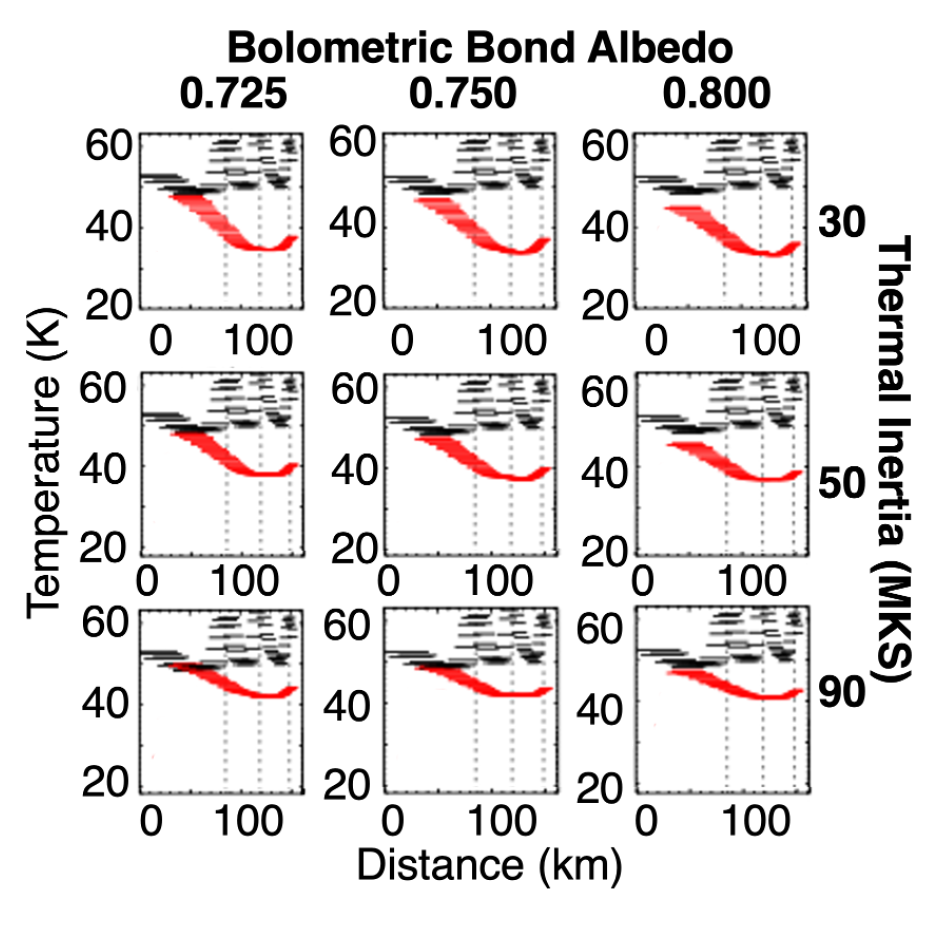
Figure 2 – Model temperatures (red) compared with CIRS-derived surface temperatures (black). The distance given is from the start point (shown in Figure 1) following the FP1 ground track (shown by the solid line cutting through the ellipses in Figure 1). The dotted vertical lines indicate where an observation cuts across a fracture, from left to right these are: Damascus, Baghdad and Cairo. Note there is no model fit to the first six observations as they cover latitudes currently not modelled.
The difference between the model and observed temperatures is endogenic emission, so each model will predict a different endogenic emission. The range in endogenic emissions these models predict for this swath is between 0.02 and 0.45 MW km-2, with a mean value of 0.13 MW km-2. Assuming this mean value, and an SPT area of 13,500 km2 (the area polewards of 60 S) and such emission levels are constant across the active region then this implies the SPT could have a background endogenic emission of ~1.7 GW. We note this estimate is very preliminary and additional analysis will better constrain the thermophysical property regime and the spatial variation of the emission.
Acknowledgments: This work is funded through NASA CDAP 80NSSC19K0885.
References: [1] Spencer, J.R. et al., In Enceladus and the Icy Moons of Saturn, University of Arizona, 2018. [2] Spencer, J.R. et al., Science 311, 1401-1405, 2006. [3] Howett, C.J.A. et al., Journal of Geophysical Research 116, E03003, 2011. [4] Flasar, F.M.et al., Space Science Reviews 115, 169-297, 2004, [5] Spencer et al., Icarus 78, 337-354, 1989.
How to cite: Howett, C., Nimmo, F., Spencer, J., and Miles, G.: Constraining Enceladus' Endogenic Emission, Europlanet Science Congress 2024, Berlin, Germany, 8–13 Sep 2024, EPSC2024-981, https://doi.org/10.5194/epsc2024-981, 2024.