
 1,2,2,2,4,
- 1Istituto Nazionale di Astrofisica, Napoli, Italy (giacomo.ruggiero@inaf.it)
- 2Università degli Studi di Napoli ‘‘Parthenope”, Napoli, Italy
- 3IAPS, Istituto Nazionale di Astrofisica, Rome, Italy
- 4Italian Space Agency, Rome, Italy
Introduction
The purpose of the ESA space mission Comet Interceptor, to be launched in 2029, is to study a Dynamically New Comet (DNC), building upon the significant scientific results of Rosetta, and extend the knowledge of cometary exploration. Exploring DNCs is a challenging task, because the target of the mission must be discovered in advance, according to the standard mission planning timeline. To reach this goal, the spacecraft, after the launch, will reach the L2 Lagrange point where it will wait until journeying onwards to its chosen target. Comet Interceptor includes a main spacecraft (A) and two sub-spacecraft (B1 and B2). DISC, in particular, is part of the Dust, Field and Plasma suite, which will be boarded on the spacecraft A and B2. During the DNC fly-by, DISC will count the dust particles and measure their momentum.
DISC, designed to count individual dust particles and measure their momentum, consists of a single parallelepiped-shaped aluminium box (121x115,5x46 mm3) containing two electronic boards, housed at the bottom of the mechanical box, and the sensing plate, located at the top of the box and exposed to the dust environment. A dust shield is mounted between the sensing plate and the electronics to protect it from hypervelocity dust particles. To save mass and improve efficiency, the dust shield is made of an aerogel layer installed within a lightweight aluminium frame. During the comet fly‑by, dust particles from the coma will impact the sensing plate. The shockwave generated by the impact propagates through the plate and is detected by the PZTs, which convert the mechanical deformation into an electrical signal. DISC acquires signal from the PZTs continuously, but it starts registering the data only when it reaches the threshold level. When the event is triggered, the signal is acquired for 200 microseconds at 1 MHz sampling rate.
As the target of the mission and the flyby speed are not known in advance, it is necessary to cover a wide range of dust particle momentum. Comet Interceptor flyby speed is estimated to be in the range of 10 – 70 km/s. Currently, it is not possible to perform hyper velocity impact test on ground-based facilities. Therefore, the most effective solution is to operate different strategies for the calibration and the performance analysis.
In this work, the performances of DISC were evaluated simulating the impact with high power pulse laser, in addition to the test performed with real projectiles, useful to cover the range of lower speed. This method is based on the correlation proposed by [Pirri, 1977], which allows to correlate the impact pressure of the laser pulse on a surface, to the main operating parameters of the laser: beam radius, pulse time and intensity. The tests were performed on a representative DISC unit realized for this purpose. The results will be scaled on the PFM using the internal calibrator, that will allow the comparison of the instrument response function.
Experimental set-up
To perform the simulation of hyper velocity dust impact with pulsed laser, the development of a specific laboratory set-up was required. These test aim at verify DISC expected performance and further verify the consistency between laboratory test and numerical simulations.
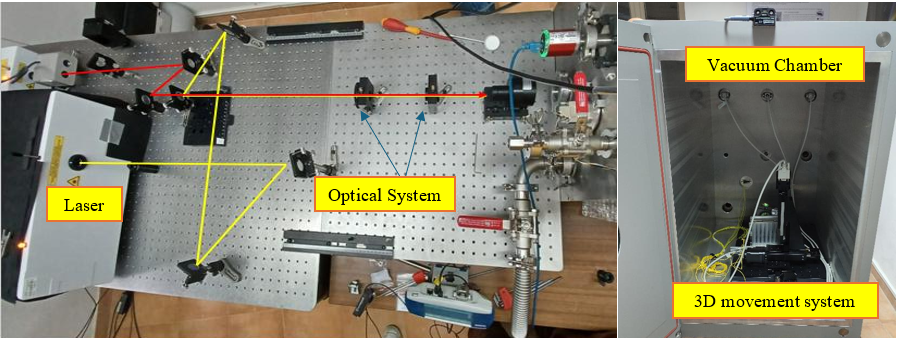
The experimental setup includes two different Nd:YAG pulsed laser, PL2250 and NL300, a vacuum chamber, a beam expander, a converging lens and a 3D automated movement system. Both lasers have a wavelength of 1064 nm. PL2250 has a pulse time of 80 ps and energy up to 0.1 mJ; Laser NL300 has a pulse time of 6 ns and energy up to 1.2 J.
DISC is mounted on the automated movement system and positioned inside the chamber, operating at the pressure of 10-6 bar.
The lasers are positioned on an optical bench and the pulses are directed through two different optical paths, into a beam expander which increases the pulse width by a factor of 2.5. The pulse, through a window on the vacuum chamber, is directed into a converging lens that focuses it onto the sensitive surface of DISC. The lens has a focal length of 75 mm. The MGSE is showed in the Fig1.
Sensing plate characterization
The signal detected by the PZTs depends not only on the impact pressure, but also on the impact location, and therefore the path of the shockwave to reach the PZTs and the interferences with the edges of the sensing plate.
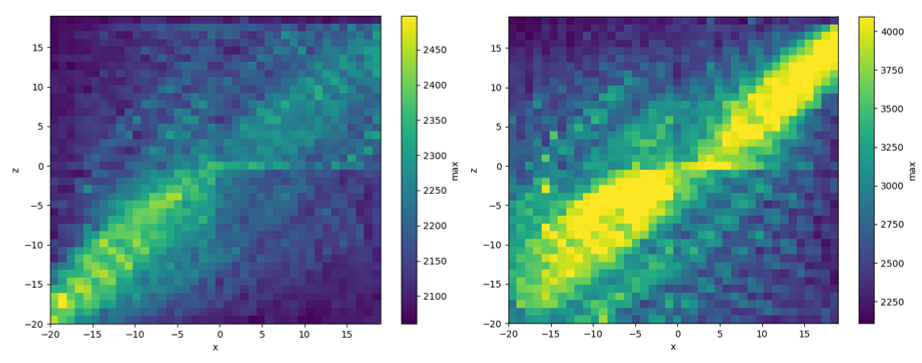
Therefore, a series of test was carried out to map the sensibility of DISC. A customized algorithm was developed to automate the test and control the coordinates of every laser shot. The tests were repeated at different levels of energy and varying the attenuation parameter. The parameters were tuned to obtain in every test signal in the range between the minimum sensibility and the saturation value. A step of 2 mm was set for the scanning. In this case, the laser power was kept at the minimum possible, to minimize the damaging of the sensing plate, between 5 and 15 mJ, according to the attenuation level.
The results obtained are shown in figure 2. The heatmaps represent two different PZTs, with different amplification gains; in this way it is possible to observe a wider range of impact momentum.
Power tests
Once the sensibility map was acquired, a number of points was selected, to perform further test and characterize the response of DISC at different levels of energy. In this case, the movement system was used to set the coordinates of the point to hit. It was observed a very good sensitivity, detecting energies close to 1 mJ, which is the minimum energy of the laser.
Data show, as reported in figure 3, in the area before the saturation, an almost linear correlation between the peak of the signal (reported in digital numbers) and the energy of the impulse.

Acknowledgement: This work has been funded by the ASI-INAF agreement N. 2023-14-HH.0
How to cite: Ruggiero, G., Della Corte, V., Cozzolino, F., Rotundi, A., Bertini, I., Inno, L., Tonietti, L., Longobardo, A., Grappasonni, C., Sindoni, G., and Ammannito, E.: DISC: Analysis of the performance and calibration strategy., Europlanet Science Congress 2026, The Hague, The Netherlands, 7–11 Sep 2026, EPSC2026-1010, https://doi.org/10.5194/epsc2026-1010, 2026.


