
 1,3
1,3- 1Department of Earth & Planetary Sciences, Weizmann Institute of Science, Rehovot, Israel
- 2Laboratory for Atmospheric & Space Physics and Astrophysical & Planetary Sciences Department, University of Colorado Boulder, Boulder, CO, USA
- 3Planetary Science Institute, Tucson, Arizona, USA
Introduction
The seasonal CO2 cycle on Mars is a key driver of the martian climate system. The cycle affects global energy balance and produces annual pressure variations of ~25% [1] that drive interhemispheric and local airflow [2]. In the southern hemisphere, the seasonal CO2 deposits are particularly enigmatic: ice properties change significantly between different regions; bright and fine-grained ice contrasts with areas of ice that remain dark and cold throughout the sublimation period [3].
Existing studies on the southern seasonal CO2 cycle typically analyzed a few Mars years of data. Here, we analyze nearly two decades of continuous data acquired by the Mars Climate Sounder (MCS) [4], a visible and infrared radiometer onboard the Mars Reconnaissance Orbiter (MRO). While the instrument typically acquires limb observations for atmospheric characterization, high-emission-angle surface observations are regularly obtained. From these, we produce Lambert surface albedo values and explore the regional and temporal variations of ice reflectivity from a multi-annual average and an interannual perspective.
Methods
We use spectral radiance data, computed from band-integrated radiance obtained by the MCS A6 channel (spanning 0.3 - 3 μm), to derive the albedo of the surface CO2 deposits. We retain observations that are associated with surface temperatures below 160 K (brightness temperature at ~32 μm), which include normal frosted regions as well as the Cryptic region [5]. Since the instrument observes the surface at high phase angles (typically between 105° and 145°), radiance is typically elevated, producing non-physical Lambert albedo values. To correct for this, we divide the top-of-atmosphere (TOA) Lambert albedo into 3-degree bins of solar incidence; within each bin, we fit a scaled Henyey-Greenstein phase function. We produce an effective scene (surface + atmosphere) asymmetry parameter (g) versus incidence trend, which we apply to the raw TOA albedo to produce phase-corrected albedo. Next, we apply a delta-Eddington atmospheric correction [6] using MCS-derived aerosol column optical depth to obtain the Lambert surface albedo. We limit our analysis to incidence angles lower than 80°, above which albedo increases rapidly due to instrument noise.
Results
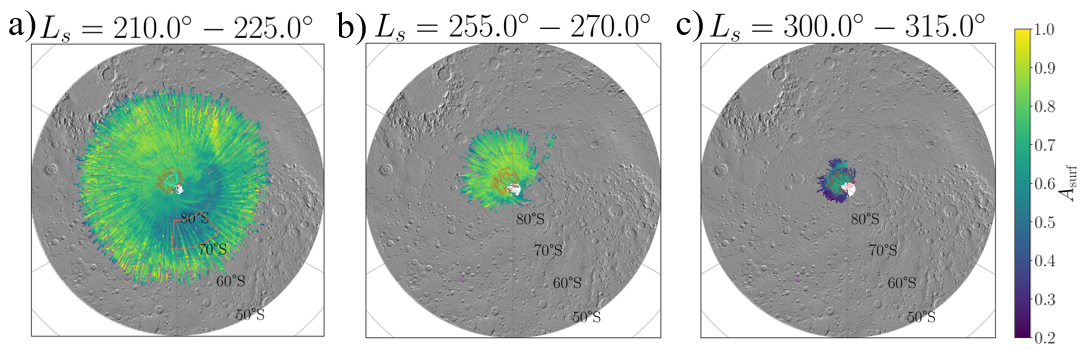
Fig. 1 shows initial mapping results for the southern cap in polar stereographic projection. Prominent features of the southern cap are observed. Due to incidence angle constraints, we can observe the cap only in spring and summer. In mid-spring (Fig. 1a), we observe the cap in sublimation. High-albedo ice is seen in the Mountains of Mitchel (72° S, 330° E), while the Cryptic region (75° S - 85° S, 50° E - 210° E) is notably darker, as expected. Late spring cap (Fig. 1b) is notably asymmetric, with the Cryptic region completely defrosted. Ice remains in the western hemisphere, as well as the outliers at the Mountains of Mitchel. At mid-summer (Fig. 1c), after the sublimation of seasonal frost, the residual cap has a relatively lower albedo.
Fig. 2 presents the multi-annual average CO2 albedo averaged over regions of interest (ROIs). The residual cap (Fig. 2a) is observable starting at Ls ~200°. The cap’s albedo initially fluctuates, and as seasonal ice sublimates to reveal residual ice, the albedo sharply drops to ~0.65. Byrne et al. [7] similarly found darkening during the seasonal frost sublimation. In the Cryptic region (Fig. 2b), ice albedo is initially similar to other regions, and subsequently decreases, showing the “cryptic” behavior presumably caused by slab transparency and/or surface dust accumulation [3]. Around Ls ~210°, a brightening phase is associated with temperatures increasing above the CO2 frost point, before the ice sublimates.
In both regions, interannual variations are observed. Most prominently, the residual cap appears to have significant interannual albedo variations after Ls ~310°. We also highlight that ice albedo differs somewhat from other literature values (e.g., TES average albedo in the Cryptic region reaches values as low as ~0.2 in early spring, where our value is ~0.5). This may be due to errors in the atmospheric correction or non-Lambertian behavior of the ice.
Conclusions
The long observational baseline of MCS offers a unique opportunity to explore previously documented phenomena over multi-annual timescales and identify interannual variations over nearly a full martian decade. In addition, simultaneous MCS atmospheric and surface IR observations can be used to investigate relationships between visible ice albedo, atmospheric conditions, and ice metamorphic state. We are currently exploring several intriguing findings that could shed light on the seasonal evolution of southern CO2 ice.
References
[1] James, P. B., Kieffer, H. H., & Paige, D. A. (1992). 934-968. [2] Siili, T., Haberle, R. M., & Murphy, J. R. (1997). Advances in Space Research, 19(8), 1241-1244. [3] Kieffer, H. H., Christensen, P. R., & Titus, T. N. (2006). Nature, 442(7104), 793-796. [4] McCleese, D. J., Schofield, J. T., Taylor, F. W., Calcutt, S. B., Foote, M. C., Kass, D. M., ... & Zurek, R. W. (2007). Journal of Geophysical Research: Planets, 112(E5). [5] Kieffer, H. H., Titus, T. N., Mullins, K. F., & Christensen, P. R. (2000). Journal of Geophysical Research: Planets, 105(E4), 9653-9699. [6] Wiscombe, W. J., & Warren, S. G. (1980). Journal of Atmospheric Sciences, 37(12), 2712-2733. [7] Byrne, S., Zuber, M. T., & Neumann, G. A. (2008). Planetary and Space Science, 56(2), 194-211.
|
Figure 1: Multi-annual (MY 29-37) average CO2 ice albedo. Data is obtained at ~3 PM local time, binned into 18 x 18 km cells and 15° Ls. Selected time frames include a) seasonal cap recession during mid-spring, b) late spring, and c) residual cap at mid-summer. ROIs shown in Fig. 2 are marked in (a); residual cap in cyan and the Cryptic region in red. |
|
Figure 2: ROI-average CO2 ice albedo for a) the residual cap and b) the Cryptic region. Multi-annual average albedo across MY 29 - 37 with standard error of the ROI mean (SEM). |

How to cite: David, E., Hayne, P., and Aharonson, O.: The Seasonal Evolution of Southern CO2 Ice from MCS Observations, Europlanet Science Congress 2026, The Hague, The Netherlands, 7–11 Sep 2026, EPSC2026-1015, https://doi.org/10.5194/epsc2026-1015, 2026.


