
 1,2,1,2,4,3,1,5,6,7,8,9
- 1Institute of Astrophysics and Space Sciences, Lisbon, Portugal
- 2Faculdade de Ciências da Universidade de Lisboa, Lisbon, Portugal
- 3Instituto De Astrofísica De Andalucía, Granada, Spain
- 4European Space Agency, European Space Astronomy Center, Madrid, Spain
- 5Center for Space and Habitability, University of Bern, Switzerland
- 6German Aerospace Center, Institute for Space Science, Berlin, Germany
- 7Institut Astrophysique Spatiale, CNRS, Paris-Saclay University, France
- 8Aix Marseille Univ, CNRS, CNES, LAM, Marseille, France
- 9European Space Agency, ESTEC, Noordwijk, Netherlands
Atmospheric gravity waves (AGWs) are dynamically relevant in the Martian atmosphere [1], but orbital observations still provide an incomplete view of their morphology, altitude, and propagation conditions. Individual orbital images of clouds can identify wave packets and measure horizontal wavelengths, yet altitude, background wind, intrinsic phase speed, and vertical wavelength are only available when the observing geometry allows additional retrievals. This limits how far morphology alone can be interpreted dynamically. We compare three orbital datasets, that include clouds, each with different spatial resolution, coverage, and observing modes/geometry. They are not treated as a single climatology, because they cover different observing periods and have different sampling biases. Instead, we use them to test what part of the Martian AGW population each instrument can detect and characterize.
OMEGA/Mars Express nadir observations [2] during MY26–29 provide the widest occurrence baseline (Figure 1- a), although with a limited total number of observations. In this dataset, 263 wave packets were detected and 125 were characterized, with horizontal wavelengths from 6 to 83 km and a mean of 21 km [3]. Detections are concentrated in the northern hemisphere, especially at mid-to-high latitudes, with seasonal peaks during northern spring and autumn and southern winter. Their spatial distribution is consistent with topographic forcing near Tharsis–Alba and with convective activity over the northern plains. HRSC/Mars Express stereo-temporal imaging [4] during MY34–37 adds altitude and motion information (Figure 1- b). Wave packets identified in the HRSC Cloud Atlas [5] were characterized using blue-green inter-channel parallax to retrieve cloud-top altitude and approximately 30-minute repeat-track pairs to estimate horizontal motion. Retrieved altitudes are mostly 15–40 km, with uncertainties of about 3–10 km and a smaller number of cases extending to 60–100 km. For 11 packets with altitude, wind, and wave-geometry constraints, the analysis gives intrinsic phase speeds of 0.4–6.2 m/s and implied vertical wavelengths of 0.2–3.4 km under linear gravity wave assumptions [6]. Comparison with MCD static stability and background winds [7,8] indicates that some packets lie close to critical or turning levels, which may affect whether they remain visible at cloud level.
CaSSIS/ExoMars TGO imaging at 4 m/pixel [9] provides a substantially larger image dataset than HRSC, by roughly an order of magnitude, and samples smaller structures (Figure 1- c, Eira et al, in prep[10]). This part of the analysis remains preliminary, but it reaches sub-kilometer and few-kilometer horizontal wavelengths, below the OMEGA and HRSC detection ranges. A first comparison of spatiotemporal distribution, morphology, spatial scale, and observing geometry is used to assess instrument-dependent detection biases [10]. Whether the CaSSIS detections form the short-wavelength end of the OMEGA–HRSC population, or represent a separate subset controlled by different sources or visibility conditions, remains open.
Taken together, the datasets connect measurements that are usually obtained separately: morphology from cloud images, altitude from stereo geometry, and propagation constraints from repeat imaging and background winds. The comparison separates morphology-only detections from cases where altitude and wind information allow dynamical interpretation. These are the quantities needed to test how gravity wave drag is represented in Mars general circulation models.
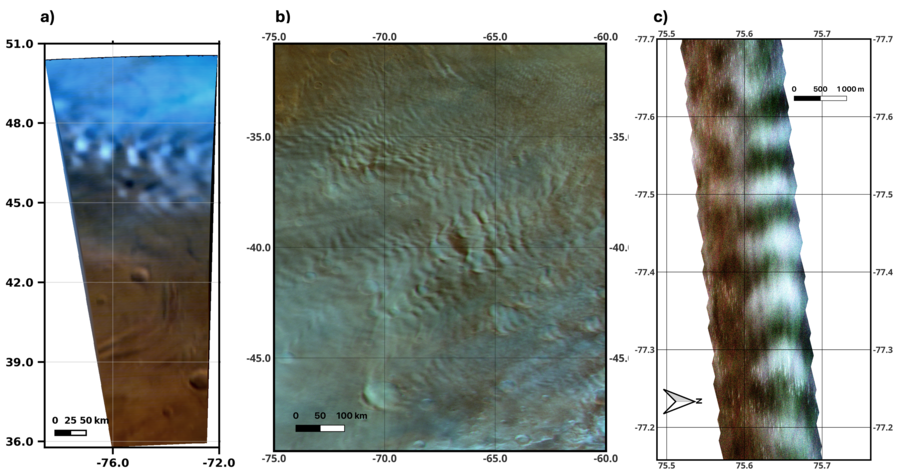
Figure 1. Examples of Martian atmospheric gravity wave packets observed with (a) OMEGA/Mars Express, (b) HRSC/Mars Express, and (c) CaSSIS/ExoMars TGO, illustrating the different spatial scales and observing geometries used in the multi-instrument comparison.
Acknowledgments: This work was supported by the Portuguese Fundação para a Ciência e a Tecnologia through the research grant UID/04434/2025, and through the grants of reference 2021.05455.BD, and 2020.06389.BD. GG acknowledges financial support from Junta de Andalucía through the program EMERGIA 2021 (EMC21_00249) and from the Severo Ochoa grant CEX2021-001131-S funded by MCIN/AEI/10.13039/501100011033. IAA is also supported by grant ID2022-137579NB-I00 funded by MCIN/AEI/10.13039/501100011033 and by "ERDF A way of making Europe", funded by the ESA Faculty Research Contract and Science Exchange Programme, which is in the frame of the MWWM Mars Wind and Wave Mapping project of reference ESA RFP/3-17570/22/ES/CM. We also thank Lucie Riu, Aurélien Stcherbinine, and the Mars Express and ExoMars TGO Teams for their support and encouragement in this work.
References: [1] Fritts & Alexander, 2003; [2] Bibring et al., 2007; [3] Brasil et al., 2025; [4] Jaumann et al., 2007; [5] Tirsch et al., 2024; [6] Brasil et al. (under review); [7] Forget et al., 1999; [8] Millour et al., 2018; [9] Thomas et al., 2017; [10] Eira et al. (in prep.).
How to cite: Brasil, F., Machado, P., Gilli, G., Eira, H., Cardesin-Moinelo, A., T. Bickel, V., Tirsch, D., Carter, J., Thomas, N., E. Silva, J., Espadinha, D., Martin, P., and Wilson, C.: Martian atmospheric gravity waves across scales: morphology, altitudes, and dynamics from MEx/OMEGA, HRSC, and ExoMars TGO/CaSSIS, Europlanet Science Congress 2026, The Hague, The Netherlands, 7–11 Sep 2026, EPSC2026-106, https://doi.org/10.5194/epsc2026-106, 2026.


