
 ,,
,,- TU Dortmund University, Image Analysis Group, Electrical Engineering and Information Technology, Dortmund, Germany (mirza.arnaut@tu-dortmund.de)
1. Introduction
The remote characterization of atmosphereless celestial bodies relies on understanding scattered sunlight. The Degree of Linear Polarization (DoLP) is a sensitive tool for analyzing the physical properties of granular soils [1]. However, interpreting these polarization curves is complicated by two main factors: the difference between opaque surface scattering (e.g., in rocks) and semi-transparent volume scattering (e.g., in glasses) across various wavelengths [2], and the discrepancy between mechanical sieve sizes and true optical scattering behavior [3]. This study investigates the optical behavior of crushed planetary simulants by combining multi-wavelength laboratory polarimetry with Principal Component Analysis (PCA). The goal is to objectively separate how material composition and grain size influence on shape of polarization phase curves.
2. Laboratory Measurements and Curve Fitting
Laboratory polarimetry was conducted on samples of crystalline basalt and amorphous glass. The samples were mechanically separated into three sieve bins (<32μm,32–63μm,63–125μm). Measurements were taken using standard narrow-band visible filters (U,B,V,R,I) and an unfiltered broadband setting to capture wavelength-dependent scattering changes. The experimental setup used an emission angle of 45°. The azimuth angle was kept close to 0°, making off-plane scattering effects negligible for these measurements.
To extract physical parameters from the data, the DoLP phase curves were fitted to an empirical trigonometric model [4]. Because laboratory instruments can introduce a slight offset, an instrumental bias parameter (𝐸) was added to the equation. This ensures the model accurately captures the amplitude of the curve (𝐴) and the inversion angle (𝛼inv): DoLP(𝛼)=𝐴⋅sin𝐵(𝛼)⋅cos𝐶(𝛼/2)⋅sin(𝛼−𝛼inv)+𝐸
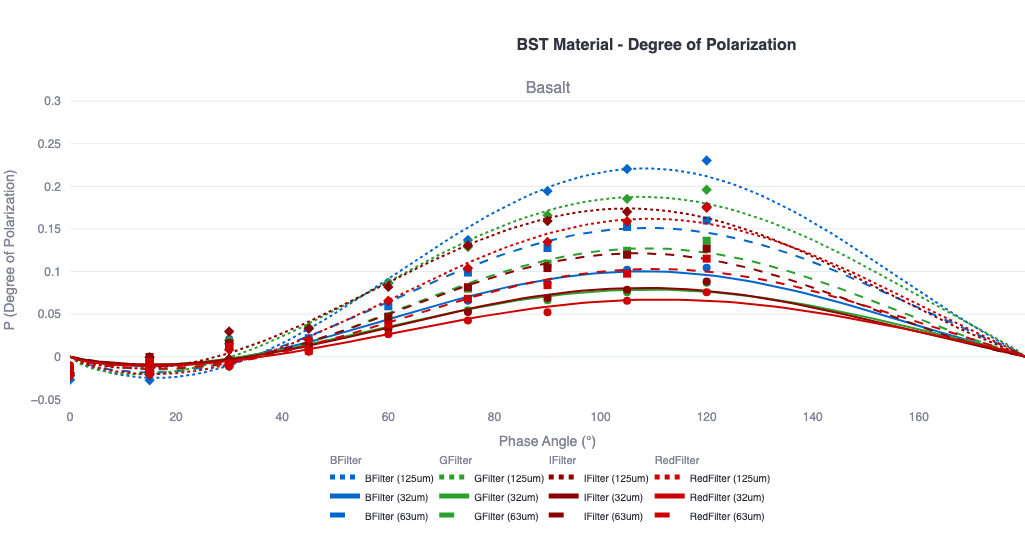
Figure 1: Measured and fitted DoLP phase curves for the Basalt (BST) samples across different filters and grain sizes.
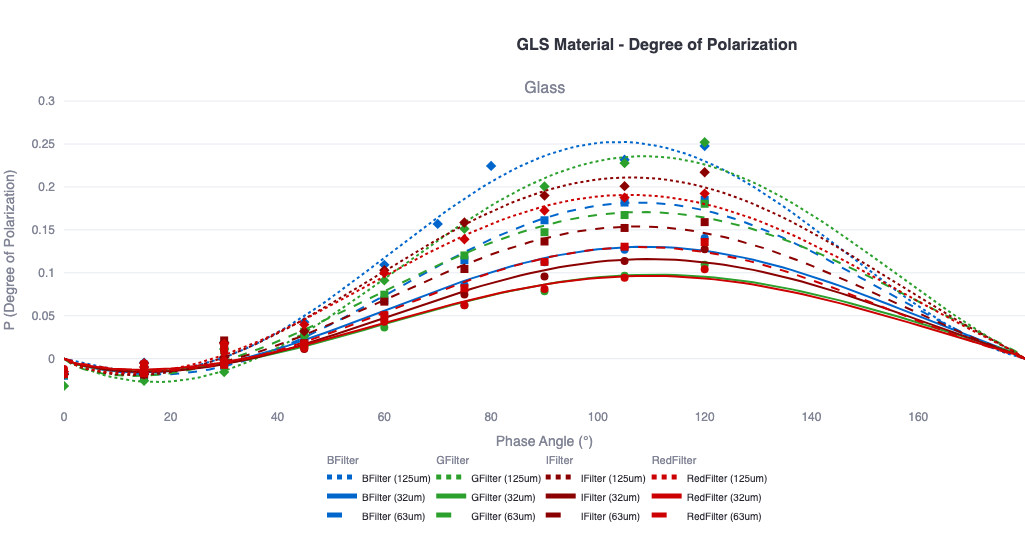
Figure 2: Measured and fitted DoLP phase curves for the Glass (GLS) samples across different filters and grain sizes.
3. Principal Component Analysis
To find natural groupings in the data, the fitted parameters (𝐴, 𝐵, 𝐶, 𝛼inv,𝛼max,Pmax) from each measurement were used as input features for a Principal Component Analysis (PCA). This allows for a clear visualization of how the curves change depending on material type, wavelength, and sieve size, without relying on theoretical scattering assumptions like the Lorenz-Mie theory.
The PCA results show that the first principal component (PC1) contains the most significant variance in the dataset and correlates strongly with grain size (Figure 3). In the PCA space, the largest particles (125μm) group on one side, while the finest particles (32μm) distribute on the opposite side. This clear separation along the primary axis suggests that the size parameter of the particles plays a dominant role [5]. We can explain this physically through the scattering mechanism: larger, darker grains absorb penetrating light, ensuring the escaping light is dominated by highly polarized single-surface reflections. Conversely, finer dust creates a brighter, highly reflective powder bed that promotes multiple scattering events between grains. These multiple bounces effectively scramble and depolarize the light, lowering the overall amplitude of the phase curve [3].

Figure 3: 2D PCA projection of the phase curve parameters, with colors representing the three grain size bins.
Furthermore, the PCA visualizes a clear difference between the two materials (Figure 4). The crystalline basalt samples group relatively closely together across all wavelengths, indicating a stable scattering regime dominated by opaque surface reflection. In contrast, the amorphous glass samples spread much wider across the PCA space. For the glass samples, longer wavelengths (such as the R and I bands)penetrate deeper into the particles. This causes a shift from surface reflection to internal volume scattering, which depolarizes the light and significantly alters the shape of the phase curve [2].

Figure 4: 2D PCA projection of the phase curve parameters, with colors representing the two materials: basalt and glass.
The effect of the wavelength is shown in the filter-specific projection (Figure 5). The data do not cluster neatly by color, which suggests that the wavelength affects the two materials differently. When comparing this plot with the material groupings in Figure 4, it appears that basalt remains relatively stable across all filters because it is consistently opaque. In contrast, the wider spread of data points belongs to the glass samples measured at longer wavelengths (such as the R and I filters), where the light can penetrate the particles and cause internal scattering. This indicates that multi-wavelength measurements are necessary, as longer wavelengths help reveal the internal structure of semi-transparent materials.

Figure 5: 2D PCA projection of the phase curve parameters, with colors representing the different wavelength filters.
4. Conclusions
This analysis demonstrates that the polarization of granular soils is driven by an interplay of grain size, material opacity, and incident wavelength. The PCA visualization successfully separates the effects of opaque surface scattering from depolarizing volume scattering. The strong correlation betweenPC1 and grain size highlights the importance of the particle size parameter in interpreting the overall amplitude of these curves. Crucially, the data shows that wavelength does not affect all materials equally. While opaque rocks (basalt) remain stable across different filters, semi-transparent materials (glass) undergo a wavelength-dependent transition into internal volume scattering. Therefore, multi-wavelength polarimetry is strictly necessary to accurately identify the amorphous vs. crystalline nature of planetary surface materials, as single-wavelength observations cannot distinguish between these fundamentally different scattering behaviors.
Bibliography
[1] C. H. L. Patty et al., “Polarimetry in Planetary Sciences and Astronomy.” https://arxiv.org/abs/2604.08975
[2] L. Kolokolova, J. Hough, and A.-C. Levasseur-Regourd, Polarimetry of Stars and Planetary Systems, Cambridge University Press, 2015, pp. 11–144.
[3] M. Min, J. W. Hovenier, and A. Koter, “Modeling optical properties of cosmic dust grains using a distribution of hollow spheres,” A&A, 2005, 10.1051/0004-6361:20041920.
[4] B. Goidet-Devel, J. Renard, and A. Levasseur-Regourd, “Polarization of asteroids. Synthetic curves and characteristic parameters,” PASS, 1995, 10.1016/0032-0633(94)00140-M.
[5] I. G. Shkuratov and N. Opanasenko, “Polarimetric and photometric properties of the moon: Telescope observation and laboratory simulation 2. The positive polarization,” Icarus, 1992, 10.1016/0019-1035(92)90161-Y.
How to cite: Arnaut, M., Kakade, S., and Wöhler, C.: Disentangling Composition and Grain Size Effects in PlanetaryAnalogs: A Multi-Wavelength Polarimetric Analysis, Europlanet Science Congress 2026, The Hague, The Netherlands, 7–11 Sep 2026, EPSC2026-1062, https://doi.org/10.5194/epsc2026-1062, 2026.


