Multiple terms: term1 term2
red apples
returns results with all terms like:
Fructose levels in red and green apples
Precise match in quotes: "term1 term2"
"red apples"
returns results matching exactly like:
Anthocyanin biosynthesis in red apples
Exclude a term with -: term1 -term2
apples -red
returns results containing apples but not red:
Malic acid in green apples
hits for "" in
Network problems
Server timeout
Invalid search term
Too many requests
Empty search term
MITM4
Forward modelling of synthetic reflectance spectra of icy planetary regolith is a valuable tool to infer physical properties such as grain size and temperature from remote sensing datasets. The Hapke model [1] is a widely used analytical approximation of radiative transfer in granular media. It relies on averaged single-scattering properties, such as the single-scattering albedo and a single-scattering phase function and cannot accurately account for contributions from multiple scattering in the case of strongly forward-scattering particles [2]. Porous icy samples with a wide range of microstructures have been found to be strongly forward scattering [3], which questions the applicability of the Hapke model to such scattering media. Ray tracing simulations that model the scattering of light by arbitrary microstructures in the geometric-optics limit offer a promising alternative. In addition to the provided microstructure, they rely solely on the material's complex refractive index and the wavelength of the light, without further assumptions. However, their application to snow and ice surfaces has been limited so far due to the computational expense [4-6]. The incorporation of dedicated hardware for ray tracing computations on modern consumer GPUs and the development of the efficient ray tracing model PhotonTracer, which makes use of it, enable the simulation of light scattering in a semi-infinite particulate medium, even in the case of negligible absorption [7].
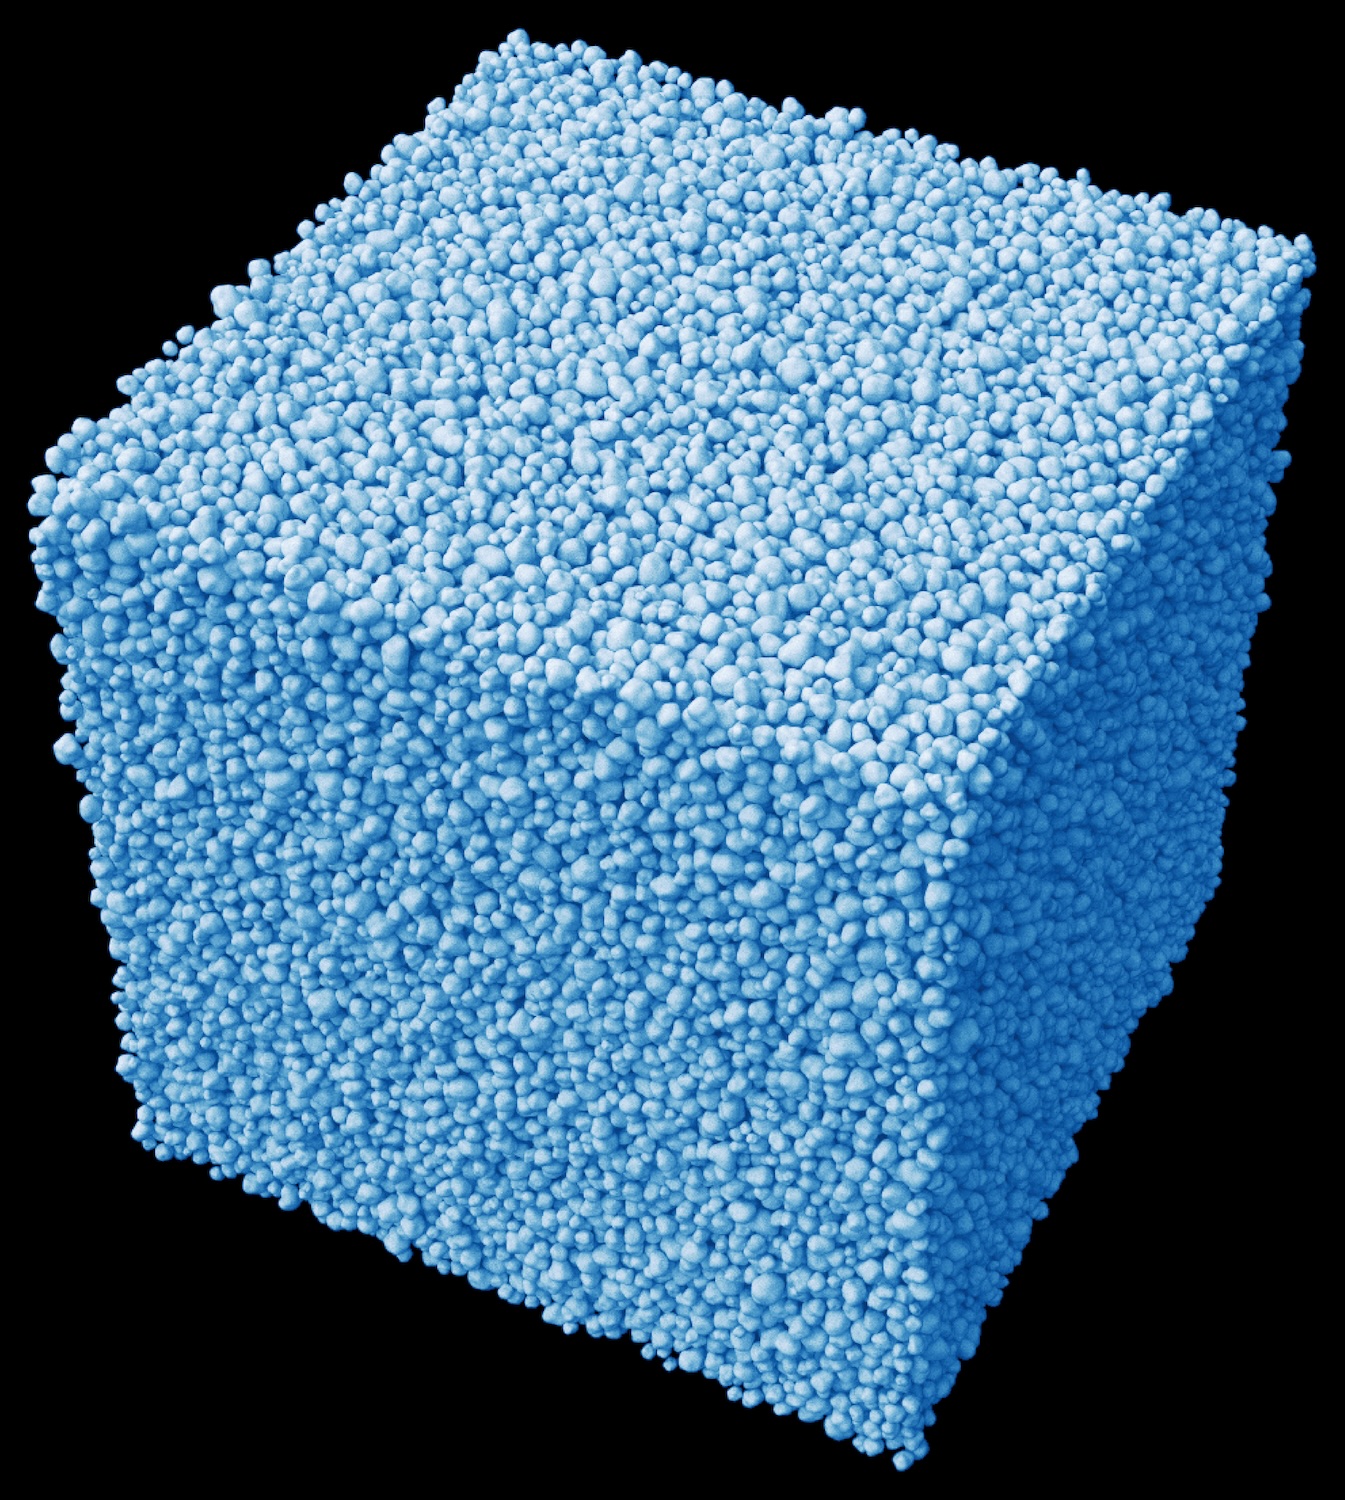
We use PhotonTracer to investigate the effects of grain size, temperature, porosity, and sintering on the reflectance factor, albedo, and absorption depth in granular ice samples. The granular samples are represented as cubes consisting of 100’000 densely packed Gaussian random spheres [8] shown in Figure 1. They are repeated in all 3 dimensions to represent a semi-infinite scattering medium. The complex refractive indices measured at different temperatures [9] were used to simulate the scattering and absorption of the ice particles.

Figure 1: The particulate medium packed by the HPMC simulation to a volume fraction of 50%, consisting of 105 particles. For the particles with an average diameter of 100 µm, the resulting side length of the cube is 4.3 mm.
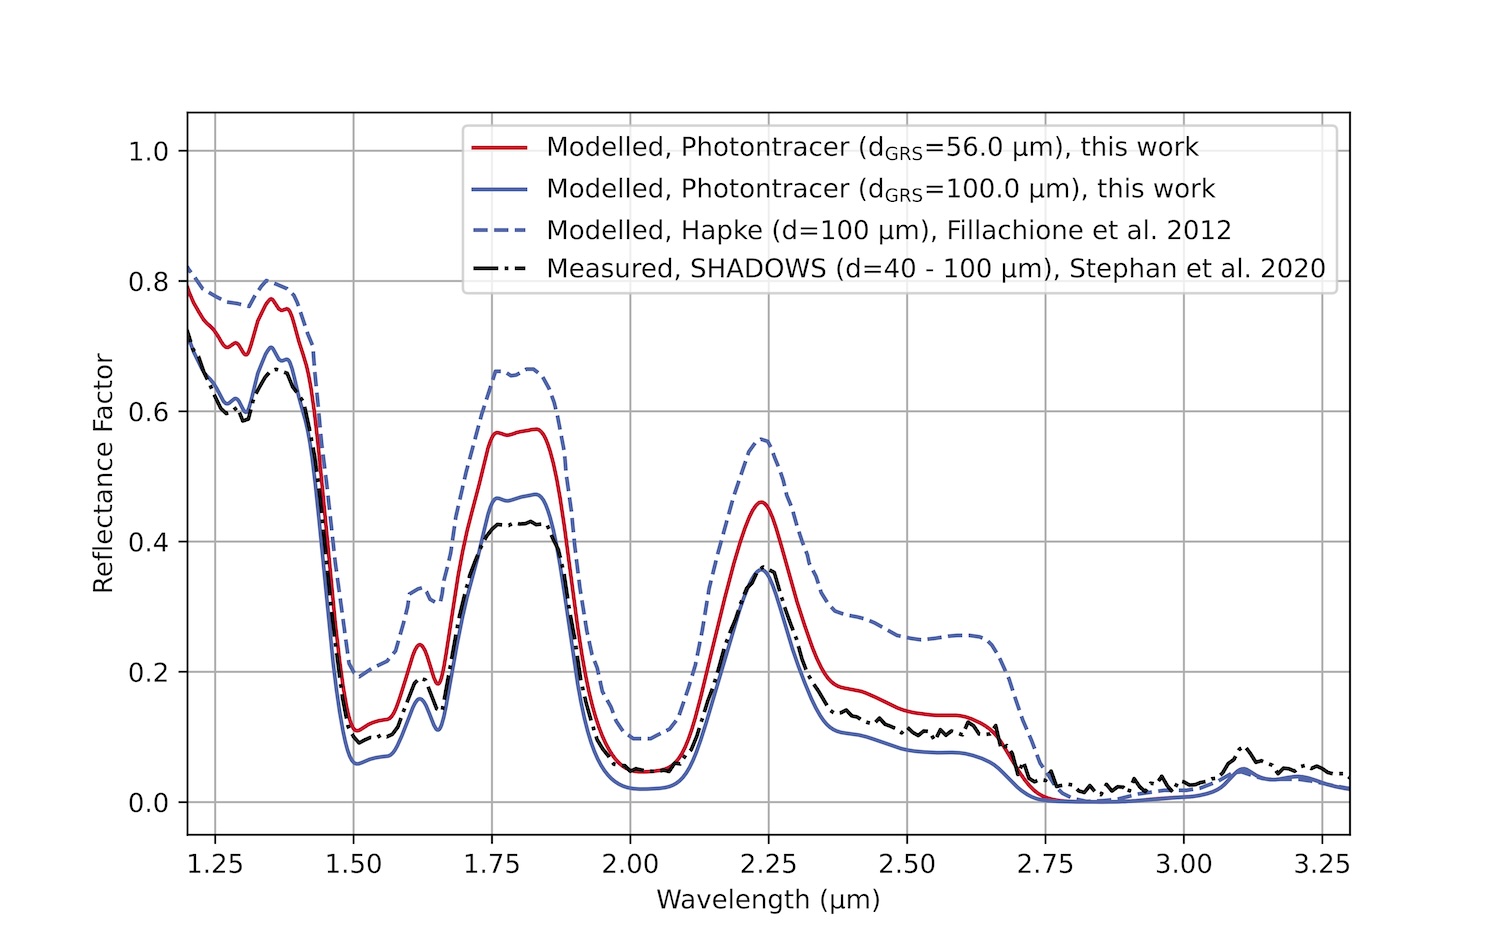
The bolometric albedo is primarily controlled by particle grain size, while porosity has a negligible effect. The absorption depth increases with increasing grain size and porosity. As emission angles increase, opposite trends are observed over the spectral range of 1.2 – 3.5 µm. The reflectance factor decreases with increasing emission angles, except for the 3.1-µm Fresnel reflection peak of crystalline water ice. Figure 2 shows a comparison of the measured REFF of an ice sample analogue (d = 40 - 100 µm) produced with the SPIPA-B protocol [10], with the prediction of PhotonTracer and the Hapke model. The measured data show very good agreement with the ray tracing simulation in regions of stronger absorption. In contrast, the predicted REFF in the interband regions is too high. We note that Mastrapa et al. [9] reported that the measured absorption coefficients in these weakly absorbing regions are subject to large uncertainty due to continuum removal. The Hapke model, as used in [11] predicts reflectance factors that are higher than the measured values. Using this model to constrain grain sizes from remote sensing observations would overestimate the diameters by a factor of 5. This finding, which indicates that the Hapke model overestimates grain sizes of ice surfaces, is consistent with a study by Khuller et al. [12].

Figure 2: The REFF (i=0°, e=30°) of a granular ice analogue with a grain diameter in the range of 40-100 µm measured in the laboratory is compared with predictions of two radiative transfer models.
We propose that future studies applying spectral unmixing techniques to remote sensing observations should use end members for granular ice media that rely solely on the basic geometric optics assumption. This will reduce the number of free parameters in the retrieval. Interpolation of precomputed spectra will allow continuous variation of model parameters in stochastic retrievals with negligible computational cost.
[1] B. Hapke, Theory of Reflectance and Emittance Spectroscopy, 2nd ed. Cambridge Univ. Press, 2012.
[2] M. Ciarniello et al., “A test of Hapke’s model by means of Monte Carlo ray-tracing,” Icarus, 2014.
[3] A. Robledano et al., “Unraveling the optical shape of snow,” Nat. Commun., 2023.
[4] T. U. Kaempfer et al., “A three-dimensional microstructure-based photon-tracking model of radiative transfer in snow,” J. Geophys. Res. Atmos., 2007.
[5] T. Väisänen et al., “Scattering of light by dense particulate media in the geometric optics regime,” JQRST, 2020.
[6] G. Picard et al., “Determining snow specific surface area from near-infrared reflectance measurements,” Cold Reg. Sci. Technol., 2009.
[7] R. Ottersberg et al., “PhotonTracer: A GPU-accelerated ray tracing simulation of light transport in highly multiple scattering media,” JQRST, 2026.
[8] K. Muinonen et al., “Light scattering by Gaussian random particles: Ray optics approximation,” JQRST, 1996.
[9] R. Mastrapa et al., “Optical constants of amorphous and crystalline H₂O-ice in the near infrared from 1.1 to 2.6 µm,” Icarus, 2008.
[10] K. Stephan et al., “Vis-NIR reflectance spectra of H₂O ice with varying grain sizes, shapes and mixtures, from 70 to 220 K,” SSHADE, 2021.
[11] G. Filacchione et al., “Saturn’s icy satellites and rings investigated by Cassini–VIMS: III – Radial compositional variability,” Icarus, 2012.
[12] A. R. Khuller et al., “Quantitative evaluation of the delta-Eddington, Hapke, and Shkuratov models for predicting the albedo and inferring the grain radius of ice,” Icarus, 2025.
How to cite: Ottersberg, R. and Pommerol, A.: Modelling the reflectance of icy planetary regoliths in the geometric optics limit, Europlanet Science Congress 2026, The Hague, The Netherlands, 7–11 Sep 2026, EPSC2026-1091, https://doi.org/10.5194/epsc2026-1091, 2026.
Introduction
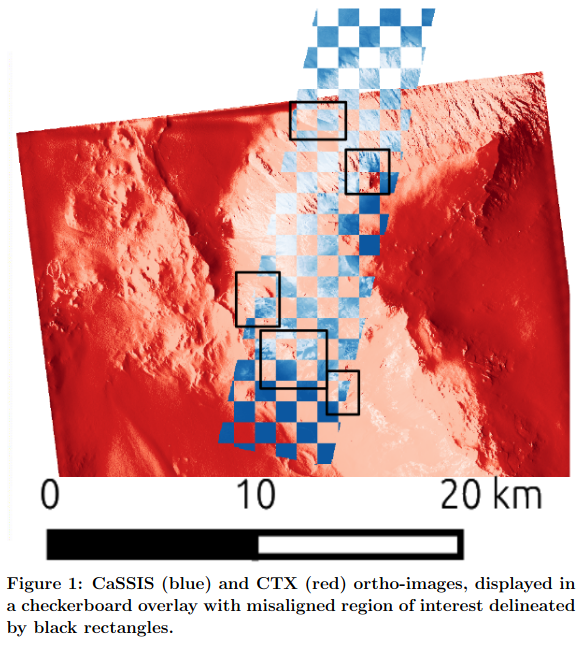
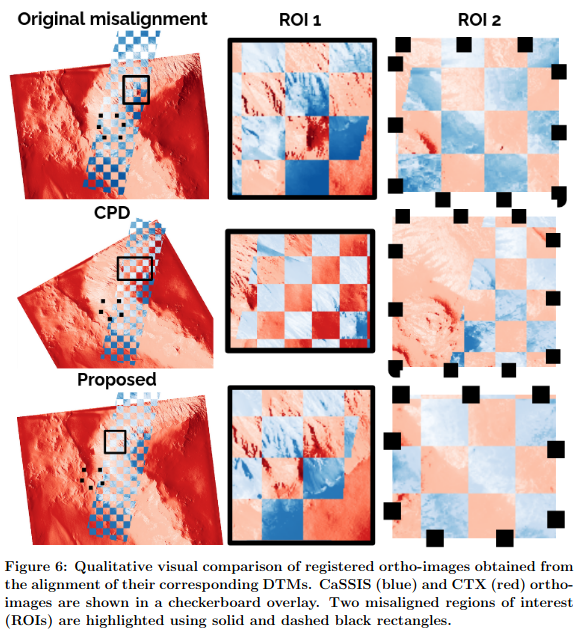
The integration of complementary remote sensing data acquired from multiple satellite platforms represents a fundamental challenge in planetary science, one that has become increasingly critical as mission datasets grow in volume, diversity, and scientific ambition. Addressing this challenge requires two distinct but deeply interconnected steps. Firstly, it demands precise spatial alignment as a critical preprocessing step, ensuring that observations from different instruments can be meaningfully compared and combined. Secondly, the fusion of these data must account for heterogeneous samplings and partially overlapping acquisition footprints, which vary considerably across sensors and orbital geometries. This registration task is particularly demanding for extraterrestrial rocky planets due to several inherent difficulties: the scarcity of distinctive surface features that can serve as reliable landmarks, the absence of ground control infrastructure available on Earth, and significant variations in the spatial coverage between different datasets. As illustrated in Figure 1 with the discrepancy of control points of CTX and CaSSIS data on a ridge of Capri Chasma, these misalignments can be substantial, with spatially offset layers introducing systematic errors that propagate through any downstream scientific analysis, from compositional mapping to geomorphological interpretation.

Methods
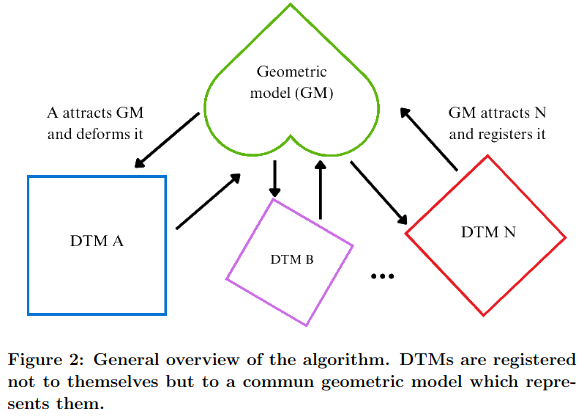
To address these challenges, we propose a novel methodology IReSISD-DTM[1] that leverages three-dimensional topographic information derived from stereo image pairs, specifically utilizing Digital Terrain Models (DTMs). Rather than relying on intensity-based image matching or sparse feature correspondences, our approach exploits the geometric richness encoded in 3D surface representations, making it inherently more robust to the radiometric variability of different acquisitions and textureless regions commonly encountered in planetary imagery. As shown in Figure 2, which provides a overview of the IReSISD-DTM pipeline, our method employs 3D geometric principles to achieve automatic rigid registration between DTMs and subsequently propagated to their associated ortho-images. This enables hands-free, accurate alignment of planetary surface data while simultaneously generating a unified geometric model from the initial DTMs at a user-defined resolution and sampling. This fusion capability is particularly valuable when consolidating datasets of different native resolutions into a single, coherent product suitable for multi-scale analysis or scientific outreach.

Experiments and results
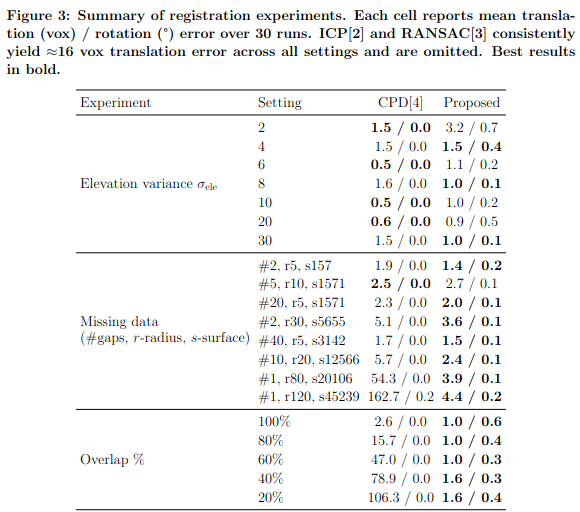
The performance of our method is rigorously evaluated through comparative analysis against both baseline techniques and state-of-the-art registration algorithms and data fusion frameworks. As summarized in Figure 3, which presents our quantitative registration result tables, IReSISD-DTM consistently achieves competitive or superior alignment accuracy across all tested configurations. This evaluation is conducted using two complementary datasets: (1) a newly developed benchmark consisting of synthetic planetary DTMs specifically designed to simulate realistic extraterrestrial terrain conditions, including controlled levels of noise, data gaps, and overlap variation; and (2) actual Martian topographic data acquired by in-orbit sensors (CTX, CaSSIS, and HiRISE) from orbital missions spanning a wide range of spatial resolutions and swath widths.

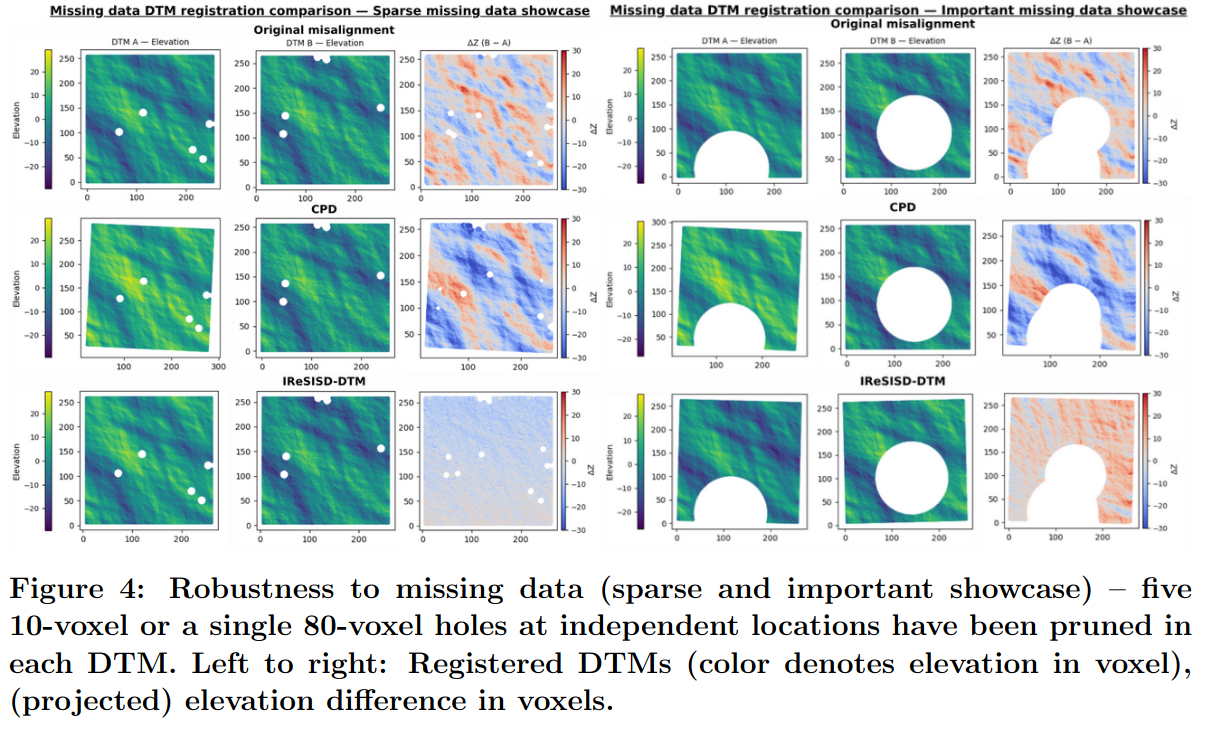
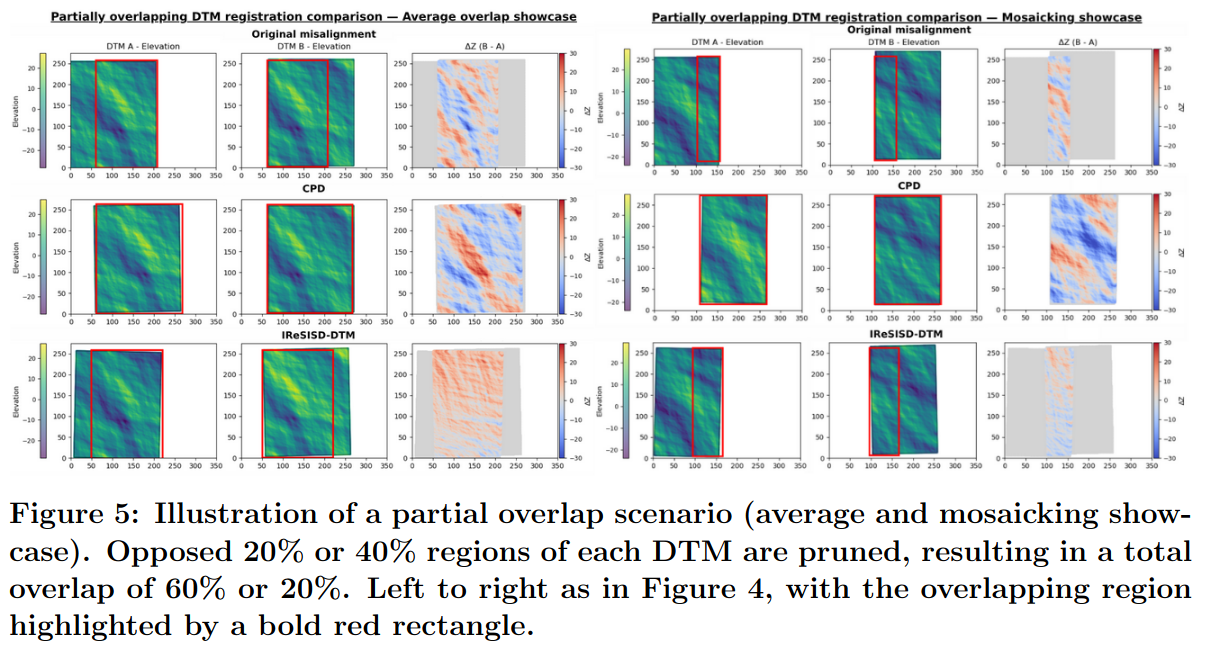
A central finding of this work is that our 3D geometric registration approach achieves satisfactory alignment accuracy while exhibiting significantly enhanced robustness to common remote sensing challenges that severely degrade the performance of conventional methods. Two such challenges are of particular practical importance. The first is incomplete data coverage, arising from sensor occlusions, processing artifacts, or orbital gaps, which introduces missing data regions that undermine correlation-based registration strategies; Figure 4 presents curated examples that highlight how IReSISD-DTM maintains reliable performance even under such conditions. The second challenge is varying degrees of overlap between acquisitions from different orbital passes or instruments; Figure 5 demonstrates, through additional curated examples, that our method sustains accurate registration even when the shared surface area between two datasets is limited, a scenario where all tested SOTA approaches fail entirely.


The practical utility of IReSISD-DTM is further demonstrated through its application to three real-world Martian data integration scenarios of increasing complexity. The first involves the registration of a multi-sensor dataset over a cliff face in Capri Chasma, a region of dramatic relief within Valles Marineris, where the precise alignment of high-resolution imagery and topographic products is essential for structural geological analysis; this result is illustrated in Figure 6. The second scenario involves constructing a sparse Martian mosaic over Jezero Crater by aligning orbital observations with heterogeneous coverage patterns. The third and most complex scenario involves a multi-resolution, multi-sensor dataset over Gale Crater, integrating orbital products from CaSSIS, CTX, and HiRISE with in-situ 3D products collected by the Curiosity rover and MOLA point clouds. Together, these case studies establish the versatility and practical relevance of our framework across a wide spectrum of planetary data integration problems.

Conclusion
Our contributions can be summarized along four principal axes: (1) a robust 3D geometric registration framework specifically designed for planetary DTM alignment, capable of operating without manual intervention or ground control points; (2) a customizable fusion method that consolidates the geometric information of multiple DTMs at a resolution and sampling defined by the user; (3) a comprehensive benchmark dataset for the systematic evaluation of planetary surface registration algorithms under controlled and reproducible conditions; and (4) empirical validation demonstrating superior performance in handling footprint-related challenges, including data gaps and limited overlap; compared to existing methods, validated across CaSSIS, CTX, HiRISE, MOLA and Curiosity datasets. Taken together, these contributions advance the state of the art in planetary data integration and lay the groundwork for more automated and scalable multi-mission analysis pipelines.
References
[1] L. Brun, S. Doute, J. Bernard-Salas, and A. Paiement. 3D registration of remote sensing data for planetary exploration. CVPR 2026 Workshop on 3D Geometry Generation for Scientific Computing, 2026.
[2] K. S. Arun, T. S. Huang, and S. D. Blostein. Least-squares fitting of two 3-D point sets. IEEE Transactions on Pattern Analysis and Machine Intelligence (PAMI), 9(5), 1987
[3] M.A. Fischler and R. C. Bolles. Random sample consensus: A paradigm for model fitting with applications to image analysis and automated cartography. Communications of the ACM, 24(6), 1981. 1, 5
[4] Myronenko and X. Song. Point-set registration: Coherent point drift. IEEE Transactions on Pattern Analysis and Machine Intelligence (TPAMI), 32(12), 2010. 2, 5
How to cite: Brun, L., Paiement, A., Douté, S., Tullo, A., and Bernard-Salas, J.: 3D registration and fusion of remote sensing data for planetary exploration, Europlanet Science Congress 2026, The Hague, The Netherlands, 7–11 Sep 2026, EPSC2026-1040, https://doi.org/10.5194/epsc2026-1040, 2026.
Introduction
Recent lidar instruments can measure the full waveform recording, allowing for the travel-time measurement of each emitted photon packet. This new information will allow finer characterization of the planetary surface medium. The BepiColombo laser altimeter (BELA) (Thomas2021) will explore the surface of Mercury using this capability. We propose a new simulation tool computing the travel-time inside planetary medium allowing the reconstruction of the full waveform for such instruments. It is a Monte-Carlo ray tracing algorithm called WARPE, for Waveform Analysis and Ray Profiling for Exploration (Barron2025). As input, the model uses relevant physical properties for planetary surface characterization.
Methods
The Monte Carlo ray tracing approach of WARPE is based on the work from Farrell1992, Wang1995 and Gastellu-Etchegorry2016. It computes the position each ray during its travel through the medium and possible interactions at the interfaces. The efficiency of WARPE is guaranteed by ray batch parallelization (further details in Barron2025). Main parameters are incidence and azimuthal angle, the optical thickness (τ0), the single scattering albedo (ω) the optical index (n,k) of the medium and the phase function. Moreover, it is possible to precompute radiative parameters using physical parametrization described in Hapke1993, Andrieu2015 and Douté1998, therefore we are able to use physical properties such as thickness, grainsize or porosity as input for WARPE’s simulation process. Furthermore, WARPE’s result are put under the BELA simulation pipeline (Steinbrügge2018; HosseiniArani2021) to includes instrumental effect on the simulated pulse shape.
Result
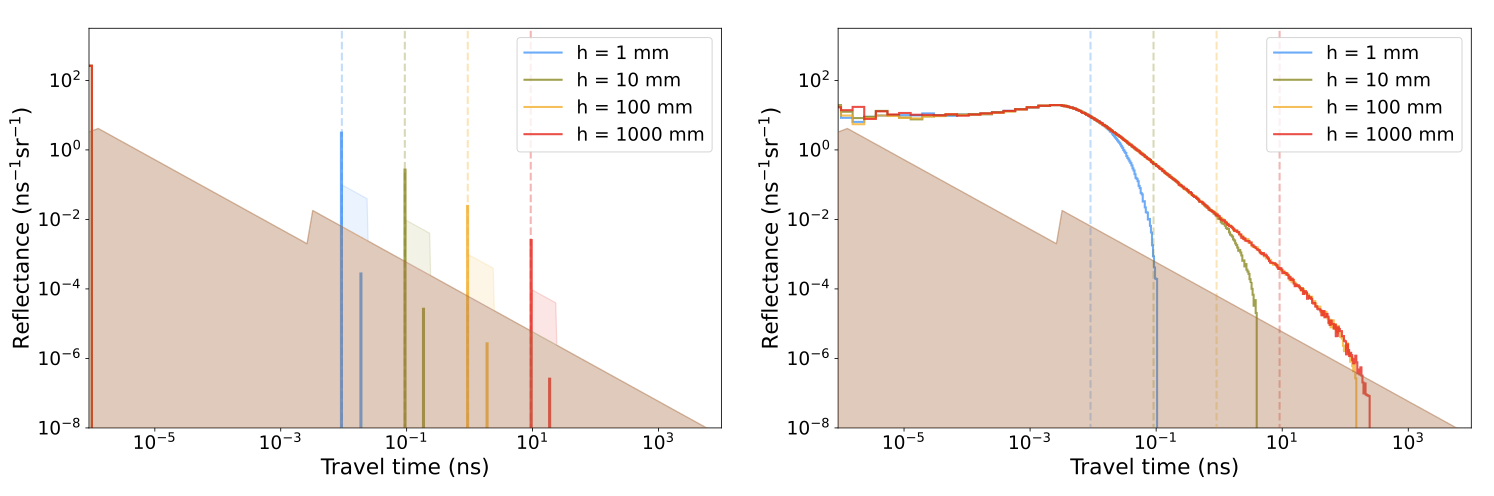
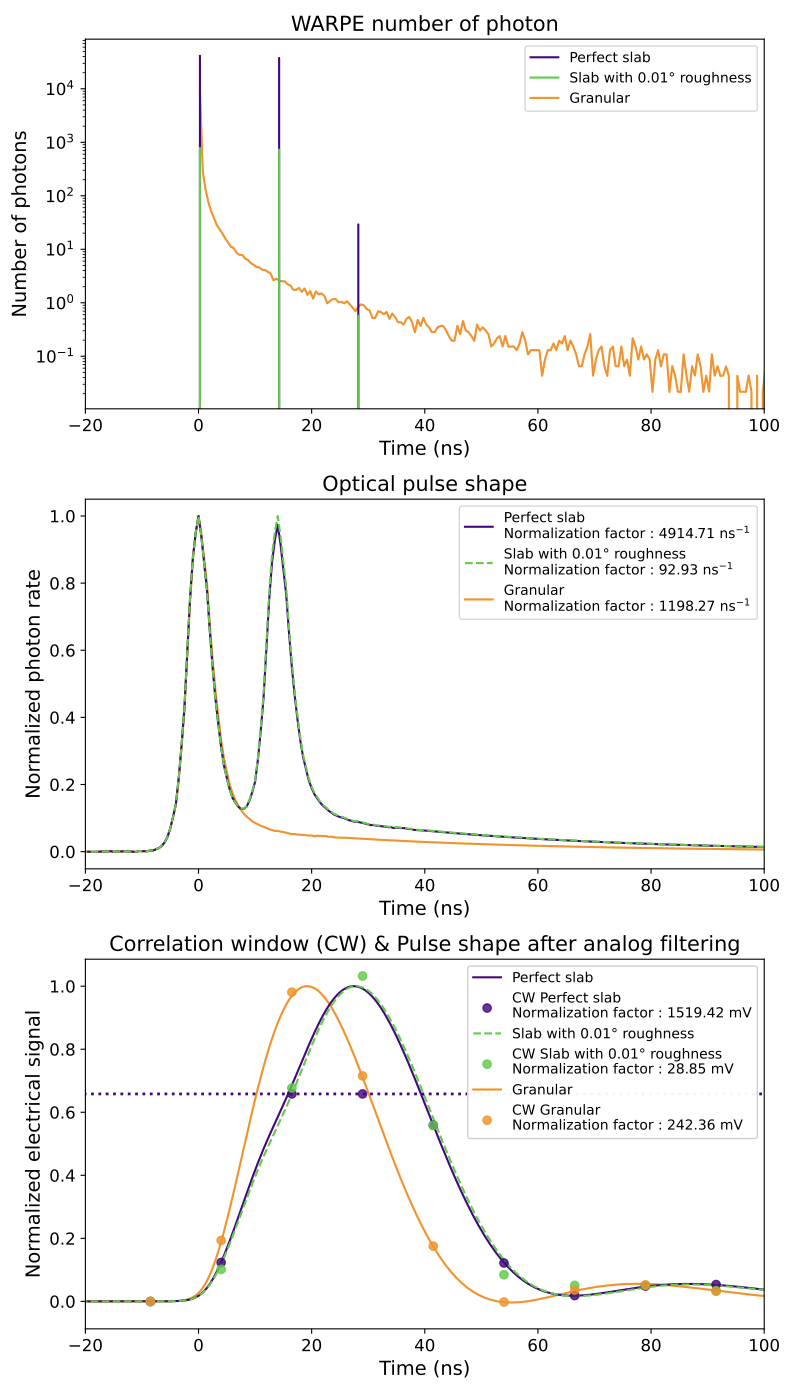
We describe here only the effect of medium properties on the pulse shape (details in Barron2026) ; roughness influence is more thoroughly discussed by Nishiyama2026. The altitude has an impact on the pulse shape global intensity. Spacecraft altitude is considered at 500 km. Figure 1 shows the output of WARPE computation. Most of cases simulated don’t extend enough in time dimension to reach BELA sampling interval of 12.5 ns. Figure 2 presents relevant WARPE’s output under BELA simulation pipeline (Nishiyama2026) to add the instrumental effects and simulate realistic observation. We see here that granular and compact media configuration don’t have the same response. Slab media pulse shapes tend to shift in time due to the convolution of both specular and back and forth peak. This feature is expected only for compact slab due to interactions at interfaces.

Figure 1: Effect of physical thickness on the waveform. The medium is pure CO2 ice with a thickness h. (left) In this situation, the compact slab is optically thin (τ0 ∼ 0.01) CO2 ice at 1064 nm being a very low absorbing medium (kCO2 ∼ 10-12). The visible features are the specular reflection and the Back and Forth (rays reaching the bottom of the medium and leaving it at the top). At 1000 mm the return time of the first Back and Forth almost reach BELA sampling interval of 12.5 ns but in this case the required thickness is 1335 mm. (right) The granular medium contains grain of 200 μm radius and porosity of 10%. the waveform distribution is not changed for thicker h in the shorter time domain, but rather after a threshold time that depends on h.

Figure 2: Realistic BELA pulse shape using WARPE and instrumental simulations (Nishiyama2026). (top) WARPE simulation of a perfect instrument with 3 cases: 1000 mm granular medium of pure CO2 ice with grain size of 200 μm and 10% porosity noted Granular ; 1500 mm pure slab of CO2 with no roughness noted perfect slab and finally the same slab with a mean roughness of 0.01°. (middle) The photons rate (in ns-1sr-1) reflected from the surface using realistic outgoing pulse shape from BELA (considering perfect receiver). Granular medium present a single peak, whereas the slab medium present 2 peaks due to the specular reflection at the top and at the bottom (direct Back and Forth). The third peak is negligible. Interestingly, the first peak shape is very similar in the slab and granular case. (bottom) The electric signal shape after analog filtering expected including both transmitter and receptor specification. This signal sampled at 12.5 ns is the one recorded by the BELA instrument. Granular and slab signals do not reach their maximum at the same time and their shape significantly differ due to the presence/absence of a second peak in optical pulse shape. The shape of the signal for slab with different roughness is similar however their intensities varies (Normalization factor are displayed). The purple dotted line indicates saturation threshold of 1000 mV from BELA. The green (and orange to a lower extent) dots do not perfectly match the curves due to added random noise in the signal sampled by BELA.
Conclusion and perspectives
We introduce a new approach to efficiently simulate the travel-time of photons in both granular and compact texture using as input physical parameters relevant for planetary surface characterization. Identification of microtextures relies on also on instrumental effect as they tend to hide smaller variations of physical properties. This study focuses on ices in PSR, but it could be extended to other cases such as mercury regolith with BELA, or icy moons’ surfaces with the Ganymede Laser Altimeter (GALA).
References
Andrieu et al. (2015), Applied Optics, https://doi.org/10.1364/AO.54.009228
Barron et al. (2025), Journal of Quantitative Spectropy and Radiative Transfer https://doi.org/10.1016/j.jqsrt.2025.109575
Barron et al. (2026), Simulation of laser travel-time on Mercury for BELA, Earth, Planets and Space (under review) (preprint on ArXiv)
Douté, Modelisation numerique de la reflectance spectrale des surfaces glacées du systeme solaire. application à l’analyse de spectres de triton et pluton et au traitement d’images hyperspectrales nims de io, Ph.D. thesis, Université Paris VII, thèse de doctorat dirigée par Schmitt, Bernard Terre, océan, espace Paris 7 1998 (1998).
Farrell et al. (1992), Medical Physics, https://doi.org/10.1118/1.596777
Gastellu-Etchegorry et al. (2016), Remote Sensing of Environment, https://doi.org/10.1016/j.rse.2016.07.010
Hapke, Theory of reflectance and emittance spectroscopy (1993), Cambridge university press
HosseiniArani et al. (2021), Planetary and Space Science, https://doi.org/10.1016/j.pss.2020.105088
Nishiyama et al. (2026), Return pulse shape simulations for predicting surface characterization of mercury by the bepi-colombo laser altimeter (bela): Implication to within-footprint roughness estimation by laser altimeters, Earth, Planets and Space (submitted soon).
Steinbrügge et al. (2018), Planetary and Space Science, https://doi.org/10.1016/j.pss.2018.04.017
Thomas et al. (2021), Space Science Reviews, https://doi.org/10.1007/s11214-021-00794-y
Wang et al. (1995), Computer Methods and Programs in Biomedicine, https://doi.org/10.1016/0169-2607(95)01640-F
How to cite: Barron, J., Schmidt, F., Andrieu, F., Nishiyama, G., Stark, A., and Hussmann, H.: Pulse shape and travel-time simulation to study the surface of Mercury, Europlanet Science Congress 2026, The Hague, The Netherlands, 7–11 Sep 2026, EPSC2026-80, https://doi.org/10.5194/epsc2026-80, 2026.
Optical cameras with wideband filters or color filters, or hyperspectral cameras, are typical instruments on board space missions. Before the actual imaging operations during the missions, these operations need to be planned and tested. Furthermore, the data processing pipelines for the image data need to be designed and tested. For both of these tasks, realistic simulated instrument data is needed.
We have been working together with the hyperspectral camera team from VTT Finland who are providing the Fabry-Pérot hyperspectral cameras for ESA’s Hera mission (ASPECT camera on Milani CubeSat) and for Comet Interceptor mission (NIR-MIR part of the MIRMIS instrument on the main spacecraft). We have developed a Blender/Python framework where camera simulations can be done. There are some important design goals we are concentrating on with our tool. They are: (1) Realistic and trackable surface scattering models typical to planetary science applications; (2) Physically correct volume scattering models for dust and gas in cometary coma; (3) Interoperations with SPICE kernels for target shape and attitude, camera location and attitude, and solar illumination direction; (4) Camera and detector simulations to produce the observed image in the internal digital numbers from the instrument including the noise components from the instrument.
To reach our goals, we have a Python module that can be loaded to be used in the internal Python console of the open-source Blender 3D rendering software for the image rendering tasks, and a stand-alone Python module for the image post-processing functions including expanding a single-wavelength rendered image into a hyperspectral datacube, and producing the instrument-dependent output. This output can be used to test the data processing pipelines of the instrument and should produce realistic radiances and instrumental errors.
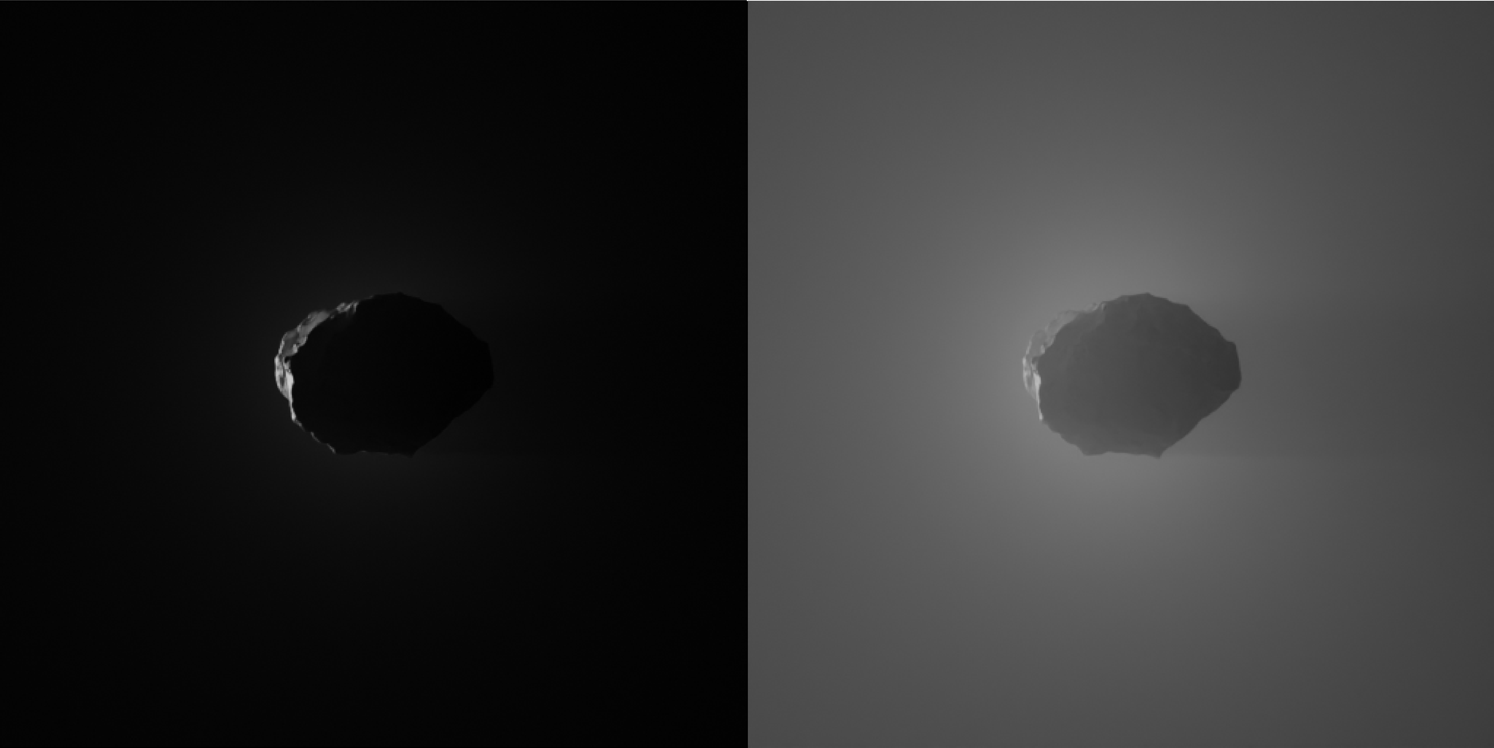
The development of the tool is an ongoing project, versions of the software are published as open source[1], but improved version is under work. The recent improvements include a complete rework of the Blender Python module design and including the gas and dust volume rendering for cometary environments. An example of two renderings of a comet nucleus with either nominal activity from the Comet Interceptor dust and gas model, or an extravagated activity, are shown in the figure. Using the tool in testing the Hera ASPECT and Comet Interceptor NIR-MIR part of MIRMIS data pipelines will be presented.

[1] Asteroid Image Simulator software at https://bitbucket.org/planetarysystemresearch/asteroid-image-simulator
How to cite: Penttilä, A., Kolehmainen, M., Keski-Vakkuri, A., and Negri, L.: Hyperspectral camera simulations using Blender with applications on the ESA Hera and Comet Interceptor missions, Europlanet Science Congress 2026, The Hague, The Netherlands, 7–11 Sep 2026, EPSC2026-984, https://doi.org/10.5194/epsc2026-984, 2026.
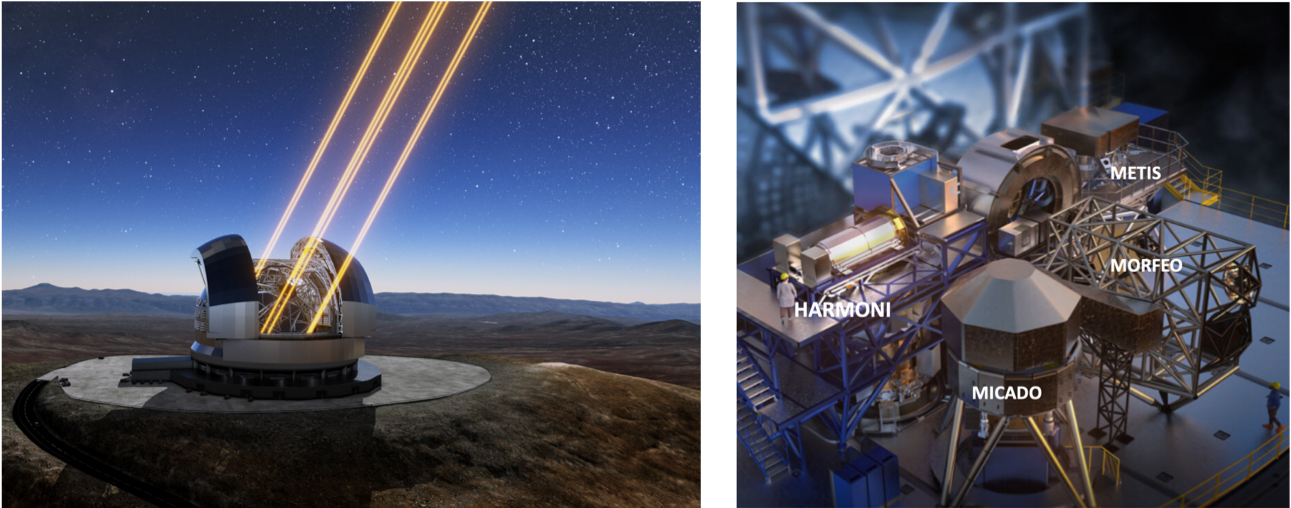
In 2029, the Extremely Large Telescope (ELT) operated by the European Southern Observatory (ESO) will see its first light [Fig. 1]. Thanks to its 39-metre primary mirror and built-in adaptive optics, the telescope will offer extreme angular resolution (approximately 6 milliarcseconds at a wavelength of 1 µm and approximately 12 milliarcseconds at 2.2 µm) and sensitivity (limiting ABmag of 30 in K with S/N>=5 ), which will be harnessed by versatile instrumentation to carry out unprecedented observations of a wide variety of astrophysical objects. In particular, the MICADO camera (Davies et al., 2021, ESO Messenger, Vol. 182, pp. 17–21) will offer exceptional capabilities in broad and narrow band imaging (53" × 53" and 20" × 20" fields of view (FoV) with a pixel scale of, respectively, 4 and 1.5 mas), astrometry (precision of 10–50 µas), and slit spectroscopy (R ~ 20,000 for point sources and R ~ 10,000 across the slit) in the near-infrared (0.8–2.4 µm). A few years later, the HARMONI integral-field spectrometer (1.4–2.5 µm) will be the key instrument for corroborating and enriching MICADO’s spectroscopic results (approximately 30,000 spectra with a pixel scale of up to 6 mas and simultaneous H+K spectrum acquisition at R = 1500). These MICADO and HARMONI observations, which are unprecedented, will be made possible by MORFEO (Ciliegi et al., 2021, Messenger, Vol. 182, pp. 13–16), a multi-conjugate adaptive optics (MCAO) system. MORFEO will provide, under average atmospheric conditions over a large FoV (60"), a diffraction-limited correction for atmospheric turbulence achieving a Strehl ratio = 0.44 in K band, 0.08 in J band for 50% of the sky.

Fig 1. (Left) The ELT in action with its six lasers fired to probe the atmospheric turbulence. (Right) A representation of the first light instruments gathered on their Nasmyth platform. (credits ESO).
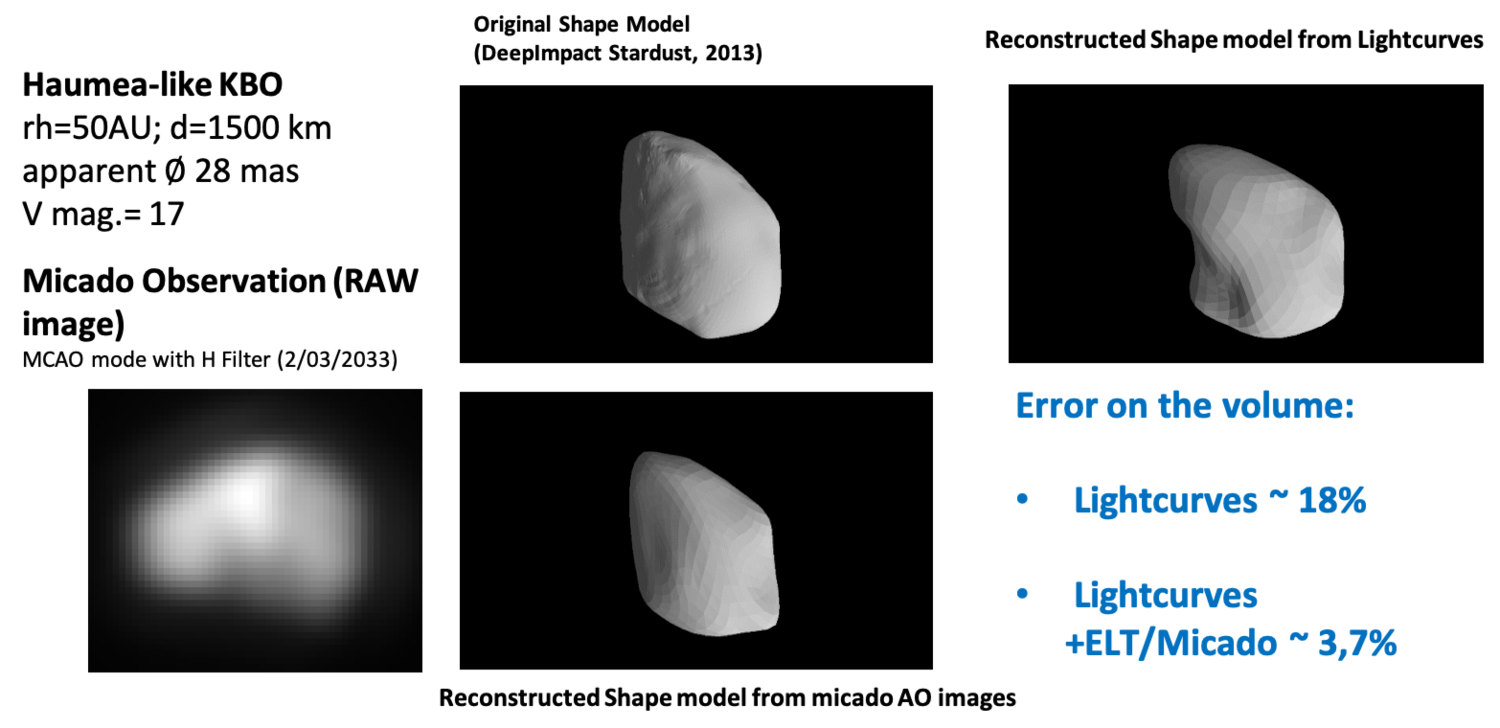
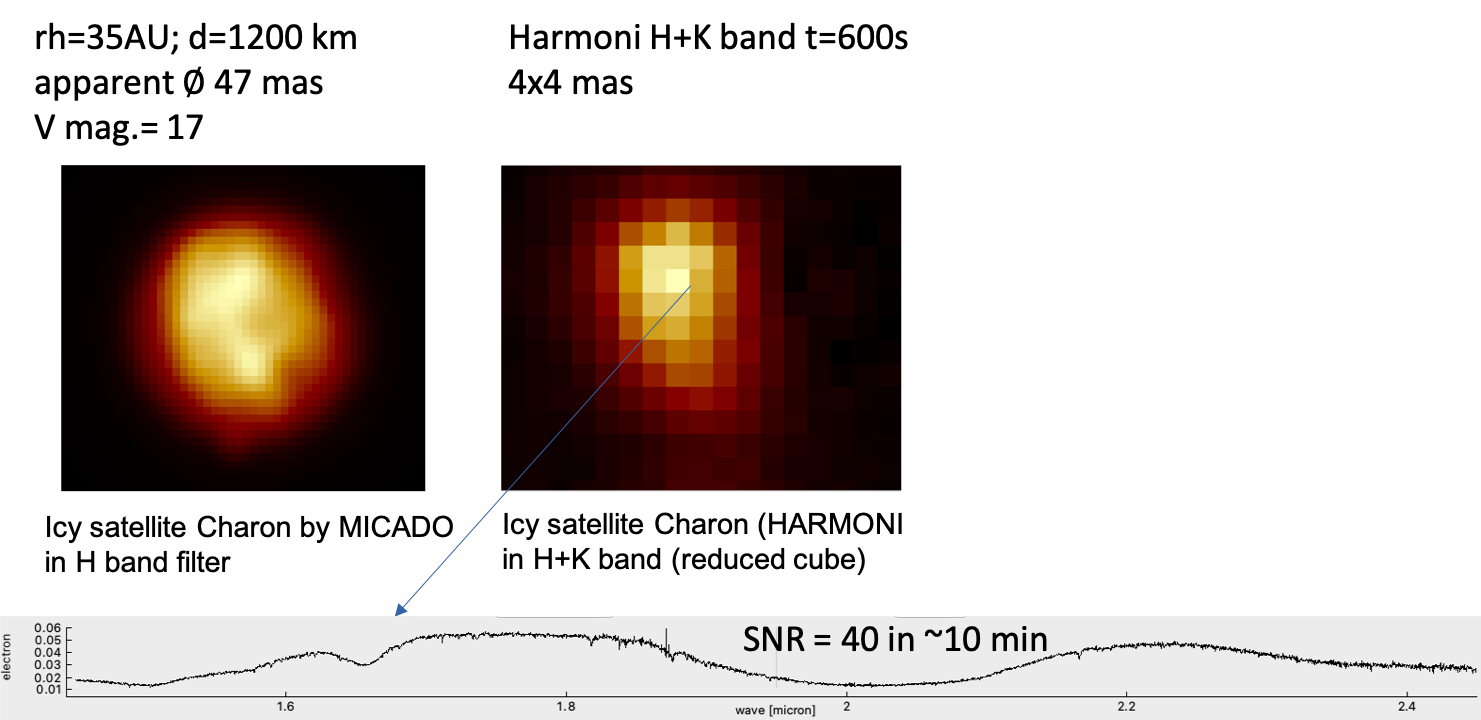
With its high sensitivity and spatial resolution capabilities (down to approximately 5 km at Ceres, 12 km at Ganymede, 25 km at Titan and 120 km at Pluto), the ELT+MICADO/MORFEO will enable unique Solar System science. For instance, icy dwarf planets will be spatially resolved for the first time using a ground-based telescope. However, achieving exceptional results requires careful scientific preparation in advance when using a complex facility such as the ELT, which will be in high demand. The MORFEO science team contributes to these activities by identifying the science cases that will benefit most from the former instruments. For each case, the group lists key open scientific questions, states specific measurement goals, and establishes requirements for achieving these goals in terms of instrumental modes, filters, spectral resolution, sensitivity, spatial resolution. These requirements are then translated into instrument performance, adaptive optics (AO) operations adapted to non sidereal objects, observing strategies and quantitative demonstrations using simulations and analysis of images/spectra [Fig. 2, 3]. Note that the simulations rely on comprehensive object models (shape, topography, distribution of components, etc.) fed by laboratory data (reflectance measurements, transmission spectroscopy, etc.) and ephemeris web requests that determine the acquisition geometry. Other important inputs include the camera models and PSFs delivered by MCAO or SCAO, as well as all the characteristics of the ELT optical train. The raw data produced by planetary image synthesis and telescope instrument data simulation is then processed, calibrated and subjected to spatial deconvolution if needed. The final goal is to demonstrate the feasibility of the science cases while identifying the risks.

Fig. 2 Simulation of MICADO synthetic images of an Haumea like dwarf planet and analysis aimed at reconstructing the original shape model used in the simulation.

Fig. 3 Simulation of raw MICADO (left) and reduced HARMONI (right) images of Charon in the H+K band.
The science cases are organised into three main themes: (i) understanding the origins, geology, activity and evolution of icy worlds (i.e. satellites of giant planets and icy dwarf planets); (ii) small bodies (e.g. asteroids, Trojans, Centaurs, TNOs and comets) as witnesses to the formation and dynamics of the early Solar System; (iii) giant planet atmospheres as laboratories for investigating large-scale fluid dynamics and physicochemical phenomena.
Icy worlds will benefit from spatially resolved observations, which will allow us to reconstruct their shapes, map their large-scale geology and compositional heterogeneities, and determine their physical properties, such as their local surface temperatures for ices. The same kind of observations and investigations will be conducted with asteroids larger than 10 km and Trans-Neptunian Objects (TNOs) larger than 500 km. For smaller objects, longitudinal variations in global composition will be accessible via slit spectroscopy with very high spectral resolution and an unprecedented signal-to-noise ratio (SNR). Particular attention will be paid to determining the orbital and internal properties (density) of asteroids and TNOs in multiple systems. Finally, the variability of aerosol properties and minor gas abundances (CH₄, NH₃, H₂S), as well as the wind field (by tracking clouds), will be accessible with unprecedented detail at different spatial and temporal scales (yearly to monthly) in the atmospheres of giant planets, especially Uranus and Neptune.
With the arrival of the ELT and in conjunction with the James Webb Space Telescope, new discoveries regarding many objects in the solar system are on the horizon. However, the extraordinary size and specific characteristics of this next-generation telescope—particularly the widespread use of adaptive optics—will require meticulous preparation of observations for the most promising scientific cases. This preparation, led by the scientific teams of the instrument consortia, involves numerous aspects that need to be presented to the community using concrete examples.
Acknowledgment : S. D. would like to express his gratitude to the Institut des Sciences de l'Univers (INSU), the Centre National d’Etudes Spatiales (CNES), and the ANR for their support in preparing for the ELT through the PNP Origins and PEPR ORIGINS programmes. Meanwhile, A. L., M. P., J. B. and G. M. gratefully acknowledge the support of INAF-MORFEO in their own preparation activities.
How to cite: Douté, S., Beccarelli, J., Carry, B., Delsanti, A., Grassi, D., Ieva, S., Lucchetti, A., Munaretto, G., Pajola, M., and team, T. M.: Preparing Solar System object observations with the Extremely Large Telescope, Europlanet Science Congress 2026, The Hague, The Netherlands, 7–11 Sep 2026, EPSC2026-863, https://doi.org/10.5194/epsc2026-863, 2026.
HERA is ESA’s contribution to the international AIDA collaboration, aimed at characterizing the effects of DART kinetic impact on Didymos binary system. During March 2025 Mars flyby, HERA acquired Earth-based radiometric data and optical images of Mars and its satellites, Phobos and Deimos, providing an in‑flight testbed for the mission’s optical navigation (OPNAV) processing chain and orbit determination tools.
The OPNAV image‑processing pipeline developed for HERA and adapted to the flyby dataset is described. Starting from raw images, the workflow begins with geometric calibration of the Asteroid Framing Cameras (AFCs) using star‑field images to estimate the pointing of the camera and the optical distortion parameters. In-flight calibrated parameters are exploited to extract limb and center‑of‑figure measurements from the flyby images, that yield angular constraints on the spacecraft–body geometry for navigation. Those measurements are used as inputs in an Orbit Determination pipeline for the trajectory estimation of the spacecraft, as well as to derive astrometric or normal points useful for future ephemeris improvements.
For star detection and centroiding ARAGO software, developed by the Observatoire de Paris based on Caviar, was used to locate stellar and satellites centroids. Within some images of the flyby, also a subset of Mars’ craters have been included as fixed points to further constrain the spacecraft pointing. The resulting coordinates are then included in the orbit determination filter, which uses the JPL-NASA MONTE python library.
In this work, we present the AFC calibration and orbit determination activities performed for the Mars flyby campaign. The image analysis enabled the identification of systematic pointing effects and the estimation of camera distortion parameters, which were incorporated into the navigation pipeline and orbit determination process.
The flyby also provides an opportunity to validate and refine the processing pipeline in preparation for the arrival of Hera at the Didymos system in November 2026. The developed methodology will support future optical navigation analyses at the Didymos system and the extraction of high-precision measurements from imaging data for the characterization of the post-impact dynamics of the Didymos–Dimorphos system.
How to cite: Banzi, D., Gramigna, E., Lasagni Manghi, R., Zannoni, M., Tortora, P., Lainey, V., Vincent, J.-B., Kovacs, G., and Sugita, S.: A Pipeline for In-Flight Geometric Distortion Correction of HERA’s Asteroid Framing Cameras, Europlanet Science Congress 2026, The Hague, The Netherlands, 7–11 Sep 2026, EPSC2026-1008, https://doi.org/10.5194/epsc2026-1008, 2026.
The growing presence of artificial satellites and space debris in low Earth orbit poses significant and well-documented challenges for ground-based astronomical observations. Telescopes originally dedicated to asteroid detection and other celestial surveys routinely capture satellite tracks as unintended by-products. Rather than treating these features purely as noise, this work explores their potential as a source of residual scientific information. When properly identified and characterised, these tracks can contribute to orbit determination, population studies, and analyses of the temporal evolution of the low Earth orbit (LEO) environment.
The work presented at CPESS-8 (Málaga, May 2025) described the early stages of this effort, including a manual detection and cross-matching pipeline applied to archival images from the La Sagra observatory, the construction of a manually annotated dataset, and the initial development of a machine-learning-based detection system. This dataset has since become the foundation of a fully automated analysis pipeline.
The automated detection engine, now formally named StreakMind, is based on the YOLO11 Oriented Bounding Box (OBB) architecture implemented through the Ultralytics framework. The system, recently published in Astronomy & Astrophysics (April 2026), has been trained on the manually annotated dataset of satellite streak images from La Sagra and produces detections in the form of oriented bounding boxes that closely follow the geometry of each streak. From these detections, StreakMind derives astrometric parameters, including the streak centroid and endpoints via World Coordinate System (WCS) transformation, as well as the position angle. These measurements can be formatted into Minor Planet Center (MPC) 80-column observation records, enabling compatibility with standard astrometric reporting workflows.
Since CPESS-8, the pipeline has been extended to incorporate calibrated photometry. While in earlier stages photometry was used only as part of a post-processing procedure, without yielding calibrated magnitudes, the current approach aims to provide a calibrated magnitude for each detected satellite passage. This is achieved through aperture photometry performed along each detected streak, with calibration based on reference stars extracted from the Gaia DR3 catalogue. This addition enables not only geometric detection but also photometric characterisation of the observed objects.
In parallel, further developments are being explored to enhance the scientific scope of the system. In particular, cross-matching detected tracks against asteroid catalogues is currently under investigation. This would allow StreakMind to distinguish between artificial and natural objects and potentially contribute to minor planet detection and validation, thereby extending its applicability beyond satellite tracking.
A major milestone in the project has been the development of StreakMind Workbench, a desktop graphical interface that provides an interactive implementation of the full StreakMind pipeline. Developed using PyQt5, the Workbench is designed to offer a structured and reproducible workflow for observers and researchers without requiring direct interaction with Python code. The interface integrates image loading and visualisation (with native FITS support), model inference, calibrated photometry, database management, and training functionalities within a single integrated framework. The system includes configurable inference parameters, validation of MPC observatory codes, and an integrated SQLite database that stores detections, MPC-formatted observation records, camera metadata extracted from FITS headers, and image-level statistics. Additionally, a dedicated training module allows users to retrain or fine-tune the YOLO11 model on newly annotated datasets, ensuring adaptability to different observational setups.
StreakMind Workbench represents a transition from a research-oriented pipeline to an operational tool, facilitating large-scale data processing and improving accessibility for the astronomical community. A detailed description of the Workbench is currently being prepared as a companion paper.
How to cite: Carrillo Navarro, R., Duffard, R., Garcia Martín, P., Romero Hurtado, J., Morales Palomino, N., Gonçalves, L., and Ortega Ríos, Ó.: StreakMind and StreakMind Workbench: A Complete Pipeline for Streak Detection and Analysis in Ground-Based Astronomical Surveys, Europlanet Science Congress 2026, The Hague, The Netherlands, 7–11 Sep 2026, EPSC2026-27, https://doi.org/10.5194/epsc2026-27, 2026.
Please decide on your access
Please use the buttons below to download the supplementary material or to visit the external website where the presentation is linked. Regarding the external link, please note that Copernicus Meetings cannot accept any liability for the content and the website you will visit.
Forward to presentation link
You are going to open an external link to the presentation as indicated by the authors. Copernicus Meetings cannot accept any liability for the content and the website you will visit.
We are sorry, but presentations are only available for conference attendees. Please register for the conference first. Thank you.
Introduction
Fragments from the near-Earth C-type asteroid 162173 Ryugu [1,2], provide a unique opportunity to directly investigate the effects of space weathering on primitive carbon-rich materials. Space weathering includes processes such as micrometeoroid bombardment, solar wind irradiation, and cosmic ray exposure, which progressively alter the surfaces of airless planetary bodies [3]. While these effects are well understood for anhydrous materials such as lunar regolith and S-type asteroids [4-6], their impact on hydrous carbonaceous materials remains poorly understood [7,8].
This study aims to investigate the effects of space weathering on spectroscopic changes in the asteroid’s regolith material, by analyzing the returned grain A0112, which shows sub-millimeter-sized impact craters. Understanding the effects of space weathering will help improve the interpretation of the NIRS3 remote sensing data obtained from Ryugu’s surface.
Materials
In this study, the Ryugu sample A0112 (Fig.1) was investigated. It is a ~3 mm-sized fragment of regolith returned from the near-Earth C-type asteroid 162173 Ryugu by the Hayabusa2 mission [1,2]. The sample was collected during the first touchdown and originates from the asteroid’s uppermost surface layer, making it highly representative of space-weathered material. The sample was transferred to the Planetary Spectroscopy Laboratories (DLR, Berlin) for non-destructive microscopic and spectral analyses.
Methodology
Different analytical techniques were used to characterize the structural, compositional, and spectroscopic properties of A0112. For optical microscopy, a Keyence VHX-7000 digital microscope was used to investigate the surface morphology of the grain. Through this technique the microcraters, surface textures, melt splashes, and topographic features could be identified with high-resolution 2D and 3D imaging [9].
Infrared reflectance spectroscopy was performed using a Hyperion 2000 micro-FTIR microscope attached to a Bruker Vertex 80V FTIR spectrometer. More than 50 spot measurements were collected on cratered and non-cratered regions to determine the mineralogical composition. The spectroscopy was also specifically used to investigate the 2.7 microns -OH spectral feature depth of OH-bearing phases such as phyllosilicates at different locations on A0112.
Raman spectroscopy was done using a WiTec Alpha 300 confocal Raman microscope. This provided information on the structural state of the material through the analysis of the D and G bands, indicating different degrees of carbon ordering and thermal alteration.
Results and Discussion
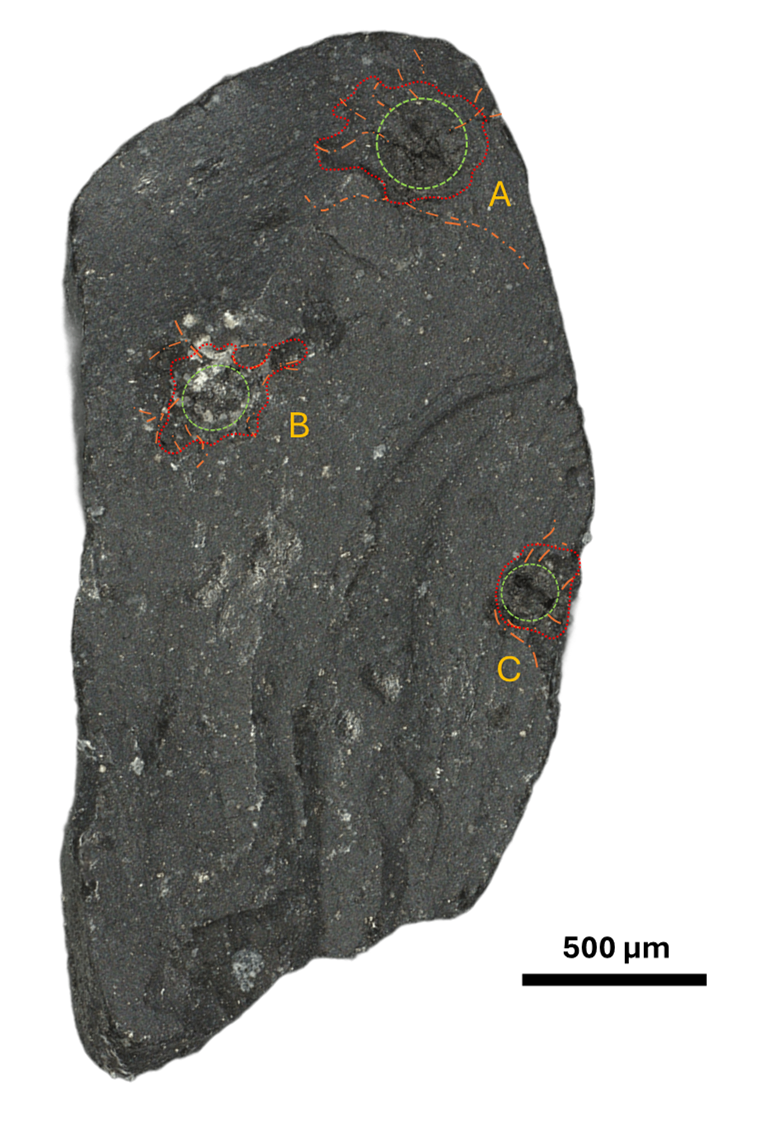
Optical imaging revealed that the surface of A0112 is heterogeneous, containing both relatively smooth areas and heavily cratered regions. One face of the grain contains three large sub-millimeter microcraters, as well as numerous smaller microcraters ranging from less than 50 µm to approximately 200 µm in diameter. Smaller craters are typically bowl-shaped, whereas larger ones are surrounded by irregular spallation zones associated with shock-induced fractures [9]. High-resolution imaging showed that many craters are lined with frothy, vesicular material identified as quenched impact melt [7,9]. Melt splashes up to 300 µm across were also observed coating nearby smoother surfaces, indicating the deposition of this amorphous material during impacts and further demonstrating that the grain has been significantly affected by space weathering processes [9].
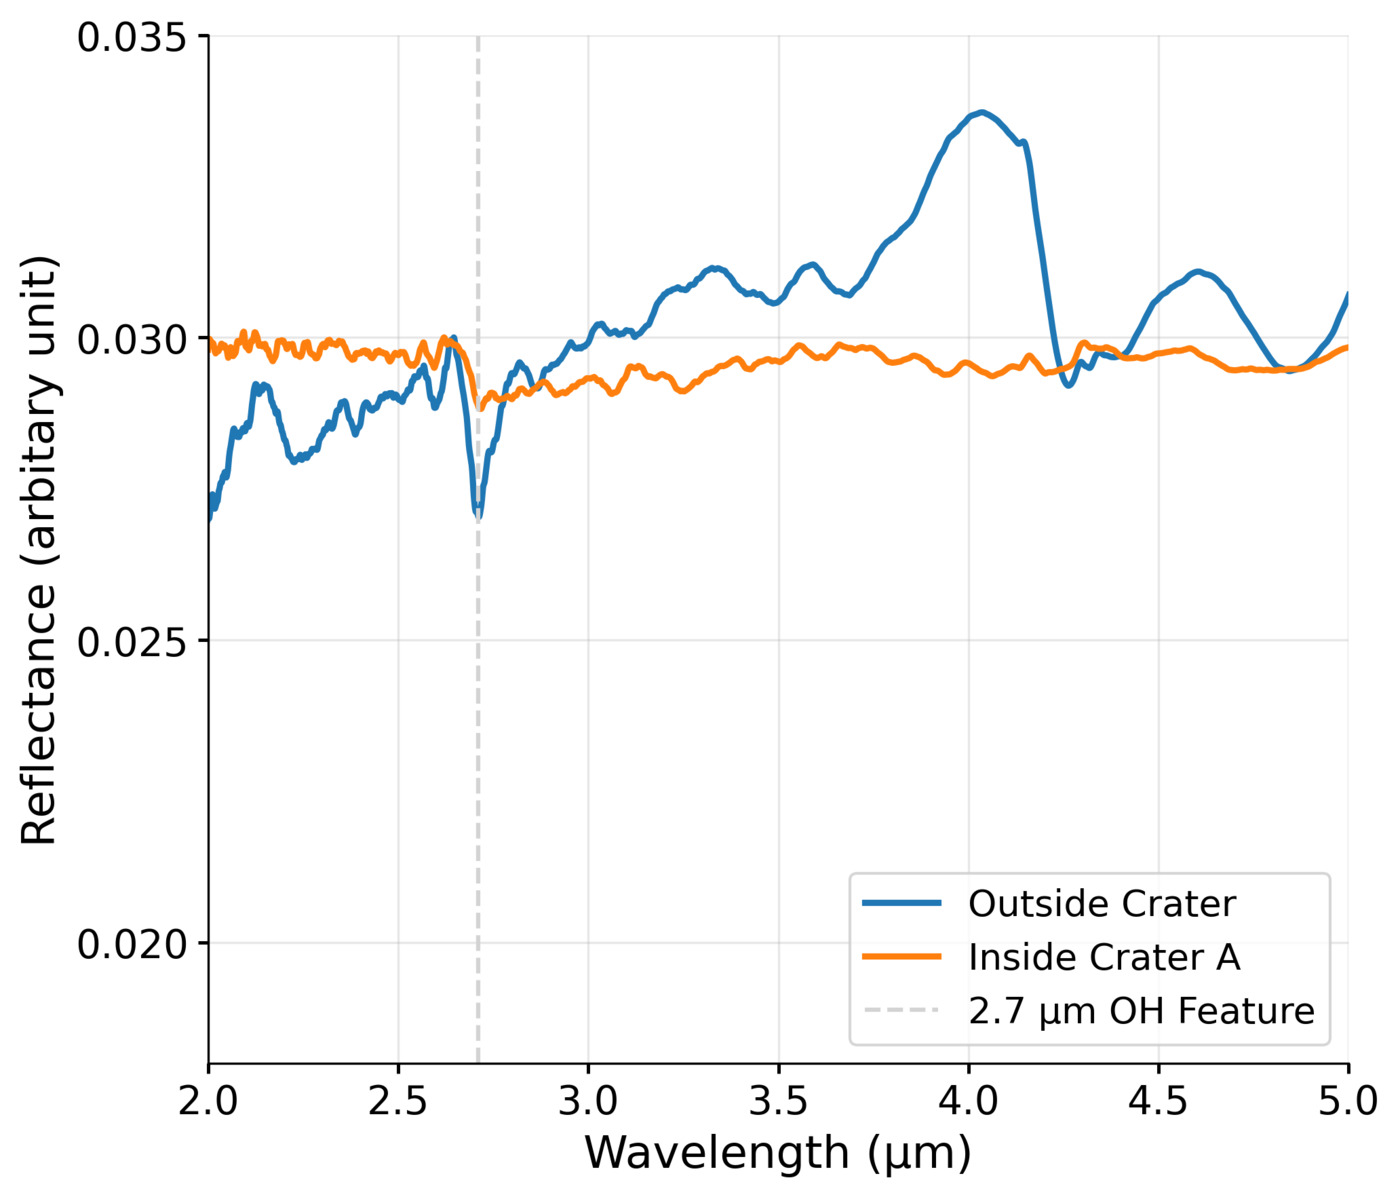
Infrared spectroscopy showed a strong contrast between the interior of the largest crater and its surrounding non-cratered regions (Fig.2). Spectra from the crater interior are largely featureless between 2 and 4 µm, indicating the loss of diagnostic absorption bands associated with hydrated minerals. These spectra resemble those of thermally altered carbonaceous chondrites such as Ivuna heated at 700 °C [10], suggesting that impact heating caused dehydration. In contrast, the non-cratered regions display strong absorption features near 2.71 µm, consistent with OH-bearing phyllosilicates, as well as absorption doublets in the 3.3-4 µm range indicating the presence of carbonates. This confirms that the original composition of Ryugu material is rich in hydrous phases.
Raman spectroscopy further highlights the differences between areas affected by space weathering and those that are not. Non-cratered regions exhibit well-defined D and G bands. In contrast, these bands are significantly reduced in cratered and melt-covered areas, indicating thermal alteration of the material during high-energy impact events.
This study shows that impact-generated melt products cause significant spectral changes, as the presence of amorphous melt material strongly reduces OH absorption bands. This effect may help explain remote sensing observations of Ryugu that show overall weaker hydration signatures. The results demonstrate that micrometeoroid impacts play a major role in altering both the physical structure and optical properties of carbonaceous asteroid regolith.
This study suggests that Ryugu’s surface is likely covered with abundant microscopic impact melt products that significantly influence its spectral characteristics. Similar processes are expected to occur on other C-type asteroids, such as 101955 Bennu. Our results contribute to a better understanding of space weathering in hydrous, carbon-rich materials and help connect remote sensing observations with laboratory analyses of returned asteroid samples.
References
[1] Yokoyama T. et al. (2023) Science 379-7850. [2] Nakamura T. et al. (2023) Science 379-8671. [3] Pieters C. M. and Noble S. K. (2016) Journal of Geophysical Research Planets 121:1865–1884. [4] Keller L. P. and McKay D. S. (1997) Geochimica et Cosmochimica Acta 64:2331–2341. [5] Pieters C. M. et al. (2000) Meteoritics & Planetary Science 35:1101–1107. [6] Noguchi T. et al. (2011) Science 333:1121–1125. [7] Noguchi T. et al. (2023) Nature Astronomy 7:170–181. [8] Melendez L. E. et al. (2023) 86th Meteoritical Society Meeting, Abstract #6286. [9] Hamann C. et al. (2023) 86th Meteoritical Society Annual Meeting, Abstract #6296. [10] Hiroi T. and Pieters C. M. (1996) LPSC XXVII, Abstract #551.

Figure 1: Reflected-light microscope image of sample A0112 showing the three largest microcraters (A, B, and C), with the crater pit high-lighted by green dashed ellipses. The surrounding spallation zones are outlined with red dotted lines, and associated fracture networks are indicated by orange dash-dot lines. the crater pit dimensions are 250 × 230 μm for crater A, 190 × 170 μm for crater B, and 150 × 150 μm for crater C.)

Figure 2: Micro-FTIR measurements acquired inside and outside the microcrater A. The blue spectrum corresponds to a measurement taken outside the microcraters, while the orange spectrum was acquired within the largest microcrater A (see Fig. 1). The 2.72 μm -OH band is represented by a grey vertical line.
How to cite: Van den Neucker, A., Helbert, J., Alemanno, G., Sander, J., Bonato, E., d’Amore, M., Hamann, C., Baque, M., Garland, S., Barraud, O., Greshake, A., Hecht, L., and Maturilli, A.: The Spectroscopic effect of Space Weathering of C-type Asteroid Regolith Documented by Microcraters on Ryugu Sample A0112. Spectral comparison with NIRS3 data., Europlanet Science Congress 2026, The Hague, The Netherlands, 7–11 Sep 2026, EPSC2026-410, https://doi.org/10.5194/epsc2026-410, 2026.
Introduction: Thermal infrared emissivity measurements of asteroid regolith analogs are challenging owing to atmospheric water vapor absorption, sample heating requirements, and the need for controlled atmospheric conditions [1], yet they provide fundamental constraints on surface thermal properties that cannot be obtained from reflectance spectroscopy alone [1]. While diffuse reflectance measurements have demonstrated that minimal fine dust coverage can dominate spectral signatures [2], spacecraft-based thermal emission instruments like the OSIRIS-REx Thermal Emission Spectrometer (OTES) observe different physical processes related to thermal emission rather than scattered light [3]. The disconnect between laboratory studies and spacecraft observations has thus limited our ability to interpret thermal infrared spectra of asteroid surfaces. Previous work using Space Resource Technology's CI simulant showed that 7-10 wt% fine dust coverage could impose fine-dominated reflectance features on coarse substrates [2], but the corresponding thermal emission properties remained uncharacterized. To bridge this gap, we conducted systematic thermal emissivity measurements of layered CI simulant materials using Oxford’s PASCALE instrument [4] under nitrogen atmosphere, constraining how dust deposition mechanisms affect the thermal emission processes observed by spacecraft instruments at airless bodies like asteroid (101955) Bennu.
Methods: We measured thermal emission of layered CI simulant [5] samples using PASCALE under nitrogen atmosphere across 2000-400 cm⁻¹ (5-25 µm), eliminating atmospheric water vapor interference. Six layering configurations were tested, using 10 wt% fines (<25 µm) and a coarse (250-500 µm) substrate, outlined in [2]: KBr (simulating porosity effects), sprinkled fines (simulating electrostatic deposition), liquid-deposited layers (isopropyl alcohol suspension), mechanically mixed samples (simulating gardening), lofted particles (gravitational settling from 1m), and directly sieved deposits. Spectra were acquired at 4 cm⁻¹ resolution with 150 scans using a Bruker 70v FTIR spectrometer, achieving signal-to-noise sufficient to identify 2% spectral contrast features [4].
Figure 1: Emissivity spectra for each layering mechanism, continuum-corrected by using the thermal gradient derived from an internal calibration target. Spectra are then normalized to 1. We note the shortwave end is subject to more noise, owing to instrument constraints, than the longwave end.
Results: PASCALE emissivity measurements reveal two distinct spectral groupings. “Fluffy” deposition methods (lofted, sieved, sprinkled) cluster together with similar spectral behavior, exhibiting prominent absorption features at ~1600, ~1400, and ~1000-1100 cm⁻¹ corresponding to carbonate and silicate vibrational modes. In contrast, KBr, liquid, and mixed samples form a second group with systematically different emissivity characteristics, reflecting porosity and compaction effects. Liquid samples display the most pronounced spectral deviations (>5% emissivity variations from unity), while the fluffy group shows more subdued but consistent spectral signatures. All method-dependent variations exceed the 2% measurement precision, demonstrating that dust deposition mechanism leaves diagnostic thermal emission signatures that can distinguish (and potentially identify) natural surface processes on airless body surfaces.
Discussion: The separation between fluffy and compact layering methods demonstrates that thermal emission spectroscopy can distinguish surface formation processes on airless bodies. These results provide constraints missing from reflectance-only studies, by characterizing thermal emission properties relevant to spacecraft observations like OTES. The ability to spectrally distinguish between natural deposition processes offers new frameworks for understanding regolith evolution and thermophysical properties on asteroid surfaces.
Summary: This study establishes thermal emissivity as a diagnostic tool for identifying dust deposition mechanisms on asteroid surfaces, demonstrating that layering processes leave distinct spectral signatures.
References: [1] Salisbury et al. (1991) Icarus 92, 280-297. [2] Belhadfa et al. (2026) MaPs, In Prep. [3] Christensen P. R. et al. (2018) Space Science Reviews (Vol. 214, Issue 5). [4] Donaldson Hanna et al. (2019) Icarus 319, 701-723. [5] Landsman Z. et al. (2020) EPSC.
How to cite: Belhadfa, E.-C., Bowles, N., and Shirley, K.: Fine Layering Effects on Thermal Infrared Emissivity of CI Simulant Materials , Europlanet Science Congress 2026, The Hague, The Netherlands, 7–11 Sep 2026, EPSC2026-518, https://doi.org/10.5194/epsc2026-518, 2026.
Introduction
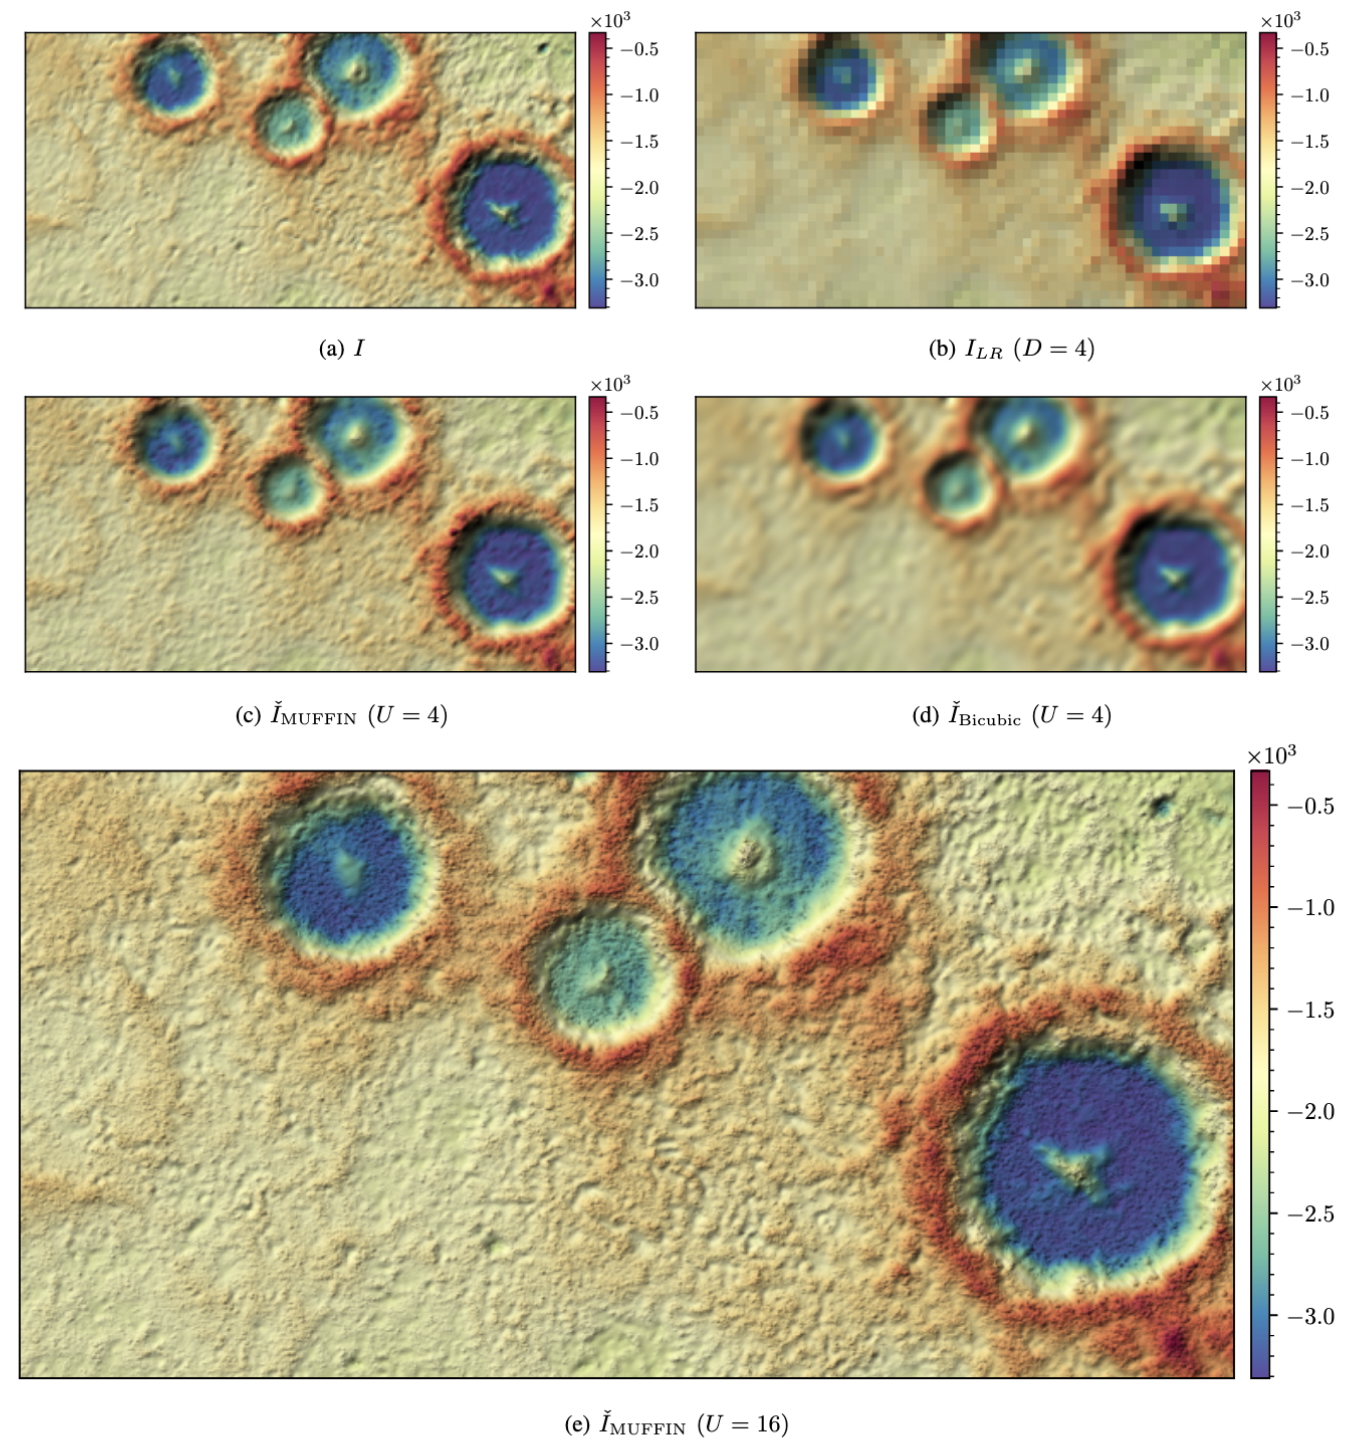
We introduce a novel statistical approach for propagating multifractal 2D fields to finer scales (upscaling a field at higher resolution than actually observed) and inpainting missing data points. The strategy ensures that the new artificially generated data follows the multifractal statistics and thus produces a more realistic field than usual interpolation methods. The method is called MUFFIN (MUltifractal Fast Fourier INterpolation).
Multifractal frameworks are used to describe systems that exhibit variability across many scales. Several formalisms and models exist to describe it [1, 2, 3], each with different assumptions, tools and applications. The most common one used in the geophysics is the Universal Multifractal (UM) model [4-9]. Moreover, since geophysical processes are generally non-stationary, an additional fractional integration to the UM is provided. This model is referred as the Fractionally Integrated Flux (FIF) and was used to perform the upscaling.
A FIF field has an analytical moment scaling function defined by the knowledge of only three parameters α, C1 and H. The intermittency of a field is controlled by the multifractality exponent α and the sparsity degree C1. The smoothness and non-conservation of the field are described by the Hurst exponent H.
Methods
For the upscaling algorithm, we used the UM continuous method from (chap. 5)[10] to generate a 2D synthetic field with the same multifractal properties (α, C1) as the input field. The input field is converted to a UM field and its size is increased by a factor U. The finer scales of the
synthetic field are then grafted to the input field, propagating its cascade to smaller scales. The final product is obtained by reapplying the fractional integration flux to get back a FIF field. The upscaling algorithm relies on the Fast Fourier Transform (FFT) and is therefore computationally efficient. It has no constraints on the field size or upscaling factor, making it robust and easy to use.
For the inpainting algorithm, we use a linear combination of 2D synthetic fields (candidates) with the same multifractal properties as the input field. The optimal linear combination of candidates recreate the exact same input field with observed data. Since the candidates do not have missing points, the unobserved points are simply filled with the one from the combined candidates. Both methods are detailed in [11].
Results
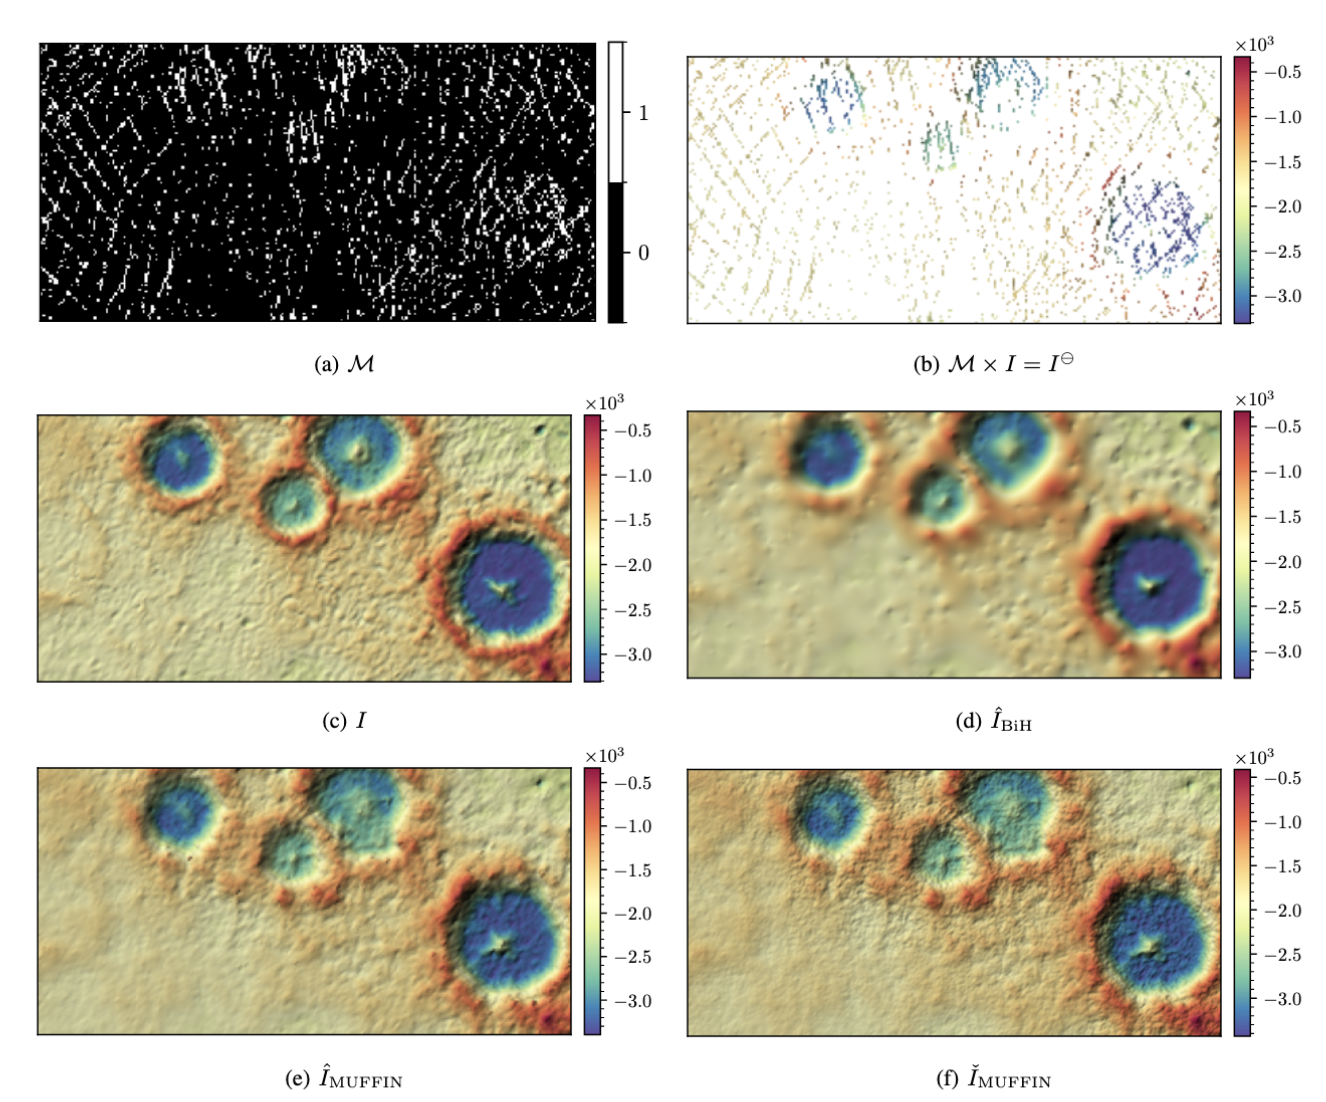
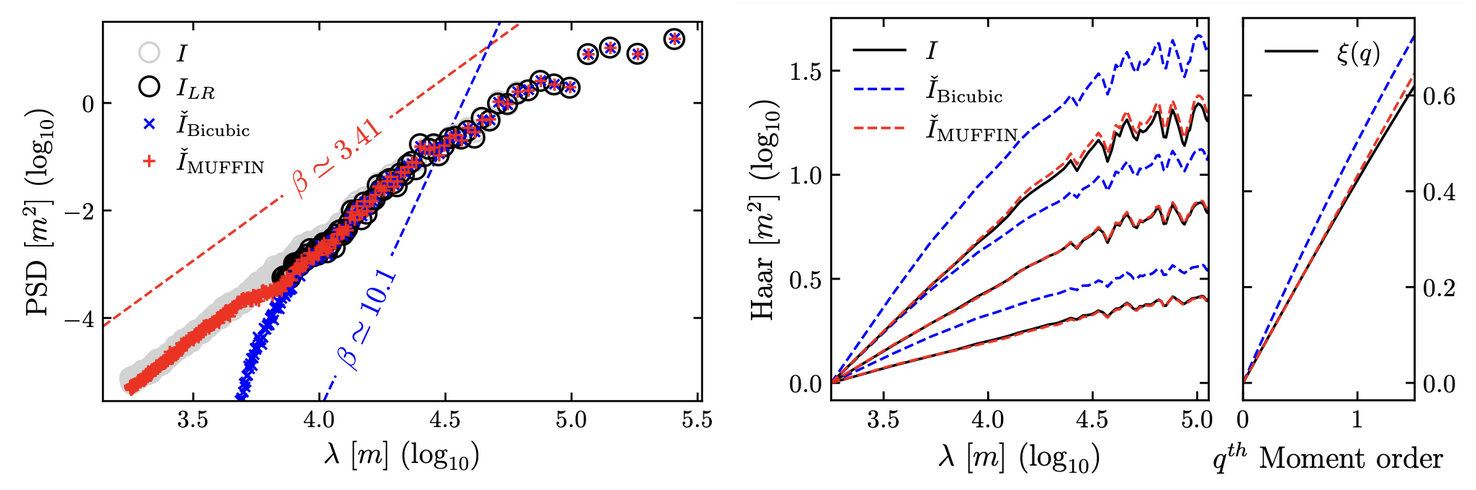
Comparison were made upon both synthetic and realistic examples. We present here the results applied on a real dataset. The upscaling and inpainting were performed on the North quadrangle of Mercury (887m/pixel), respectively on the full dataset and on the same dataset with missing points (corresponding to N orbits laser altimeter measurements). In order to validate our method, the ground truth, upscaled and inpainted fields are analyzed and compared with the Mean Haar Fluctuations (MHF) and the Power Spectral Density (PSD).The upscaling and inpainting approaches ensure an interpolated field with relatively small errors [11].
For the upscaling, the MHF Relative Root Mean Square (RRMS) and PSD RRMS are always >1% and <4%, while for a Bicubic upscaled field the MHF RRMS and PSD RRMS are always >17% and <73%.

Figure 1. (a) I: the ground truth field, (b) ILR: the input field (downscaled by a factor D=U), (c) IvMUFFIN: our method output field (upscaled by a factor U=4), (d) IvBICUBIC: the Bicubic upscaled field (upscaled by a factor U=4) and (e) IvMUFFIN : our method output field (upscaled by a factor U=16) from I as the input field. (a),(c) and (d) have a size of 512x256, (b) has a size 128x64 and (e) has a size 8192x4096. For the inpainting, the MHF Relative Root Mean Square (RRMS) and PSD RRMS are always >5% and <34%, while for a Biharmonic inpainted field the MHF RRMS and PSD RRMS are always >7% and <77%.

Fig 2. (a) I: the ground truth field, (b) ILR: the input field (with missing points), (c) IvMUFFIN: our method output field, (d) IvBICUBIC: the Biharmonic inpainted field and (f) IvMUFFIN:an upscaled version of IvMUFFIN by a factor U=2. (c) to (e) have a size of 512x256 and (f) has a size of 1024x512.
Our approaches can thus be used for users who aim at generating an interpolated dataset with realistic roughness, including the intermittent case, with statistical properties (maximum, average, other statistical moment) that are realistically assessed.

Fig 3. Multifractal analysis of Fig 1. fields, the PSD on the left and the MHF analysis normalized for order moment q=1, 1.5 and 2 on the right. The results are excellent for the MUFFIN method with a near perfect respect of the ground truth field statiscal nature (power-laws).
Conclusion
We propose MUFFIN [11], new fast and robust methods to interpolate data while keeping its statistical properties. The approach ensures an interpolated field with plausible new smaller scales and a natural look. The methods are easy to use, made with Python and necessitate a simple line of command with parameters to run.
References
[1] Schertzer et al., Physical modeling and analysis of rain and clouds by anisotropic scaling multiplicative processes, Journal of Geophysical Research: Atmospheres, 1987.
[2] Halsey et al., Fractal measures and their singularities: The characterization of strange sets, Nuclear and Particle Physics Proceedings, 1987.
[3] Muzy et al., Multifractal formalism for fractal signals: The structure-function approach versus the wavelet-transform modulus-maxima method, Physical Review E, 1993.
[4] Lovejoy et al., The l1/2 law and multifractal topography: theory and analysis, Nonlinear Processes in Geophysics, 1995.
[5] Gagnon et al., Multifractal earth topography, Nonlinear Processes in Geophysics, 2006.
[6] Lovejoy et al., Scaling and multifractal fields in the solid earth and topography, Nonlinear Processes in Geophysics, 2007.
[7] Lovejoy et al., The Weather and Climate: Emergent Laws and Multifractal Cascades, Cambridge University Press, 2013.
[8] Landais et al., Universal multifractal Martian topography, Nonlinear Processes in Geophysics, 2015.
[9] Landais et al., Topography of (exo)planets, Monthly Notices of the Royal Astronomical Society, 2019.
[10] Lovejoy et al., The Weather and Climate: Emergent Laws and Multifractal Cascades, Cambridge University Press, 2013.
[11] Lancery et al., MUltiFractal Fast Fourier INterpolation (MUFFIN): Inpainting and upscaling multifractal images, IEEE Image Processing, 2026 (submitted).
How to cite: Lancery, H., Schmidt, F., Andrieu, F., and Vannier, E.: Multifractal upscaling and inpainting of topographies using MUFFIN, Europlanet Science Congress 2026, The Hague, The Netherlands, 7–11 Sep 2026, EPSC2026-77, https://doi.org/10.5194/epsc2026-77, 2026.
MoonTools is a software framework, written in the Julia programming language [9], allowing straightforward, flexible, and performant processing of multispectral and hyperspectral data products. Designed originally to operate on M3 observations [4, 5], our framework is readily extensible to a wide range of datasets.
Drawing from functional programming [6], our framework emphasizes composition of disparate operations. Processing pipelines are constructed in native Julia, parametrised by partial function application. This approach allows for flexibility of use and ease of extensibility, and distinguishes our work from similar tools, e.g. [7]; further, Julia’s just-in-time compilation and parallel-programming tools allow for fast, multithreaded operations on multi-terabyte datasets, including for user-supplied inputs.
Implemented operations include thermal and photometric corrections of multispectral radiance cubes, reflectance retrievals, spectral parameter determination, and post-processing amongst others. Additional utilities allow users to search datasets for targets by nomenclature, terrain type, and local solar time. Various dataset export options are available, including HDF5 products and “at a glance” views of regions of interest.
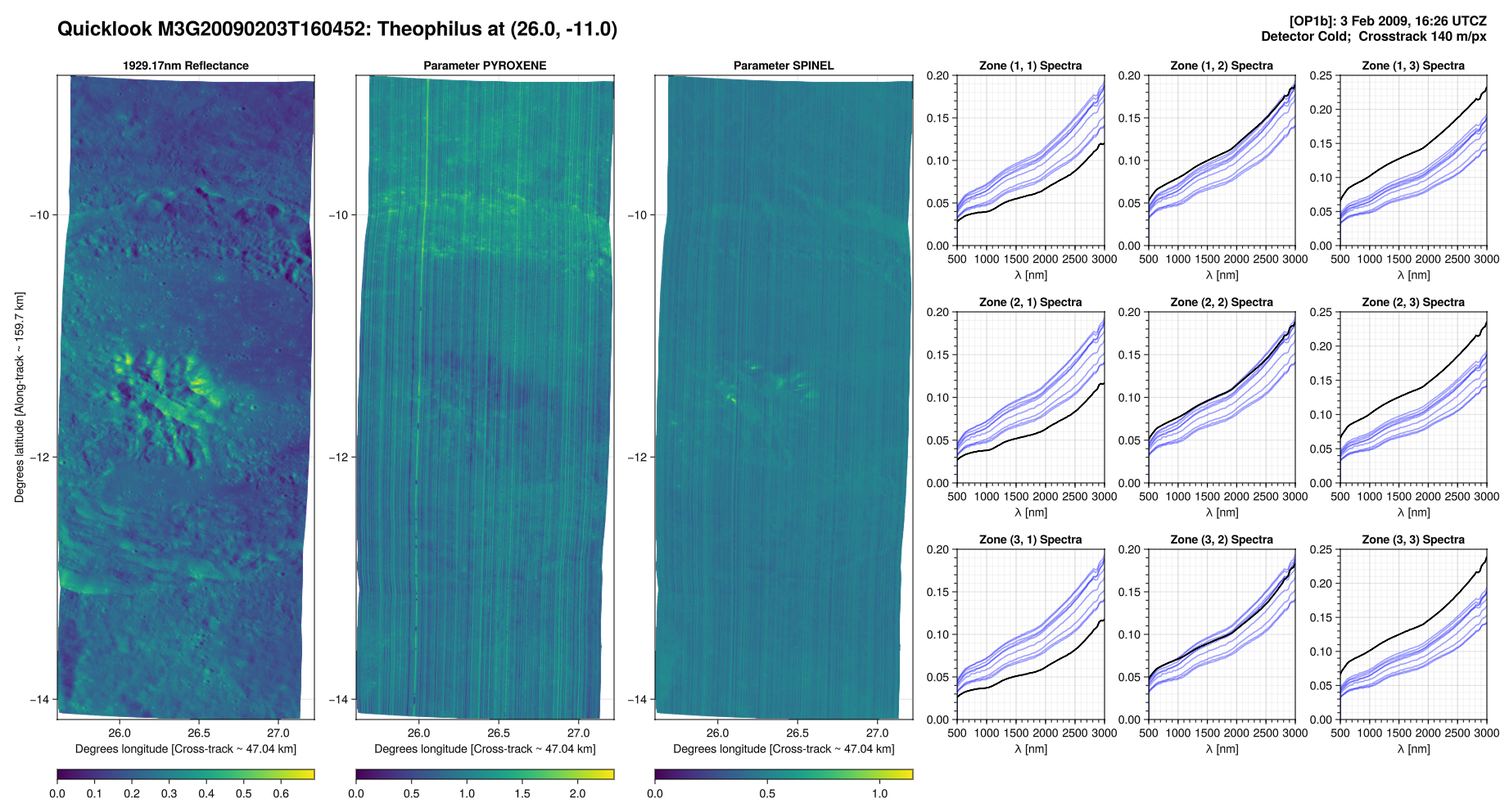
We provide an example Julia pipeline in Listing 1, reproducing the detection of spinel at Theophilus crater [1,2]. We begin by importing the MoonTools package; then, we define a RATIO parameter expression. The spectral parameters SPINEL and PYROXENE are implemented as in [2] up to a constant factor using the RATIO definition. Invoked macros produce multithreaded CPU and GPU-kernel implementations of these parameters transparently to the user. Finally, a pipeline is composed: we search M3 data for observations of Theophilus crater, apply parameters, and produce “quicklook” plots of all matching observations; one such plot is shown in Figure 1.
|
using MoonTools @paramdef RATIO(λs, R; λ1, λ2) = sum(R[λ1]) / sum(R[λ2]) @param SPINEL RATIO [1400] [1750] @param PYROXENE RATIO [0700, 1200] [0950] observations(:m3) > by_name("Theophilus") > PYROXENE > SPINEL > quicklook |

Figure 1: One of several quicklook outputs, showing Theophilus crater. Quicklooks are intended to provide overviews of regions of interest (RoIs) indicated by pipeline construction. Plots on the left include a reference narrowband reflectance, and PYROXENE and SPINEL parameter maps across the RoI. The RoI is partitioned into a 3x3 grid of zones; spectra sampled from each zone are plotted on the right in corresponding positions.
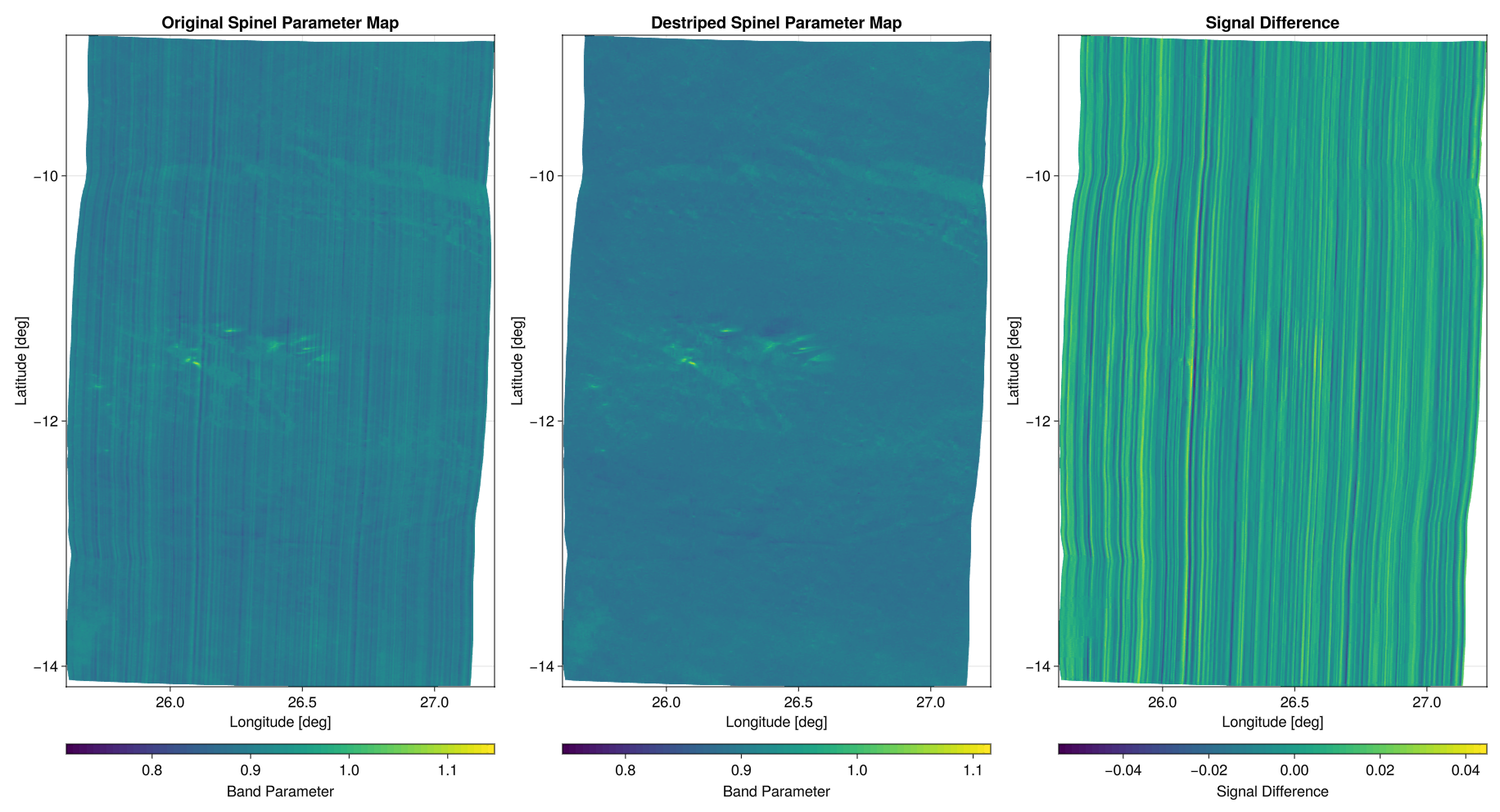
Striping artifacts exist throughout the M3 dataset, and are prominent in spectral parameter products; state-of-the-art tooling must destripe these images [7,8]. We provide a bespoke destriping algorithm using a wavelet packet decomposition [3]. The modified pipeline is given in Listing 2; a destriped spinel map is shown in Figure 2.
|
observations(:m3) > by_name("Theophilus") > SPINEL > destripe! |

Figure 2: Destriped spinel parameter map. The before and after of the destriping operation are shown in the left and center plots; the removed signal is shown on the right.
Software development is progressing rapidly. We anticipate a release of MoonTools to the scientific community in the coming months; MoonTools will be distributed under the terms of an open-source software license. We will welcome bug reports, feature requests, and contributions.
References
[1] Dhingra, D., Pieters, C.M., Boardman, J.W., Head, J.W., Isaacson, P.J. and Taylor, L.A., 2011. Compositional diversity at Theophilus Crater: Understanding the Geological Context of Mg‐Spinel-Bearing Central Peaks. Geophysical Research Letters, 38(11).
[2] Pieters, C.M., Hanna, K.D., Cheek, L., Dhingra, D., Prissel, T., Jackson, C., Moriarty, D., Parman, S. and Taylor, L.A., 2014. The distribution of Mg-spinel across the Moon and constraints on crustal origin. American Mineralogist, 99(10), pp.1893-1910.
[3] Mallat, S., 1999. A Wavelet Tour of Signal Processing. Elsevier.
[4] Chandrayaan-1 Moon Mineralogy Mapper Science Team (2011). M3 L1B Gridded Spectral Radiance, Version 3. PDS Cartography and Imaging Sciences Node. https://doi.org/10.17189/1520248.
[5] Chandrayaan-1 Moon Mineralogy Mapper Science Team (2011). L2 Gridded Spectral Reflectance (version 1) products. https://doi.org/10.17189/1520414.
[6] Backus, J., 1978. Can Programming be Liberated from the von Neumann Style? A Functional Style and its Algebra of Programs. Communications of the ACM, 21(8), pp.613-641.
[7] Suárez‐Valencia, J.E., Rossi, A.P., Zambon, F., Carli, C. and Nodjoumi, G., 2024. MoonIndex, an open‐source tool to generate spectral indexes for the moon from M3 data. Earth and Space Science, 11(6), p.e2023EA003464.
[8] Shkuratov, Y., Surkov, Y., Ivanov, M., Korokhin, V., Kaydash, V., Videen, G., Pieters, C. and Stankevich, D., 2019. Improved Chandrayaan-1 M3 data: A northwest portion of the Aristarchus Plateau and contiguous maria. Icarus, 321, pp.34-49.
[9] Bezanson, J., Karpinski, S., Shah, V.B. and Edelman, A., 2012. Julia: A Fast, Dynamic Language for Technical Computing. arXiv preprint arXiv:1209.5145.
How to cite: Eshbaugh, H., Shirley, K., Henderson, F., Habib, N., Belhadfa, E., Spry, R., Olsen, K., and Bowles, N.: MoonTools: A Framework for Hyperspectral Data Processing and Parameter Retrieval, Europlanet Science Congress 2026, The Hague, The Netherlands, 7–11 Sep 2026, EPSC2026-714, https://doi.org/10.5194/epsc2026-714, 2026.
Introduction
Europa’s surface is one of the youngest in the solar system, implying constant renewal due to endogenous processes linked to the presence of a global ocean of liquid water beneath its icy crust [1] and to the intense space weathering from the continuous bombardment by electrons and ions from Jupiter’s magnetosphere [2]. Understanding the surface composition is necessary to characterize the processes governing its evolution. Europa’s surface has been extensively studied by means of remote sensing data such as near-infrared spectroscopy. Many compounds such as hydrated sulfates, chlorinates and oxidants have been suggested and their spatial distributions were mapped [3,4,5]. In a previous work [6,7], multiple combinations of 3, 4 and 5 endmembers among a list of 15 relevant compounds suggested by previous studies were tested using a Bayesian MCMC approach combined with the Hapke model [8] on a single NIMS spectrum from a dark lineament of the trailing hemisphere.
Here, we evaluate an innovative sparse linear unmixing approach, which reduces the computation time to several seconds for this problem. This new method uses global optimization tools and accounts exactly for a sparsity constraint ( pseudonorm) while returning the full set of possible solutions, contrary to previous global optimization approaches that only estimate the best one [9, 10], although the global optimum alone is already significantly better than the solutions of other (inexact) sparse linear unmixing methods [11, 12, 13].
Dataset
In order to validate the method, we used the same dataset as in [6,7]. The target spectrum comes from the NIMS observation “e6e007ci’’ imaging a dark lineament of the Trailing Anti-Jovian hemisphere. Such a spectrum was initially selected in [6] as one of the darkest spectra of the NIMS dataset, with highly distorted water-ice bands, reflecting a surface composition significantly different from pure water ice, and therefore difficult to fit. The spectral library is also similar with the same 15 endmembers as in [6,7] and generated using the Hapke model from the initial optical constants as reported in [6], at the same observation geometry as the NIMS data, accounting for the spectral response of the instrument [14].
Method
We assume a linear mixture of the endmembers, under the abundance non-negativity constraint, the abundance sum-to-one constraint, and a sparsity constraint (few abundances are nonzero). The latter is enforced exactly (i.e., no relaxation) with a strict limitation of the l0 pseudonorm of the abundance vectors, making the optimization problem much harder, as it is essentially combinatorial. An abundance vector is said to be “acceptable” if its least-squares misfit falls below a threshold τ>0 depending on the noise level, as in [6].
A set of acceptable solutions is constructed using the Branch-and-Bound algorithm from [15] on the target spectra with the spectral library of 75 endmembers introduced above (15 compounds with 5 grain size each). This method provides the mathematically guaranteed exhaustive set of sparse and physically feasible solutions, by virtually enumerating all combinations, while requiring much lower computation time than exhaustive combinatorial enumeration, thanks to the pruning occuring in the Branch-and-Bound procedure. In addition, it can take into account a minimum abundance constraint, fixed here at 0.1 (e.g., an activated spectrum must have at least a 10% abundance value), which is usually very hard to enforce, yet it fits well in the Branch-and-Bound framework.
Results
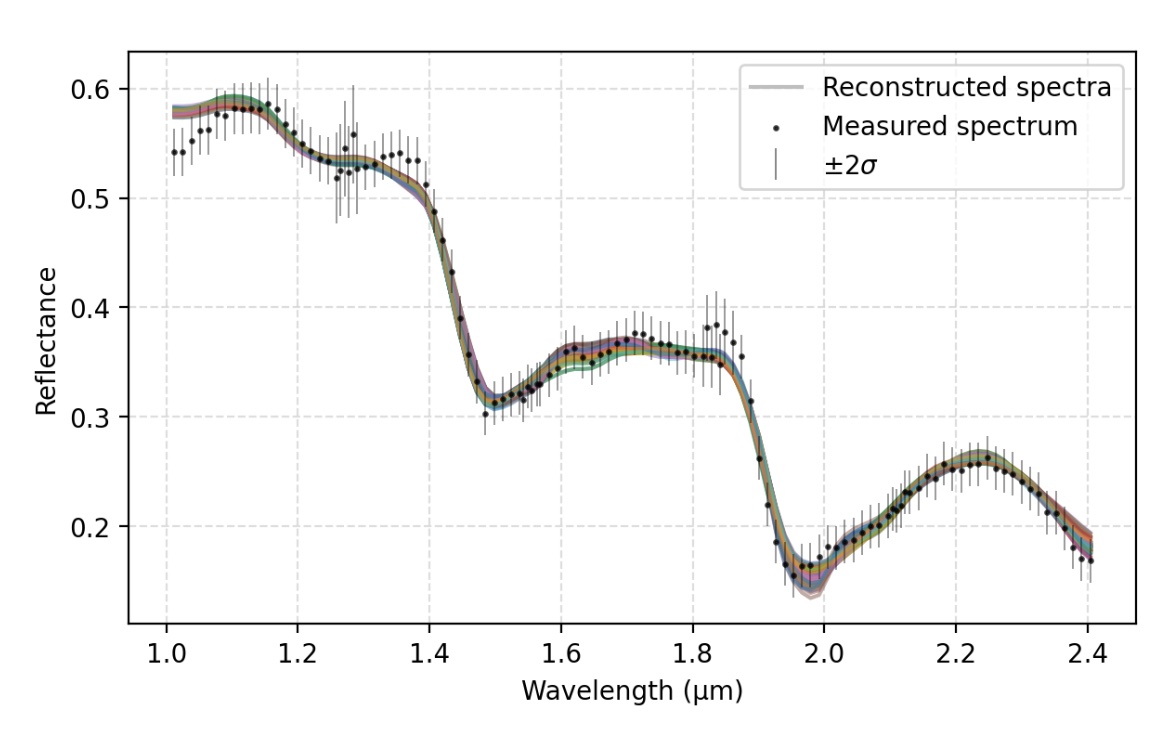
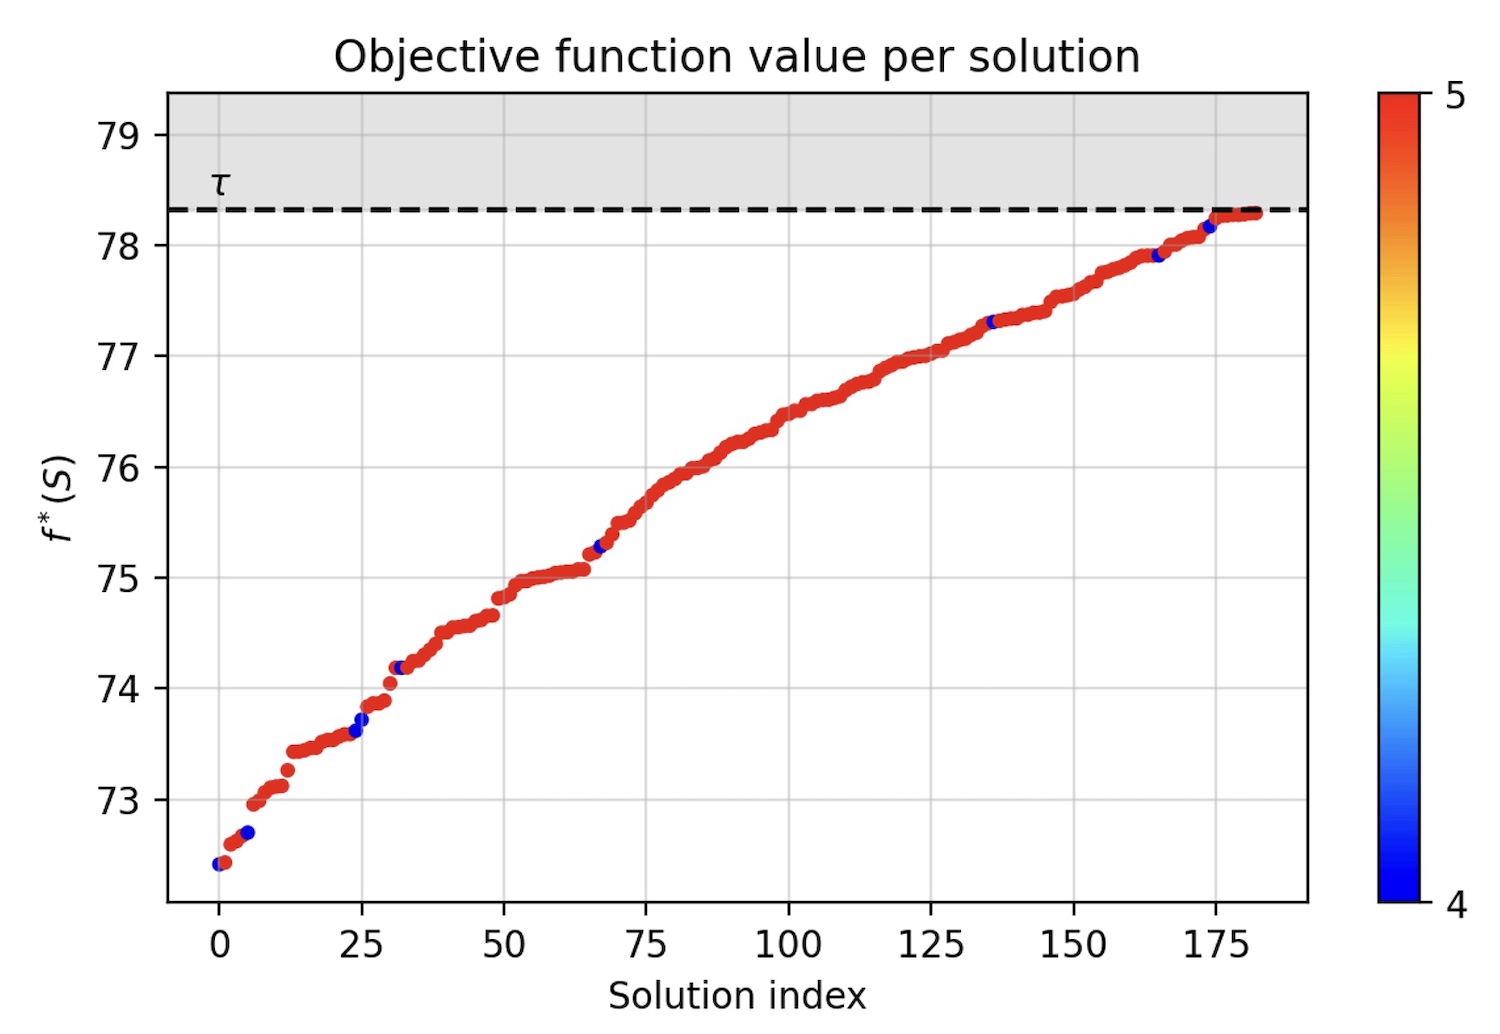
The Branch-and-Bound algorithm initially returns a set of 200 solutions compatible with the noise level, which is post-processed to remove the 17 solutions not complying with a group exclusivity constraint (structured sparsity), i.e., solutions activating two (or more) spectra of the same material but with different grain sizes. Therefore, the final solution set includes 183 acceptable solutions, as illustrated in Figures 1 and 2. These numbers are in close agreement with the respectively 21 and 153 solutions found by [6]. Remarkably, there is no solution with only 3 endmembers, as also determined by [6,7].
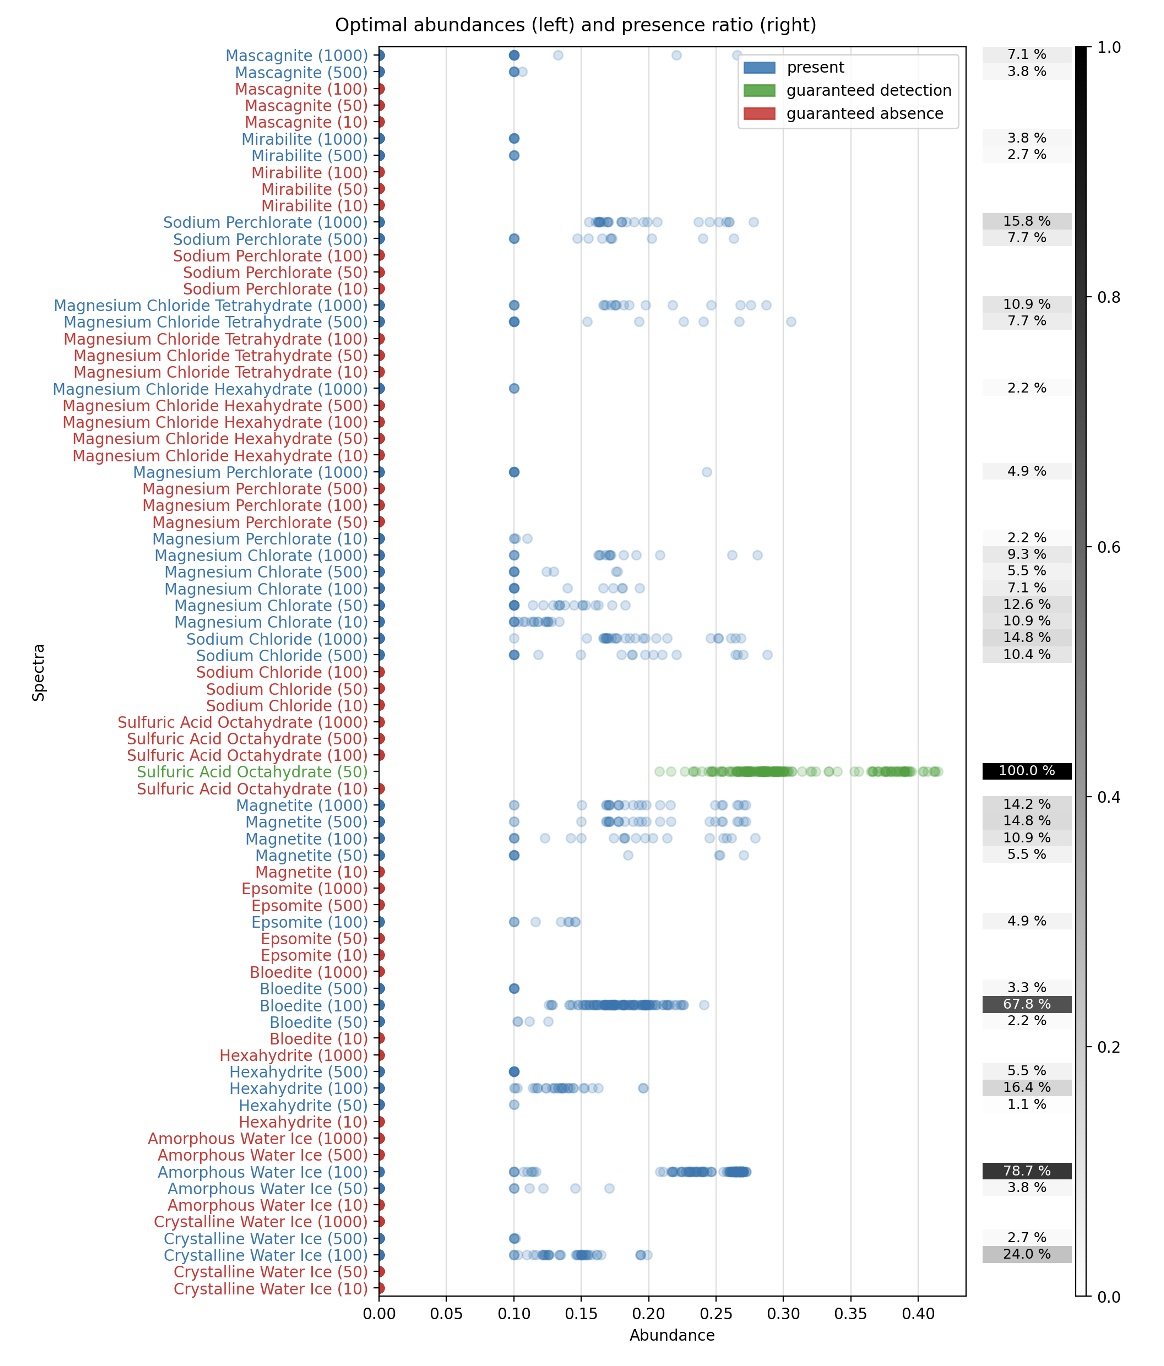
Figure 3 goes into deeper details about the solutions. Each dot represents one of the 183 returned compatible solutions. The percentage of activation of each endmember in the set of solutions is given on the right. Strikingly, Sulfur Acid Octahydrate (SAO) at 50µm grain size is the only one present in every solution, showing that this component is absolutely necessary to the fit.

Figure 1: 183 acceptable solutions spectra reconstructed versus the observation.

Figure 2: 183 acceptable solutions, sorted in increasing order of least-squares misfit. Most of them activate 5 endmembers, yet 9 acceptable solutions only activate 4.

Figure 3: results from our analysis with 15 endmembers at grain size 10, 50, 100, 500, 1000 µm. The only spectra that is always present is the sulfuric acid octahydrate.
Conclusion
The linear unmixing method presented in this work, with sparsity and grain size, shows a striking agreement with a much more elaborated physical modeling and Bayesian Monte Carlo inversion from previous work. We show that most of the results from [6] can be reproduced within seconds, compared to weeks previously. This method thus is ready to be used on larger datasets, such as hyperspectral cubes, where maps of presence/absence of components can be quickly and reliably produced.
References
[1] Pappalardo, R et al. (1999) JGR ; [2] Carlson, R. W. et al. (2005) Icar. ; [3] Ligier, N. et al. (2016) A.J. ; [4] King, O. et al. (2022) PSS. ; [5] Villanueva, G. et al. (2023) Science ; [6] Cruz-Mermy, G. et al. (2023) Icar ; [7] Cruz-Mermy, G. et al. (2025) Icar ; [8] Hapke, B. (2012) Camb. Univ. Press. [9] Ben Mhenni R., et al, 2018 WHISPERS; [10] Latif, M. et al., EUSIPCO 2025 [11] Greer J. B.; IEEE TIP, vol. 21, no. 1, 2012; [12] Akhtar, N. et al. IEEE TGRS, 53, 4, 2015. [13] Tuia, D.; et al. IEEE TGRS, 54, 11, 2016. [14] Carlson, R. et al. (1992) ed. C.T. Russel. [15] Foix-Colonier, et al. “Beyond Optimization: Multisolution Branch-and-Bound for Sparse Spectral Unmixing”, 2026 IEEE Signal Processsing (under review).
How to cite: Foix Colonier, N., Cruz Mermy, G., Schmidt, F., Andrieu, F., and Bourguignon, S.: Investigating the composition of Europa’s surface from NIMS data using exact sparse linear unmixing, Europlanet Science Congress 2026, The Hague, The Netherlands, 7–11 Sep 2026, EPSC2026-83, https://doi.org/10.5194/epsc2026-83, 2026.
Introduction
Our previous work proposed a two-stage spectral evolution for Ceres. During the early stage within 106 years, fresh materials on Ceres become spectrally blue, the 2.7 μm band strength weakens, and the band center shifts toward longer wavelength. Then the late-stage after 106 years is characterized by spectral reddening and band strengthening without the band center shift [1]. Based on these spectral characteristics, the flanks of the cryovolcanic dome Ahuna Mons on Ceres [2] can be divided into three spectrally distinct surface units (Fig. 1):
(1) Young: the 2.7 μm band center shifts to shorter wavelengths;
(2) Intermediate: an unshifted 2.7 μm band center and spectrally blue;
(3) Old: an unshifted 2.7 μm band center and spectrally red.
To test whether the physical properties of these units contribute to the observed spectral variations, we analyze their photometric and thermophysical properties.
Fig.1 (a) 2.7 μm absorption center map, (b) visible/near-infrared slope map, and (c) image of Ahuna Mons. The black, white and red ROIs indicate the three spectrally distinct units, corresponding to young, intermediate, and old units, respectively.
Photometric properties
We used all Framing Camera (FC) color images covering the Ahuna Mons region acquired during the Rotational Characterization 3 (RC3), Survey, High Altitude Mapping Orbit (HAMO), Low Altitude Mapping Orbit (LAMO), and Extended Mission Orbit (XMO) phases, with phase angles ranging from ∼5° to ∼85°. We adopted a five-parameter Hapke model [3]. The amplitude parameter (B0) and width parameter (h) of the shadow-hiding opposition effect are fixed since there are not sufficient data available at low phase angles [4]. The remaining three free parameters, including the single-scattering albedo, the asymmetry factor of the single-term Henyey-Greenstein function, and the roughness parameter, are fitted using a Bayesian approach Markov chain Monte Carlo. Preliminary results show that the single-scattering albedo and surface roughness appear to vary systematically with surface exposure age (Fig. 2).
Fig.2 Hapke model parameters of the three spectrally distinct surface units on Ahuna Mons. The B0 and h parameters are fixed to 1.6 and 0.06, respectively.
Thermophysical properties
The photometric analysis is further complemented by thermal modeling of the Ahuna Mons region. Surface temperatures are retrieved from Visible and Infrared Spectrometer (VIR) data in the infrared range dominated by thermal emission [5]. Ongoing work applies a thermophysical model to derive the thermal inertia and surface roughness parameters of the different units, which could also constrain their surface physical properties.
References. [1] Zhang, Q., & Li, J. Y. (2025). EPSC-DPS Joint Meeting 2025, EPSC-DPS2025-570. [2] Ruesch, O., et al. (2016). Science, 353(6303), aaf4286. [3] Hapke, B. (2012). Cambridge university press. [4] Li, J. Y., et al. (2019). Icarus, 322, 144-167. [5] Simon, A. A., et al. (2020). Science, 370(6517), eabc3522.
How to cite: Zhang, Q. and Li, J.-Y.: Physical properties of spectrally distinct surface units on Ceres, Europlanet Science Congress 2026, The Hague, The Netherlands, 7–11 Sep 2026, EPSC2026-924, https://doi.org/10.5194/epsc2026-924, 2026.
1. Introduction
The remote characterization of atmosphereless celestial bodies relies on understanding scattered sunlight. The Degree of Linear Polarization (DoLP) is a sensitive tool for analyzing the physical properties of granular soils [1]. However, interpreting these polarization curves is complicated by two main factors: the difference between opaque surface scattering (e.g., in rocks) and semi-transparent volume scattering (e.g., in glasses) across various wavelengths [2], and the discrepancy between mechanical sieve sizes and true optical scattering behavior [3]. This study investigates the optical behavior of crushed planetary simulants by combining multi-wavelength laboratory polarimetry with Principal Component Analysis (PCA). The goal is to objectively separate how material composition and grain size influence on shape of polarization phase curves.
2. Laboratory Measurements and Curve Fitting
Laboratory polarimetry was conducted on samples of crystalline basalt and amorphous glass. The samples were mechanically separated into three sieve bins (<32μm,32–63μm,63–125μm). Measurements were taken using standard narrow-band visible filters (U,B,V,R,I) and an unfiltered broadband setting to capture wavelength-dependent scattering changes. The experimental setup used an emission angle of 45°. The azimuth angle was kept close to 0°, making off-plane scattering effects negligible for these measurements.
To extract physical parameters from the data, the DoLP phase curves were fitted to an empirical trigonometric model [4]. Because laboratory instruments can introduce a slight offset, an instrumental bias parameter (𝐸) was added to the equation. This ensures the model accurately captures the amplitude of the curve (𝐴) and the inversion angle (𝛼inv): DoLP(𝛼)=𝐴⋅sin𝐵(𝛼)⋅cos𝐶(𝛼/2)⋅sin(𝛼−𝛼inv)+𝐸

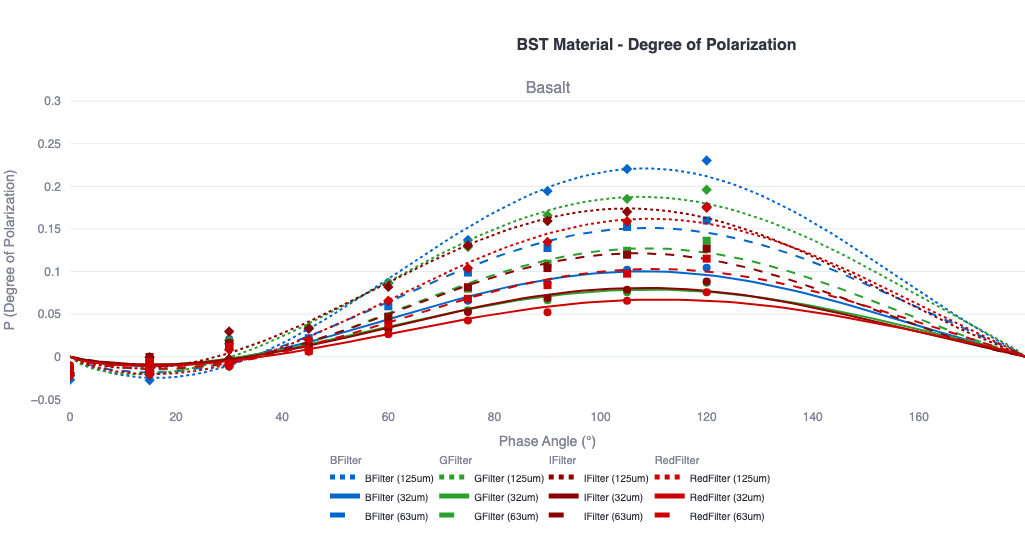
Figure 1: Measured and fitted DoLP phase curves for the Basalt (BST) samples across different filters and grain sizes.

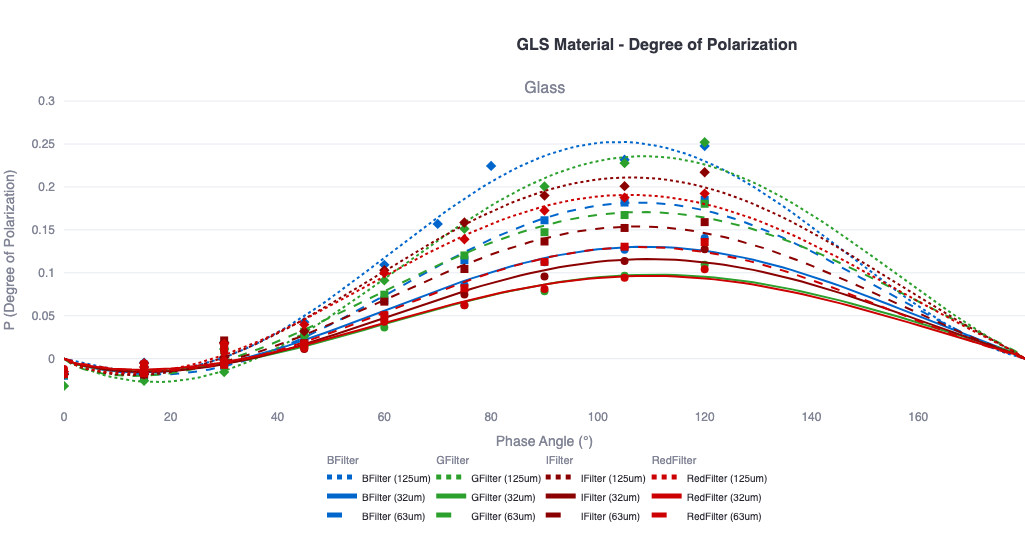
Figure 2: Measured and fitted DoLP phase curves for the Glass (GLS) samples across different filters and grain sizes.
3. Principal Component Analysis
To find natural groupings in the data, the fitted parameters (𝐴, 𝐵, 𝐶, 𝛼inv,𝛼max,Pmax) from each measurement were used as input features for a Principal Component Analysis (PCA). This allows for a clear visualization of how the curves change depending on material type, wavelength, and sieve size, without relying on theoretical scattering assumptions like the Lorenz-Mie theory.
The PCA results show that the first principal component (PC1) contains the most significant variance in the dataset and correlates strongly with grain size (Figure 3). In the PCA space, the largest particles (125μm) group on one side, while the finest particles (32μm) distribute on the opposite side. This clear separation along the primary axis suggests that the size parameter of the particles plays a dominant role [5]. We can explain this physically through the scattering mechanism: larger, darker grains absorb penetrating light, ensuring the escaping light is dominated by highly polarized single-surface reflections. Conversely, finer dust creates a brighter, highly reflective powder bed that promotes multiple scattering events between grains. These multiple bounces effectively scramble and depolarize the light, lowering the overall amplitude of the phase curve [3].
Figure 3: 2D PCA projection of the phase curve parameters, with colors representing the three grain size bins.
Furthermore, the PCA visualizes a clear difference between the two materials (Figure 4). The crystalline basalt samples group relatively closely together across all wavelengths, indicating a stable scattering regime dominated by opaque surface reflection. In contrast, the amorphous glass samples spread much wider across the PCA space. For the glass samples, longer wavelengths (such as the R and I bands)penetrate deeper into the particles. This causes a shift from surface reflection to internal volume scattering, which depolarizes the light and significantly alters the shape of the phase curve [2].
Figure 4: 2D PCA projection of the phase curve parameters, with colors representing the two materials: basalt and glass.
The effect of the wavelength is shown in the filter-specific projection (Figure 5). The data do not cluster neatly by color, which suggests that the wavelength affects the two materials differently. When comparing this plot with the material groupings in Figure 4, it appears that basalt remains relatively stable across all filters because it is consistently opaque. In contrast, the wider spread of data points belongs to the glass samples measured at longer wavelengths (such as the R and I filters), where the light can penetrate the particles and cause internal scattering. This indicates that multi-wavelength measurements are necessary, as longer wavelengths help reveal the internal structure of semi-transparent materials.
Figure 5: 2D PCA projection of the phase curve parameters, with colors representing the different wavelength filters.
4. Conclusions
This analysis demonstrates that the polarization of granular soils is driven by an interplay of grain size, material opacity, and incident wavelength. The PCA visualization successfully separates the effects of opaque surface scattering from depolarizing volume scattering. The strong correlation betweenPC1 and grain size highlights the importance of the particle size parameter in interpreting the overall amplitude of these curves. Crucially, the data shows that wavelength does not affect all materials equally. While opaque rocks (basalt) remain stable across different filters, semi-transparent materials (glass) undergo a wavelength-dependent transition into internal volume scattering. Therefore, multi-wavelength polarimetry is strictly necessary to accurately identify the amorphous vs. crystalline nature of planetary surface materials, as single-wavelength observations cannot distinguish between these fundamentally different scattering behaviors.
Bibliography
[1] C. H. L. Patty et al., “Polarimetry in Planetary Sciences and Astronomy.” https://arxiv.org/abs/2604.08975
[2] L. Kolokolova, J. Hough, and A.-C. Levasseur-Regourd, Polarimetry of Stars and Planetary Systems, Cambridge University Press, 2015, pp. 11–144.
[3] M. Min, J. W. Hovenier, and A. Koter, “Modeling optical properties of cosmic dust grains using a distribution of hollow spheres,” A&A, 2005, 10.1051/0004-6361:20041920.
[4] B. Goidet-Devel, J. Renard, and A. Levasseur-Regourd, “Polarization of asteroids. Synthetic curves and characteristic parameters,” PASS, 1995, 10.1016/0032-0633(94)00140-M.
[5] I. G. Shkuratov and N. Opanasenko, “Polarimetric and photometric properties of the moon: Telescope observation and laboratory simulation 2. The positive polarization,” Icarus, 1992, 10.1016/0019-1035(92)90161-Y.
How to cite: Arnaut, M., Kakade, S., and Wöhler, C.: Disentangling Composition and Grain Size Effects in PlanetaryAnalogs: A Multi-Wavelength Polarimetric Analysis, Europlanet Science Congress 2026, The Hague, The Netherlands, 7–11 Sep 2026, EPSC2026-1062, https://doi.org/10.5194/epsc2026-1062, 2026.
Please decide on your access
Please use the buttons below to download the supplementary material or to visit the external website where the presentation is linked. Regarding the external link, please note that Copernicus Meetings cannot accept any liability for the content and the website you will visit.
Forward to presentation link
You are going to open an external link to the presentation as indicated by the authors. Copernicus Meetings cannot accept any liability for the content and the website you will visit.
We are sorry, but presentations are only available for conference attendees. Please register for the conference first. Thank you.
We present a reproducible, open-source photometric analysis pipeline for asteroid (4) Vesta developed using the complete NASA Dawn Framing Camera 2 dataset spanning four mission phases of Rotational Characterization (RC), Survey, High Altitude Mapping Orbit (HAMO), and Low Altitude Mapping Orbit (LAMO) comprising a vast photometric geometry observations. The pipeline integrates SPICE-based ray tracing against a Vesta ellipsoid surface model, per-pixel radiometric calibration to dimensionless I/F reflectance, and a DuckDB-powered columnar data lake architecture. We implement and validate a hierarchical photometric model sequence following Li et al. (2013) and Schröder et al. (2013). Disk-resolved Minnaert analysis using pixel-level RC approach-phase data yields limb-darkening parameters k0 and the phase-dependent albedo A consistent with published Vesta values within measurement uncertainty. For disk-resolved Hapke model fitting is done to combined Survey and RC phase curve data covering phase angles from approximately 8 to 80 degrees yields physical scattering parameters including single scattering albedo, Henyey-Greenstein asymmetry, opposition surge amplitude and width, and macroscopic roughness. Bayesian MCMC sampling using emcee provides full posterior distributions and parameter correlations, enabling rigorous comparison to published Vesta photometry and detection of phase-dependent residuals that motivate physics-informed neural network (PINNs) acceleration of parameter retrieval. The robust pipeline is designed as a general planetary photometry framework with a configurable body and instrument layer, enabling direct adaptation to the upcoming NASA Psyche mission and to other airless bodies including Ceres and icy moons. All code, data provenance records, and reproducibility artifacts are archived in Github.
How to cite: Mukherjee, K.: A Production-Grade Scalable Photometric Pipeline for Asteroid (4) Vesta Using NASA Dawn Framing Camera Data: Disk-Resolved and Disk-Integrated Hapke Parameter Retrieval Across the Approach Data phase., Europlanet Science Congress 2026, The Hague, The Netherlands, 7–11 Sep 2026, EPSC2026-1218, https://doi.org/10.5194/epsc2026-1218, 2026.
Introduction
Radiative transfer describes the interactions between light and matter. In the planetary surfaces field, most data comes from remote sensing instruments such as spectrometers or imaging spectrometers. Modeling the interactions at the surface is thus mandatory to better understand them. Particularly, when studying the spectro-photometric behavior of planetary surfaces, the most used model is the B. Hake model [1], because of its simple analytical form and its ability to correctly reproduce the behavior of most surfaces. One major limitation of this model is that it assumes a semi infinite homogeneous surface. In this work, we address this issue, by providing a new simpla analytical expression for the reflectance of a planetary surface that is constituted of two layers separated by interfaces. It can be applied to a translucent slab overlaying any other kind of surface as seen on Mars for example, or to a layer of fine grained ice (space weathered) overlaying a coarser more protected layer, such asexpected on icy moons. This model is an improvement from a previous formulation [2], that could only represent a slab over a granular medium.
Model
The model is described in the Figure 1. The surface is illuminated both by collimated and diffuse radiation. The collimated radiation can be from the Sun or an active instrument such as a laser altimeter, and diffuse radiation can come from the atmosphere (clouds, aerosols). We consider the two-stream approximation inside the surface.

Figure 1. Description of the various fluxes and quantities involved inside the different media. Our model supposes a bilayered material illuminated from the top by collimated source J0 and diffuse isotropic illumination I0. The incidence angle of the collimated source J0 in medium 0 is noted μ0 (respectively μ1 and μ2 for medium 1 and 2). Through the propagation in the media, the collimated source is noted J1 in medium 1 and J2 in medium 2. For granular material, all reflection coefficients rFx, Sx are 0. For slab compact media with interfaces, those coefficients can be computed using the Fresnel law. Our model solve the two-stream approximation of the diffuse intensities I, and in particular the outward flux at the top to estimate the reflectance of this complex bilayered material.
This formulation of the problem allow us to couple the medium 1 and 2 with internal and external reflections, that was not possible with our previous model [2], making it suitable for any kind of 2 layer surface.
Solution
The resolution of the radiative transfer under the two-stream approximation is conducted with the same methodology as Hapke [1] , and similarity relations are used to take the anisotropy of scatterers into account. Inside medium 1 or 2 (see Fig. 1), the radiative transfer equation can be integrated over the upward and downward solid angles, giving two differential equations:
where ω is the single-scattering albedo, I↑ is the upward flux, I↓ the downward flux and F(𝜏) is the source function at optical thickness 𝜏. The solution of these differential equations has a known general form, with 4 unknown integration constants, that are determined using the following boundary conditions:
- When 𝜏 → ∞, I3 and I4 must remain finite
- At 𝜏 = 𝜏1 , we apply the continuity rules for upward and downward streams and consider that all that is left of the collimated radiation inside the medium 1 is either transmitted to medium 2 or reflected back according to Fresnel's reflection coefficient. We also approximate that what is reflected upward can be accounted as diffuse upward radiation and thus be included in I1.
- At 𝜏 = 0, we apply the continuity rules for I0 and I1 and I2.
These boundary conditions are extended from [1,3]. In our case, reflections at the interfaces are considered.
The first boundary condition imposes one out of the 4 unknown integration constants to be 0, and the other two gives three equations, yielding a linear system of three equations with three unknowns that can be readily solved.
Discussion
Singularities:
The resulting expression for the reflectance contains several “0/0” singularities. These singularities have no physical basis and must have a finite limit. They already existed in the granular monolayer version of the two-stream resolution [1] and the granular over granular resolution [3]. Despite great efforts, we could not reformulate the expression into one that did not contain such singularities. We chose to find the analytical limits around them using Mathematica, and expectedly found a finite limit for the twelve identified singularities.
Comparison with ray-tracing and photometric behavior:
We compared this new analytical formulation with a recently developed monte-carlo radiative transfer model [4], in the case of a thick slab of water ice at wavelenght 1 µm. Fig. 2 shows the photometric behavior of TARTATIN compared to WARPE [4]. The various reflection coefficients are computed considering the optical indexes of water at 1 µm (real part n=1.30, imaginary part κ=1.27.10-6 from [5]). A good agreement between both models is found, within a few percent, which is expected. Indeed, the two-stream approximation is known to produce errors up to 5% [1]. The observed behavior, with maximum radiance factor around emergence 60°, is mainly due to the refraction of rays going from medium 1 (ice) to medium 0 (air). Interestingly, this photometric effect increases significantly with ω1.
Figure 2: Angular dependency of the radiance factor (I/F), for TARTATIN (line) and monte carlo ray tracing algorithms WARPE [4] (crosses).
Conclusion
We present TARTATiN, a simple analytical formulation of the reflectance of a two-layer plnetary surface. Only a few parameters are needed to describe the reflectance, using parametrizations to convert compositions and grain-sizes inside the media into optical quantities, such as developed in [2]. The method’s precision is estimated at a few percent, which is inherent to the energy conservation of the two-stream approximation and numerical constraints. A key advantage of this model is its fully analytical nature, enabling extremely fast numerical implementation.
Raferences:
[1] Hapke, Cambridge University Press, 2012
[2] Andrieu et al., Applied Optics, 2015
[3] Johnson et al., Icarus, 2004
[4] Barron et al., JQSRT, 2025
[5] Schmitt, et al., 1998
How to cite: Andrieu, F. and Schmidt, F.: TARTATIN: an analytical radiative transfer model for layered planetary surfaces with interfaces, Europlanet Science Congress 2026, The Hague, The Netherlands, 7–11 Sep 2026, EPSC2026-79, https://doi.org/10.5194/epsc2026-79, 2026.
archnemesis is a modern Python reimplementation (the original is FORTRAN based) of the widely used NEMESIS radiative transfer and retrieval code. While scientifically robust, the original workflow for handling spectral line data relied on a collection of external helper programs to convert line database outputs into formats readable by NEMESIS. This approach posed both usability and maintenance challenges.
As part of the ongoing development of ArchNEMESIS, we have focused on redesigning the handling of spectral line, continuum, and partition function data to be more flexible, transparent, and performant. Our initial approach leveraged existing APIs provided by major spectroscopic databases, such as the HITRAN API (HAPI), enabling direct programmatic access to line data. Although functional, this method incurred significant performance costs due to repeated parsing and conversion of text-based line list formats.
To address these limitations, we have developed a unified, HDF5-based data format designed for efficient storage and rapid access to spectroscopic inputs. This format supports line data, continua, and partition functions within a single, self-describing structure. Accompanying this, we introduce a dedicated helper tool that simplifies the construction, modification, and maintenance of these HDF5 files, including automated ingestion of data from common spectroscopic databases.
We present ongoing work to accelerate line-by-line calculations within ArchNEMESIS using just-in-time compilation tools such as Numba. Together, the performace plus usability improvements will hopefully lead to easier and more efficient analysis of planetary spectra.
How to cite: Dobinson, J., Alday, J., Penn, J., and Irwin, P.: Spectral Line Handling in the ArchNEMESIS Radiative Transfer Modelling Tool, Europlanet Science Congress 2026, The Hague, The Netherlands, 7–11 Sep 2026, EPSC2026-125, https://doi.org/10.5194/epsc2026-125, 2026.
The Hayabusa2 International Visibility Enhancement Project is engaged in activities to ensure that the scientific data returned by JAXA's Hayabusa2 mission are openly disclosed and accessible to both professional researchers and the general public. The observation data of the near-Earth asteroid (162173) Ryugu acquired by the Hayabusa2 onboard instruments are publicly available through JAXA's Data Archives and Transmission System (DARTS) and NASA's Planetary Data System (PDS). To facilitate intuitive access to these archives, we have developed the JAXA Asteroid Data Explorer 2 (JADE2; https://jade2.darts.isas.jaxa.jp/), a web-based platform that allows users to search and visualize data from the Hayabusa2 instruments without prior expertise in mission data formats. The first version of JADE2 was publicly released in 2025. Here we present the major updates introduced in the January 2026 release.
The initial JADE2 release incorporated data from the Optical Navigation Camera (ONC), the Near-Infrared Spectrometer (NIRS3), the Thermal Infrared Imager (TIR), the Light Detection and Ranging instrument (LIDAR), and the Mobile Asteroid Surface Scout (MASCOT) lander. Detailed descriptions of each instrument and product level are provided in the corresponding Software Interface Specifications (SIS) documents and references therein. In the January 2026 update, we have added several higher-level products: the ONC I/F and reflectance Mosaic Maps (L3dm, L3drm, L3em, L3erm), and the NIRS3 thermal-removed reflectance spectra (L2D). New datasets are also provided in GIS-compatible formats (GeoTIFF, GeoPackage) that can be readily ingested into applications such as QGIS and ArcGIS. Additional content includes new global basemap datasets covering a range of illumination conditions and spatial resolutions, new color maps designed to enhance spectral and topographic features, and high-resolution 3D models of the touchdown site and of the Small Carry-on Impactor (SCI) crater before and after its formation.
The January 2026 update also introduces new viewing functions for LIDAR 3D data, interactive adjustment of colormap hues, and improved rendering of 3D models. For the Hayabusa2 trajectory display, we have added a spacecraft-perspective view frame and a blinking-light indicator synchronized with the observation timing of each instrument, allowing users to intuitively follow the mission's operations along the timeline.
JADE2 enables users to search and visualize data from multiple Hayabusa2 instruments through a single interface. In the near future, we plan to incorporate data from additional instruments such as DCAM3 and the MINERVA-II rovers, as well as further higher-level products. We are also exploring the extension of JADE2 to the upcoming targets of the Hayabusa2 extended mission and to other planetary missions, with the long-term goal of providing a unified data-exploration platform for small-body science.
Acknowledgements. This work is supported by the JAXA Hayabusa2 International Visibility Enhancement Project. The data served by JADE2 are available from DARTS (https://darts.isas.jaxa.jp/).
How to cite: Tatsumi, E., Ichikawa, M., Yokota, Y., Shoji, D., Honda, K., Yamamoto, M., Murakami, S., Nagai, Y., Wargnier, A., and Sato, H.: JADE2: a system for the search and visualization of Hayabusa2 scientific data (updates in 2026), Europlanet Science Congress 2026, The Hague, The Netherlands, 7–11 Sep 2026, EPSC2026-463, https://doi.org/10.5194/epsc2026-463, 2026.
The lunar south polar region is a prime target for future robotic and human exploration due to its scientific potential, proximity to permanently shadowed regions that may host volatile deposits, and strategic relevance for sustained surface operations. However, terrain characterization in this environment remains fundamentally challenging. Persistent low solar elevations, extreme local topography, strong shadowing, and pronounced photometric ambiguities complicate conventional orbital terrain reconstruction methods, particularly where accurate topographic information is required at hazard-relevant scales. These limitations are especially critical for landing site assessment, traverse planning, and operational risk analysis, where deterministic terrain products without associated confidence estimates may be misleading. High-resolution topographic mapping in this environment therefore requires not only enhanced spatial detail, but also physically meaningful uncertainty quantification.

Figure 1 - Multi-angular LROC NAC observations of the Malapert study region acquired under differing illumination and viewing geometries, used as input to the inversion framework.
Here we present a preliminary application of a multi-angular reflectance-constrained inversion framework for uncertainty-aware joint reconstruction of lunar topography and surface reflectance in the Malapert region near the lunar south pole. Malapert provides a compelling test case due to its rugged terrain, challenging illumination environment, and broader relevance to south polar exploration concepts. The analysis combines five Lunar Reconnaissance Orbiter Narrow Angle Camera (LROC NAC) observations (figure 1) acquired under differing illumination and viewing geometries with a substantially coarser reference digital elevation model providing long-wavelength topographic constraints. Surface reflectance is represented using a non-Lambertian Ross–Thick Li–Sparse (RTLS) bidirectional reflectance formulation, allowing anisotropic regolith scattering behaviour to be explicitly incorporated into the inversion. This is particularly important in polar environments, where simplified Lambertian assumptions can introduce systematic biases under extreme illumination geometries.

Figure 2 - Comparison between the reconstructed super-resolution topography (left, 1.63 m/pixel) and the lower-resolution reference topographic model (right) providing long-wavelength constraints.
The inversion reconstructs topography at 1.63 m/pixel resolution (figure 2) while simultaneously estimating spatially varying reflectance parameters and associated uncertainty products (figure 3).

Figure 3 - Retrieved spatially varying RTLS reflectance kernel parameters (kG, kL, and kV) estimated jointly with the topographic reconstruction.
In addition to the reconstructed digital elevation model, we derive slopes (figure 4) uncertainty maps for both elevation and local slope estimates, with slope uncertainty evaluated over a 3.5 × 3.5 m footprint (figure 5) relevant to hazard-scale terrain assessment. The resulting reconstruction resolves fine-scale morphological structure beyond the scale of the long-wavelength reference terrain model, recovering metre-scale terrain variability inaccessible to the prior constraint alone. One-dimensional slope transects extracted across representative terrain further illustrate the sensitivity of local slope characterization to fine-scale morphology and emphasize the importance of resolution enhancement for exploration-relevant terrain analysis.

Figure 4 - Reconstructed local slope map of the Malapert study region in degrees, highlighting fine-scale terrain variability relevant to hazard-scale analysis.
Preliminary results demonstrate that uncertainty-aware terrain reconstruction is feasible even under the challenging illumination conditions characteristic of lunar south polar orbital imaging. Spatial uncertainty products distinguish well-constrained terrain from regions where reconstruction confidence is reduced due to weak illumination, limited angular diversity, or reduced photometric sensitivity. This distinction is scientifically and operationally important, as it enables terrain products to be interpreted with explicit awareness of confidence limitations rather than as uniformly reliable deterministic solutions. In parallel, retrieved reflectance parameter maps capture spatial variability in surface photometric behaviour, providing complementary information on surface scattering properties. Comparison of photometric residuals between simplified Lambertian assumptions and the RTLS formulation further highlights the importance of physically realistic reflectance modelling in this environment, demonstrating improved consistency in the inversion when anisotropic scattering is explicitly represented.

Figure 5 - Uncertainty products and terrain profiling: elevation uncertainty (top left), slope uncertainty evaluated over a 3.5 × 3.5 m footprint (top right), and representative one-dimensional slope profile across the reconstructed terrain (bottom).
Beyond the present LRO-based demonstration, this study directly illustrates the scientific rationale behind ESA’s proposed Máni mission, whose dedicated multi-angular acquisition strategy is specifically designed to improve high-resolution, uncertainty-aware lunar terrain characterization. The present analysis effectively serves as a proof-of-concept using existing orbital data for the observational philosophy that Máni is intended to optimize. South polar applications represent a particularly compelling use case for this approach, where improved characterization of slopes, roughness, and illumination-sensitive terrain could directly support exploration planning while simultaneously enabling new investigations into lunar surface evolution and surface processes under persistent low-illumination conditions.
How to cite: Fernandes, I., Mosegaard, K., and Schmidt, F.: Uncertainty-Aware Super-Resolution Topographic and Reflectance Reconstruction of Lunar South Polar Terrain: A Preliminary Malapert Case Study, Europlanet Science Congress 2026, The Hague, The Netherlands, 7–11 Sep 2026, EPSC2026-731, https://doi.org/10.5194/epsc2026-731, 2026.
There are currently several missions in cruise phase and planned, operating a radar for sub-surface imaging to celestial bodies (e.g. RIME on JUICE or JURA on HERA/Juventas). The radar has a much wider field-of-view than e.g. a laser altimeter, which is also influenced by the radiation pattern of the antenna. Said pattern varies with angular direction as well as over frequency, both in amplitude and phase. Additionally, the trajectory of the spacecraft carrying the radar may cause imaging under sub-optimal conditions with nadir pointing off-axis w.r.t. the line spacecraft to center of observed body.
Forward simulations indicate an influence of the radiation pattern of the transmit and receive antenna on the results. In simulations, a theoretical reference of an isotropic radiation pattern can be assumed, enabling comparison with processing of radar data with the radiation pattern accounted for. Since the radiation pattern adds an additional phase shift, which changes over frequency, the inverse Fourier transform places reflections at slightly different distances than they actually are. This causes imperfect additions in e.g. back-projection image forming algorithms and consequently less contrast or even false targets.
The naive approach of compensating the antenna radiation pattern is to determine the direction between the antenna and the point of reconstruction, retrieving an (interpolated) complex-valued spectrum of the radiation pattern in that direction and dividing the received spectrum by the antenna spectrum. In case of a bi-static radar, both the transmit and receive antenna radiation patterns are different and need to be accounted for. For a mono-static radar, both patterns and directions are identical, slightly reducing complexity. Besides computational complexity, adequate knowledge of the radiation pattern and antenna’s (or spacecraft’s) attitude are required inputs for the compensation.
Using simulations (antenna radiation pattern, forward radar simulations of a simplified scenario), we will show the benefit of compensating the radiation pattern of a radar’s antenna radiation pattern on the quality of reconstructed image. Furthermore, we will try to include actual results from SHARAD, pending availability of a sufficiently accurate radiation pattern.
How to cite: Jenning, M. and Plettemeier, D.: Antenna Pattern Compensation in Radar Image Reconstruction, Europlanet Science Congress 2026, The Hague, The Netherlands, 7–11 Sep 2026, EPSC2026-765, https://doi.org/10.5194/epsc2026-765, 2026.
Atmospheric correction of hyperspectral images is critical in geology because accurate retrieval of surface reflectance is necessary to identify diagnostic mineral absorption features and interpret geological units. Several atmospheric correction methods have been developed for terrestrial and planetary applications; however, comparisons between Earth and Mars-oriented approaches remain limited despite the similar radiative challenges being encountered in arid volcanic terrain. Environments dominated by dark basaltic surfaces, bright evaporite deposits, strong topographic contrasts, mineral aerosols, and limited or missing vegetation challenge many of the assumptions commonly used in operational hyperspectral processing chains. These assumptions include the Lambertian surface approximation and vegetation-based aerosol retrieval strategies.
This study presents a comparative analysis of atmospheric and photometric correction methods for hyperspectral data acquired over analog volcanic landscapes on Earth and Mars. The terrestrial component focuses on EnMAP Level-1C images of the Asal-Ghoubbet rift in Djibouti. The Martian component examines CRISM observations of Jezero Crater and related volcanic terrain. We aim to examine how atmospheric composition, aerosol properties, surface anisotropy, and photometric assumptions influence the retrieval of bidirectional reflectance, spectral fidelity, and mineralogical interpretation.
The Asal-Ghoubbet rift presents challenges as a terrestrial test site due to its combination of very dark basaltic lava flows, highly reflective evaporite deposits, steep fault escarpments, high atmospheric water vapor content, and moderate desert aerosol concentration. The absence of dense vegetation further complicates aerosol retrieval strategies commonly used in operational terrestrial processing chains. Similarly, the Martian volcanic terrains investigated in this study feature dark mafic surfaces, altered dusty deposits, strong topographic variations, and an atmosphere dominated by suspended mineral aerosols within a thin CO2 envelope. In both terrestrial and Martian contexts, the combination of spectrally contrasting surfaces, anisotropic reflectance behavior, and aerosol scattering produces strong aerosol/surface coupling effects that complicate separating atmospheric and surface contributions in hyperspectral observations. Despite their environmental differences, Earth and Mars face similar challenges regarding radiative coupling between the atmosphere and the surface and satellite observation.
We compared several atmospheric correction strategies on EnMAP observations. They included physically based radiative transfer inversion using MODTRAN6 with ERA5 and CAMS atmospheric profiles; FLAASH; ISOFIT coupled with the sRTMnet emulator; ATCOR-S with and without topographic correction; the operational EnMAP Level-2A processor; and empirical approaches, such as QUAC, and dark-pixel correction methods. These strategies were compared with those applied to CRISM images, including dark-subtraction correction, spectral normalization using neutral regions, and the non-Lambertian MARS-ReCO framework. Unlike standard Lambertian approaches, the MARS-ReCO framework explicitly accounts for aerosol scattering and surface anisotropy by using CRISM multi-angular observations to retrieve the BRDF of the surface.
We evaluated the accuracy of the corrected reflectance products by comparing them with measurements from an ASD FieldSpec spectrometer and examining the stability of diagnostic absorption features and derived mineralogical maps. We paid particular attention to how uncertainties in atmospheric correction propagate into mineral mapping products and geological interpretations.
Preliminary results indicate that physically constrained and non-Lambertian approaches provide the most accurate spectral restitution over terrestrial and Martian volcanic landscapes. Conversely, empirical methods and Lambertian assumptions result in stronger spectral distortions in the shortwave infrared (SWIR) domain, especially over dark volcanic surfaces and highly reflective evaporites. A comparison of Earth and Mars underscores the pivotal role of aerosol/surface coupling and surface anisotropy in hyperspectral remote sensing. This comparison also demonstrates the importance of integrating photometric effects into atmospheric correction workflows for characterizing planetary surfaces.
How to cite: Langouet, R., Jacquemoud, S., Douté, S., and Marion, R.: Atmosphere/surface coupling in hyperspectral imaging of arid terrains: A comparison of atmospheric correction strategies from EnMAP (Earth) to CRISM (Mars), Europlanet Science Congress 2026, The Hague, The Netherlands, 7–11 Sep 2026, EPSC2026-923, https://doi.org/10.5194/epsc2026-923, 2026.
In the 2030s, several major missions are expected to take place to investigate the surface and interior of Venus including NASA’s VERITAS and ESA’s EnVision missions. While Venus is considered Earth’s twin and is our closest planetary neighbour in the Solar System, little is known about its surface composition. Due to its thick, permanent cloud cover, it was thought that only lander missions would be able to provide insights into the surface composition [1]. However, narrow atmospheric windows between 0.86 – 1.18µm in the CO2 cloud cover allow for the observation of its surface composition [1]. VERITAS’ VEM and Envision’s VenSpec-M will take advantage of these windows in order to provide the first near global surface composition maps of Venus, with the ability to distinguish between felsic and mafic rock types [1].
In preparation for these missions, extensive work is being carried out on the spectroscopy of Venus analogues in the DLR’s Planetary Spectroscopy Lab (PSL). The PSL is equipped with an emissivity chamber capable of analysing emissivity spectra under Venus temperatures (~460 °C) and near-vacuum conditions (~0.7 mbar), allowing analogue samples to be studied under similar conditions to Venus’s surface [2]. The particulate nature of these samples means that their grain structure and porosity may allow the measured emissivity to be influenced not just by the surface, but also by material at depth within the sample. In order to better understand the emissivity measurements being taken in the laboratory it is beneficial to constrain the potential effects that transmission may have on derived emissivity spectra.
The measurement of transmission through particulate material is particularly difficult, due to the inherent mechanical instability of the samples [3] and the extreme sensitivity of the signal to sample thickness [3]. Conventional transmission measurements of particulate materials are typically performed using KBr pellets or by vacuum dispersion and electrostatic spraying techniques [4]. However, these methods alter the original morphology of the material, including its porosity and grain structure, which may significantly influence its optical behaviour.
To preserve the natural morphology and porosity of the samples, a purpose-built transmission cell for use within a Bruker Vertex 80v FTIR spectrometer has been developed. The cell allows particulate samples to be measured while maintaining their original structure and enables sample thicknesses to be varied between 0.5–5 mm, in increments of 0.5 mm.
Basalt and granite, representing the possible mafic and felsic compositional extremes of the surface of Venus [5], were ground and sieved into grain size fractions of <25, 25-63, 63-125 and 125-250µm. Transmission measurements were then takento investigate the effects of grain size, compositional mixing, and porosity. Comparisons between grain-size fractions within each rock type constrained grain-size effects, while mixtures of basaltic and granitic material were used to investigate compositional and morphological effects. Mixtures containing varying grain-size distributions were analysed to assess the role of porosity.
Hemispherical reflectance measurements in the near-infrared were also acquired for each sample under vacuum conditions using a modified gold-coated integrating hemisphere attached to a Bruker Vertex 80v spectrometer. Emissivity measurements will subsequently be carried out at the PSL under Venus surface temperature conditions and near-vacuum pressures. Finally, bulk porosity was estimated from surface porosity measurements derived using 3D imaging and height classification with a Keyence VHX-7100 digital microscope, enabling the effects of porosity in transmission and emissivity to be assessed.
The ultimate goal of this work is to derive an empirical relationship describing transmission as a function of depth within particulate materials, allowing the potential influence of subsurface transmission on emissivity measurements to be assessed. Initial results indicate that in pure quartz particulate samples (125-250µm), transmission in the NIR region occurred through sample depths up to 3mm. While quartz itself is highly transparent in the NIR region, these results suggest that transmission through the sample may significantly influence the measured emissivity signal in quartz samples, indicating that material at depth may contribute to laboratory emissivity measurements.
[1] Smreker et al 2022. VERITAS (Venus Emissivity, Radio Science, InSAR, Topography, and Spectroscopy): A Discovery Mission
[2] Maturilli et al 2019. The newly improved set-up at the Planetary Spectroscopy Laboratory (PSL)
[3] Gladimir et al 2019. Assessing the impact of porosity variations on the reflectance and transmittance of natural sands
[4] Kun 1993. Infrared-optical transmission and reflection measurements on loose powders
[5] Gilmore 2017. Venus Surface Composition Constrained by Observation and Experiment.
How to cite: Benaim, A., Adeli, S., Garland, S. P., Domac, A., Maturilli, A., and Plesa, A.-C.: The Effects of Transmission on Laboratory Emissivity Spectra – Preparation for Future ESA and NASA Missions to Venus, Europlanet Science Congress 2026, The Hague, The Netherlands, 7–11 Sep 2026, EPSC2026-960, https://doi.org/10.5194/epsc2026-960, 2026.
The Enfys infrared spectrometer for the ExoMars Rosalind Franklin rover mission will perform high-resolution (Δ𝜆/𝜆 > 100) reflectance spectroscopy over 0.9 – 2.5 μm to constrain the surface mineralogy and geological context of the rover landing site, traverse, and subsurface investigations [1, 2]. Enfys has a novel dual-photodiode and scanning linear-variable filter design. We present a component level model of Enfys, describing the spectroradiometric and thermal response of the photodiodes and optics. This model, or instrument transfer function, describes the conversion of scene radiance to noisy arbitrary digital numbers, accounting for component dependencies on thermal conditions across the nominal mission lifetime. We have implemented the model into an end-to-end software simulation, capable of physically modelling mission observation scenarios, to produce predictions of spectral signature signal-to-noise ratio across the environment and instrument observation parameter spaces.
Here we present results validating the model against Enfys calibration measurements, and illustrate the breadth of simulations that can be accomplished through the instrument and environment coupled simulation. We show results between sunrise and sunset at Oxia Planum for a variety of Solar Longitudes, for a variety of surface orientations relative to the rover pointing and mast height of 2 m. We’ve modelled the reflectance of materials representative of the iron oxides, mafic and clay mineralogy we can expect to encounter as well as calibration standards, by deriving single scattering albedos from laboratory measurements and Hapke modelling the bidirectional reflectance distribution functions [3]. We report results of expected photo-generated current and signal-to-noise ratios for these varying observation scenarios across the Enfys spectral range and operational thermal range, and discuss implications on the sensitivity limits of Enfys for spectral and photometric classification tasks.
[1] Vago, J. L et al, 2017, Astrobiology, 17(6-7), 471–510; [2] Grindrod, P. M. et al, 2025. EPSC-DPS2025-154; [3] Hapke, B., 2012. Theory of Reflectance and Emittance Spectroscopy, Cambridge University Press
How to cite: Stabbins, R., Gunn, M., Langstaff, D., Marsh, H., Langston, J., Hagan-Fellowes, S., Grindrod, P., and Cousins, C.: Simulating Enfys: End-to-End Surface Reflectance Spectroscopy Simulations of the Infrared Spectrometer for the ExoMars Rosalind Franklin Rover, Europlanet Science Congress 2026, The Hague, The Netherlands, 7–11 Sep 2026, EPSC2026-982, https://doi.org/10.5194/epsc2026-982, 2026.
Context
The Jupiter icy moons are the target of two major space missions in the next decade: The ESA JUICE [1] and NASA Europa Clipper [2] missions. The NASA Galileo spacecraft explored the Jupiter system between 1995 and 2003, and performed multiple encounters with Jupiter’s moons. Among the scientific instruments onboard Galileo operating during these encounters was the Near-Infrared Mapping Spectrometer instrument (NIMS), a complex imaging spectrometer working in the infrared domain, operating from 0.7 to 5.2 microns with 17 detectors [3]. To date, and despite challenges in its usage, the NIMS data remain a great resource of recent scientific research on the properties of Jupiter’s icy moons surfaces [e.g. 4-7] to prepare for the next explorers of the Jupiter system.
The Galileo NIMS data set
Galileo NIMS data are archived in the PDS as so-called “tubes” and “g-cubes” (or mosaics). We base our work on the g-cube products, where individual tubes are assembled in single mosaiced and geolocated products. G-cubes are available as products in radiance and radiance factor in the archive. Due to the varying distance and observing geometry of each targeted flyby in the Jupiter system, together with the own instrument operational settings and health, the dataset is very heterogenous in spatial, spectral, and angular resolution. Backplanes offer the possibility to easily extract the observation geometry per pixel, to be used in modeling spectral or photometric properties. Recent recalibrated NIMS data sets [e.g. 8, 9] are being studied to quantify differences with the original PDS archived NIMS data used in this work.
The NIMS database framework
We converted the Galileo/NIMS calibrated g-cube dataset into a relational SQL database. This framework allows to quickly select and extract radiance factors (I/F), radiance (I), geometry data, and metadata from the entire NIMS data set. The data that can be retrieved cover the NIMS observations of Jupiter, Io, Europa, Ganymede, and Callisto. Metadata extracted in the PDS3 labels regarding the individual observations are part of the database, together with calibration information and calibration data available from the g-cubes labels. The smallest element in the database is a spectrum (i.e. one pixel). Using SQL queries on this SQL database, and criteria based on the pixel viewing geometry (e.g. incidence, emission, phase, and azimuth) and the geographic pixel location (latitudes and longitudes on a given target), phase curves and/or collections of spectra can be easily retrieved from regions of interest. Individual g-cubes data can also be retrieved.
Making available the NIMS database to the community
We wish to make this framework available for the community interested in working with NIMS data. We recently integrated the framework within the ESA DataLabs platform [10], which provides a JupyterLab-based environment from which users will be able to easily access the database content using notebooks. A python package to perform predefined queries will also be part of the DataLab. Queries can be executed in the DataLab to extract the NIMS spectra to be analysed, and query results can be exported.
References
[1] Grasset et al., Plan Spac Sci 78, 1-21, 2013; [2] Howell and Pappalardo, Nat Commun 11, 1311, 2020 ; [3] Carlson et al., Space Science Reviews, 60, 457-502, 1992 ; [4] Mishra et al. The Planetary Science Journal, 2, 183, 2001 ; [5] Cruz Mermy et al., Icarus, 394, 115379, 2023 ; [6] Belgacem et al., Planetary Science Journal, 6:237, 2025 ; [7] Cruz Mermy et al., Icarus, 442, 2025 ; [8] Malaska et al., 2023a, PDART program, DOI:10.17189/4sq6-x165 ; [9] Malaska et al., 2023b, PDART program, DOI:10.17189/4sz4-5024 ; [10] Navarro et al., Space Data Management, 1-13, 2024.
How to cite: Cornet, T., Cruz Mermy, G., Andrieu, F., Belgacem, I., and Schmidt, F.: An SQL-based framework to work with Galileo/NIMS data, Europlanet Science Congress 2026, The Hague, The Netherlands, 7–11 Sep 2026, EPSC2026-1053, https://doi.org/10.5194/epsc2026-1053, 2026.
How to cite: Aye, K.-M., Walter, S., and Postberg, F.: Scaling a Fully Automatic CTX-to-HRSC Coregistration Pipeline using Phase-Correlation and (A)KAZE Feature Matching, Europlanet Science Congress 2026, The Hague, The Netherlands, 7–11 Sep 2026, EPSC2026-1123, https://doi.org/10.5194/epsc2026-1123, 2026.
Image simulation entails the generation of synthetic image data using detailed models of cameras and scenes, and light’s interaction with them. When these models are defined by physical rules (referred to as physically based rendering – PBR), images can be generated with very high levels of physical accuracy. Such images can be used to test camera capabilities and characterise the performance of image analysis algorithms, making PBR a valuable tool for the development and testing of planetary science and other spaceborne cameras.
The camera hardware and data processing/analysis pipelines of planetary science cameras require rigorous testing and validation to ensure correct performance. Given that spaceborne cameras will commonly operate at locations that have rarely or never been visited before, there is often minimal relevant existing image data available for use in camera development, particularly for novel imaging systems. Image simulation can support camera development in these cases by modelling camera performance and providing data on which to test processing or analysis techniques. Image simulation is fast, low cost and flexible, with all aspects of a simulated imaging scenario being controllable, from scene appearance to camera response. It can be used to predict the range of observation conditions (e.g. radiance distribution, shadowing) that a camera will encounter, to visualise the nature of a particular camera’s image data, or to test algorithm performance (such as stereo reconstruction accuracy).
SIMply (Python Image Simulator for Planetary Exploration) is an open source physically-based image simulator designed to make the benefits of image simulation widely available to researchers and engineers working on spaceborne imaging systems [1,2]. SIMply is designed with an emphasis on simplicity and accessibility – being free, open source, written in pure Python and compatible with standard computing setups. SIMply can be used to set up and render complex scenes with only a few lines of Python code, and the physical accuracy of its rendering pipeline is validated [1]. SIMply is built to be inherently flexible and extendable, making customisation such as bespoke cameras or surface reflectance models easy to implement. SIMply is therefore designed to be sustainable, enabling it to continually gain functionality over time in response to community needs.
SIMply can be used to simulate physically accurate images of a wide variety of planetary exploration scenes (from planets and moons to small bodies and artificial objects, see Fig 1). Rendering is performed using ray tracing and physical models of surface shape, spectral reflectance, spectral camera response, and imaging geometry. SIMply is currently supporting a variety of planetary surface imaging research. The tool can be accessed and downloaded at https://github.com/gbrydon/SIMply.

Fig 1. Various SIMply simulations. A) Simulated orbital image of Mars’ surface. B) Simulated colour image of the Moon with chromatic aberration. C) Simulated long-range image of comet 67P and background stars – with incorporation of external dust radiance model. D) Simulated image of a spacecraft during rendezvous and proximity operations. E) Side-by-side comparison of real (left) and simulated (right) Rosetta OSIRIS WAC images of comet 67P’s nucleus.
References
[1] Brydon G., Image simulation for camera development - Python Image Simulator for Planetary Exploration (SIMply). Space Science & Technology, 2025; [2] SIMply tool, https://github.com/gbrydon/SIMply;
How to cite: Brydon, G.: SIMply – an open source image simulation tool supporting the research and development of spaceborne imaging systems, Europlanet Science Congress 2026, The Hague, The Netherlands, 7–11 Sep 2026, EPSC2026-159, https://doi.org/10.5194/epsc2026-159, 2026.
Lunar swirls are bright-albedo areas on the surface of the Moon that appear to twist and turn across the surface. Multiple swirl formation processes have been hypothesized, including shielding from space weathering, i.e., small meteoroid impacts and charged particles from the Sun (e.g., Hood & Schubert, Sci 208, 49, 1980), dust accumulation and lofting (e.g., Garrick-Bethell et al., Icar 212, 480, 2011), and comet impacts (e.g., Bruck Syal & Schultz, Icar 257, 194, 2015). One approach to distinguish between the processes is to examine the structure of the regolith, the top layer of the surface, using photometric data, i.e., measuring the brightness of the surface at different viewing angles.
The current study focuses on two swirls: Reiner Gamma, centered at the lunar coordinates (7.5◦ N, 59.0◦ W), and Mare Ingenii, centered at (35.8◦ S, 161.8◦ E). Reiner Gamma is perhaps the best known of lunar swirls, whereas Mare Ingenii represents a multitude of swirls because it is located within both the darker maria and the brighter highlands. Studying Reiner Gamma and Mare Ingenii is useful not only for learning more about swirls and swirl formation processes but also for increasing understanding of the Moon as an atmosphereless object.
In the study presented here, we applied the fractional-Brownian-motion particulate-medium (fBm- PM) model (Parviainen & Muinonen, JQSRT 110, 1418, 2009; Wilkman et al. P&SS 118, 250, 2015; Björn et al., PSJ 5:260, 2024) to photometric data of the swirls to infer the physical properties of their regolith. The fBm-PM model describes a regolith with an fBm surface (Peitgen & Saupe, 1988), which accurately characterizes the surface roughness of an atmosphereless Solar System body. The model has three geometry parameters: the packing density, v, with values between 0.15 and 0.55; the fractal Hurst exponent, H, with values between 0.20 and 0.80; and the amplitude of height variation, sigma, with values between 0.00 and 0.10. The fBm-PM model was compared to photometric observations—the same data as in Weirich et al. (PSJ 4:212, 2023) for Reiner Gamma, and the same data as in Domingue et al. (GeoRL 49, e95285, 2022) for Mare Ingenii. By varying the geometry parameters, we were able to determine the parameter values that agreed best with the observations.
The results suggest that the regolith within the Reiner Gamma swirl is moderately densely packed (v ≈ 0.41) and has moderate horizontal surface roughness (H ≈ 0.60) and large vertical surface roughness (σ ≈ 0.10). A recent study using the same methods derived a similar surface roughness but a higher packing density (v ≈ 0.55) for the average regolith of Mercury (Björn et al., PSJ 5:260, 2024). Our ongoing analysis of Mare Ingenii allows to thoroughly examine two different swirls to infer which swirl formation processes are likely, and to compare lunar swirl regolith to the regolith of Mercury. Preliminary results suggest a regolith structure different from Reiner Gamma, including variations within the swirl itself.
How to cite: Björn, V., Muinonen, K., Penttilä, A., Domingue, D., Weirich, J., Chuang, F., and Surkov, Y.: Photometric modeling of the regolith in the Reiner Gamma and Mare Ingenii lunar swirls, Europlanet Science Congress 2026, The Hague, The Netherlands, 7–11 Sep 2026, EPSC2026-926, https://doi.org/10.5194/epsc2026-926, 2026.
Please decide on your access
Please use the buttons below to download the supplementary material or to visit the external website where the presentation is linked. Regarding the external link, please note that Copernicus Meetings cannot accept any liability for the content and the website you will visit.
Forward to presentation link
You are going to open an external link to the presentation as indicated by the authors. Copernicus Meetings cannot accept any liability for the content and the website you will visit.
We are sorry, but presentations are only available for conference attendees. Please register for the conference first. Thank you.
You have already stored your personal programme. Please decide:
the present selections with my stored personal programmemy stored personal programme with the present selections
Please decide on your access
Please use the buttons below to download the supplementary material or to visit the external website where the presentation is linked. Regarding the external link, please note that Copernicus Meetings cannot accept any liability for the content and the website you will visit.
Forward to session asset
You are going to open an external link to the asset as indicated by the session. Copernicus Meetings cannot accept any liability for the content and the website you will visit.
We are sorry, but presentations are only available for conference attendees. Please register for the conference first. Thank you.