
 1,2,1,1,1,1
- 1German Aerospace Center (DLR), Planetary Physics, Planetary Sciences and Remote Sensing, Berlin, Germany
- 2Institute of Geological Sciences, Freie Universität Berlin
Mercury’s geodynamic history has been characterized by global contraction due to planetary cooling and inner core growth. The planet likely experienced the largest radius change out of all Solar System bodies, with most occurring early in its thermal evolution (Watters, 2021, Peterson et al., 2021, Grott et al., 2011, Byrne et al., 2014). Such contraction has been recorded in tectonic landforms on the surface, which can be used to reconstruct radius changes from tectonic strain. However, estimates substantially vary between < 2 km (Watters, 2021) and up to 7 km (Byrne et al., 2014), depending on whether wrinkle ridges are taken into account as contributing to global contraction. A recent study by Broquet & Andrews-Hanna (2026) revisited Mercury’s tectonic record and found global contraction values of 8.3 ± 4.5 km, with a conservative range of 6.3 ± 3.2 km when considering only primary tectonic landforms. Contraction was found to substantially vary spatially, with some regions displaying a near‐zero record of contraction. The authors also propose high contraction rates of 0.02 – 0.04 km/Myr from 4.1 – 3.9 Ga, followed by significantly lower contraction rates during the later evolution. Additionally, an upcoming study by Nishiyama et al. (submitted) suggests that surface roughness can obscure tectonic features on the surface, leading to an underestimation of Mercury’s global contraction by up to 30 %.
Motivated by these new findings, this study uses 3D geodynamic simulations to model Mercury’s thermal evolution and estimate contraction on a global and local scale. Our geodynamic models build upon the work of Fleury et al. (2024) and use the finite-volume mantle convection code GAIA (Hüttig et al., 2013). GAIA solves the conservation equations of mass, momentum and energy from 4.5 Ga to present day under the assumption of homogeneous mantle composition, Newtonian rheology, and negligible inertia. In our models, we employ surface temperature variations caused by the combined effects of Mercury’s low obliquity and its 3:2 spin-orbit resonance (Vasavada et al., 1999), as well as crustal thickness variations, inverted from gravity and topography data (Broquet et al., 2024). We account for a laterally variable crustal thermal conductivity considering crustal porosity variations (Broquet et al., 2024). We use two transfer models by Henke et al. (2016) to replicate the decrease of thermal conductivity with increasing porosity, and also consider an insulating megaregolith layer of 2 – 5 km thickness. Additionally, we investigate the effects of mantle melt extraction on regional contraction. While previous models (Peterson et al., 2021; Tosi et al., 2025) have considered only fully extrusive scenarios, we test both intrusive and extrusive cases, varying global and local intrusive to extrusive ratios between 0 and 1. We place magmatic intrusions either at a predefined depth within the lithosphere (i.e., varying between 45 and 140 km) or, for some cases, we place them at the base of the crust, which naturally leads to spatial variations of the intrusive melt depth. We compare our predictions for present-day global and local contraction to tectonic strain from Broquet & Andrews-Hanna (2026).
Our models predict between 7 – 12 km of global contraction between the end of crustal formation (3.8 Ga) and today, with an average of 9.8 ± 1.3 km. Although increasing the average crustal thickness strongly reduces the early contraction rate, it is found to have no significant impact on overall global contraction estimates. We find that regions insulated by a thick, porous crust, especially located around the two hot poles (60°S - 60°N), are warmer during early evolution, inducing higher and longer melt production. Melt extraction in these areas leads to more efficient cooling, therefore displaying lower amounts of contraction since 3.8 Ga than the rest of the planet. Assuming different megaregolith thicknesses up to 5 km, as well as a linear or exponential decrease of conductivity with increasing porosity, affects global contraction estimations by up to ± 1 km, and early contraction rates by up to ± 2.5 km/Gyr. Varying the ratio of extrusive to intrusive magmatism impacts global contraction up to ± 0.5 km, but has no significant effect on the early contraction rate (Figure 1).
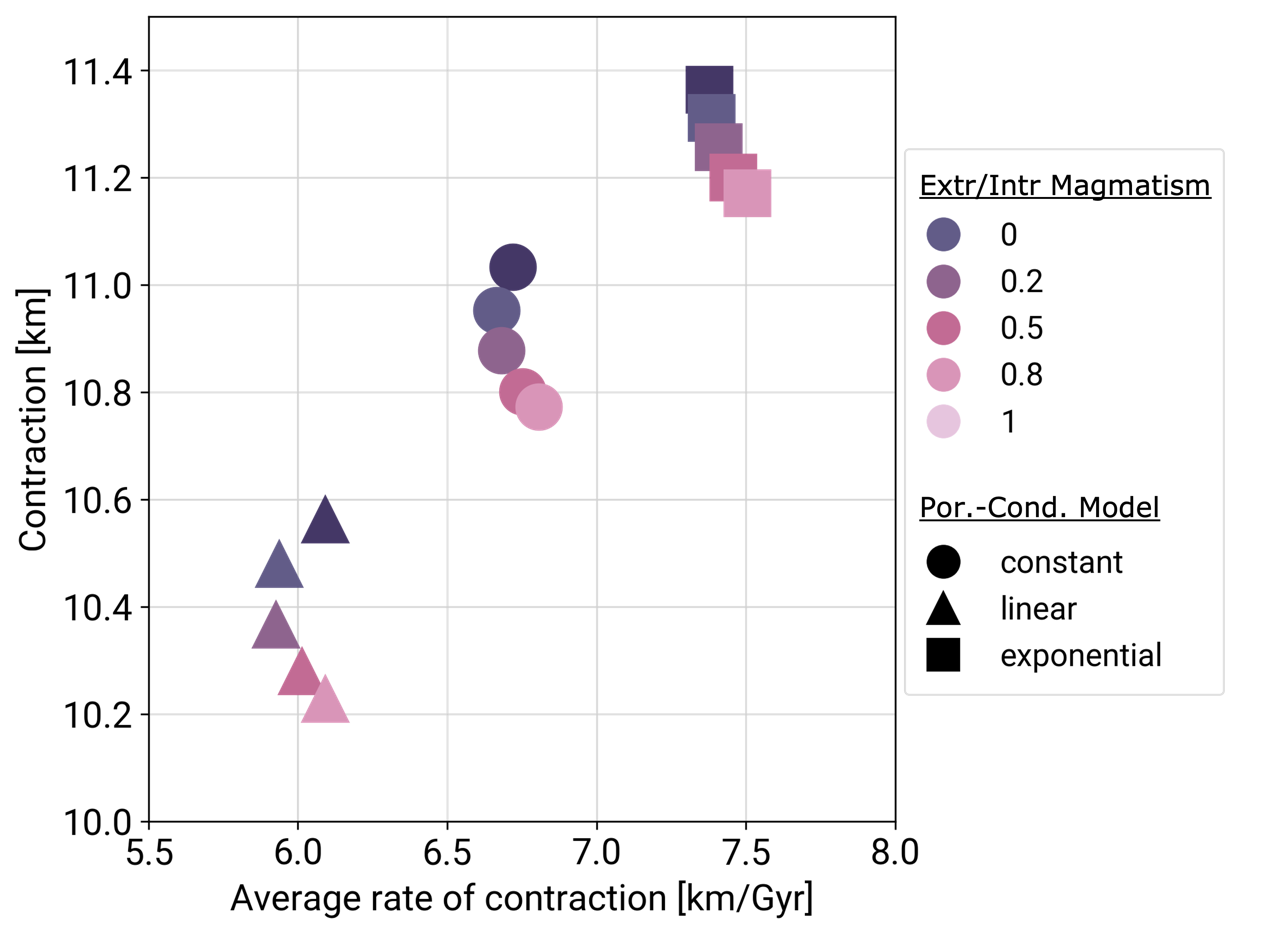
Figure 1: Global contraction from 3.8 Ga until present day over the average rate of contraction in the first Gy. Different colors represent the ratio of extrusive to intrusive magmatism in the simulations. The symbols represent three cases for treating thermal conductivity of the crust. In the “constant” case, a homogeneous crustal thermal conductivity is assumed. For the “linear” and “exponential” case, two transfer functions between porosity (Broquet et al., 2024) and thermal conductivity are used to assign a laterally variable thermal conductivity to the crust (Henke et al., 2016).
With our models, we are able to match the average global contraction estimates from observational constraints accounting for all tectonic landforms (>7 km; e.g., Byrne et al., 2014, Broquet & Andrews-Hanna, 2026), as well as a pattern of contraction dominated by surface temperature (Figure 2). While we can reproduce some regional patterns of low contraction, we are not able to replicate the large range of local contraction, as well as the regions that show no evidence of tectonic strain (Broquet & Andrews-Hanna, 2026). This implies that major processes, not captured in our geodynamics models, have affected Mercury’s contractional history.
We show that planetary contraction is far from isotropic, which has implications for our understanding of Mercury’s tectonic record. More detailed comparisons of our planetary contraction estimates with those inferred from shortening landforms will provide important insights into the interior processes and cooling history of Mercury.
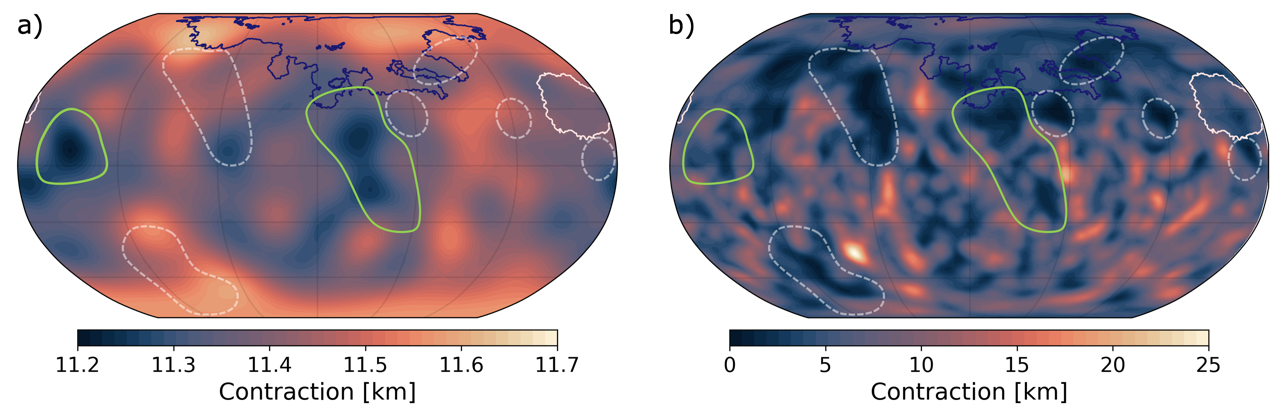
Figure 2: Comparison of a) our best-fit model contraction estimates since 3.8 Ga to b) contraction calculated from tectonic strain (Broquet & Andrews-Hanna, 2026). The Caloris basin (light pink) and a selected area of the smooth plains (dark blue) are outlined (Denevi et al., 2013). Green outlines show good agreements between model and observational estimates. White, dotted outlines represent low-contraction areas not explained by our model, which display high surface roughness (Nishiyama et al., submitted).
How to cite: Büttner, T., Broquet, A., Plesa, A.-C., Santangelo, S., Stark, A., and Hussmann, H.: Can Mercury’s heterogeneous tectonic record be explained by geodynamic models?, Europlanet Science Congress 2026, The Hague, The Netherlands, 7–11 Sep 2026, EPSC2026-1070, https://doi.org/10.5194/epsc2026-1070, 2026.


