
 1,1,1,2
- 1National Institute for Astrophysics (INAF), Rome, Italy (giuseppe.massa@inaf.it)
- 2European Space Agency (ESA), European Space Astronomy Centre (ESAC), Camino Bajo del Castillo s/n, 28692 Villanueva de la Cañada, Madrid, Spain
Introduction:
Permanently shadowed regions (PSRs) of the Moon are thought to act as cold traps for volatiles, due to their extremely low temperatures (<110 K) [1,2].
The Moon Mineralogy Mapper (M3) spectral analysis [3] revealed absorptions of water ice at about 1.25, 1.5, and 2.0 µm in several permanently shadowed areas at both lunar poles. However, latest results based on radiance contrast, obtained by Danuri ShadowCam, [4-7] show that the ice-bearing areas identified by M³ exhibit no significant brightness contrast relative to their surroundings, raising questions about the reliability and interpretation of the previous M³ detections.
In this work, we analyze M³ spectral data to address this apparent discrepancy and reassess the evidence for exposed water ice in lunar PSRs, which represents a key factor for future in situ robotic investigations and human exploration.
Methods:
To search for water ice, we applied a procedure based on the identification of the 1.25, 1.5, and 2.0 µm absorption bands. Pixels were classified as positive water-ice detections when their spectral properties were consistent with thresholds defined using a laboratory spectrum of an intimate mixture containing 5 wt% water ice and 95 wt% lunar highland simulant. To assess the robustness of the detections, we applied the same procedure to non-PSR regions, located between 69°S and 75°S latitude, where water ice is not expected to be stable. Since the analysis relies on very low-signal data, we also evaluated the linearity of the instrument response in these pixels by comparing the spectra of high- and low-signal regions. Finally, we adopted a statistical approach in which a simulated dataset was generated to reproduce the spectral distortions induced by the non-linear instrumental response and noise, in order to determine whether the combination of these effects can account for the apparent ice detections in the M³ data.
Results:
Figure 1 reports the average spectra of the detected pixels within a South Pole Region of Interest (SP ROI; Fig. 1a), including a PSR, and within a lower-latitude region between 69°S and 75°S (Fig. 1b), where surface water ice is not expected [8]. Figures 1c and 1d show the spatial distribution of the detected pixels in the SP ROI and in the lower-latitude region, respectively. The occurrence of the same spectral features in both areas raises serious concerns on the robustness of these detections. In addition, the detected pixels are frequently aligned along individual detector samples, suggesting a link with instrumental effects rather than with localized surface properties. Overall, these results indicate that the apparent water-ice signatures observed at the South Pole are more likely related to data artifacts or systematic effects than to the presence of an actual surface ice deposit.
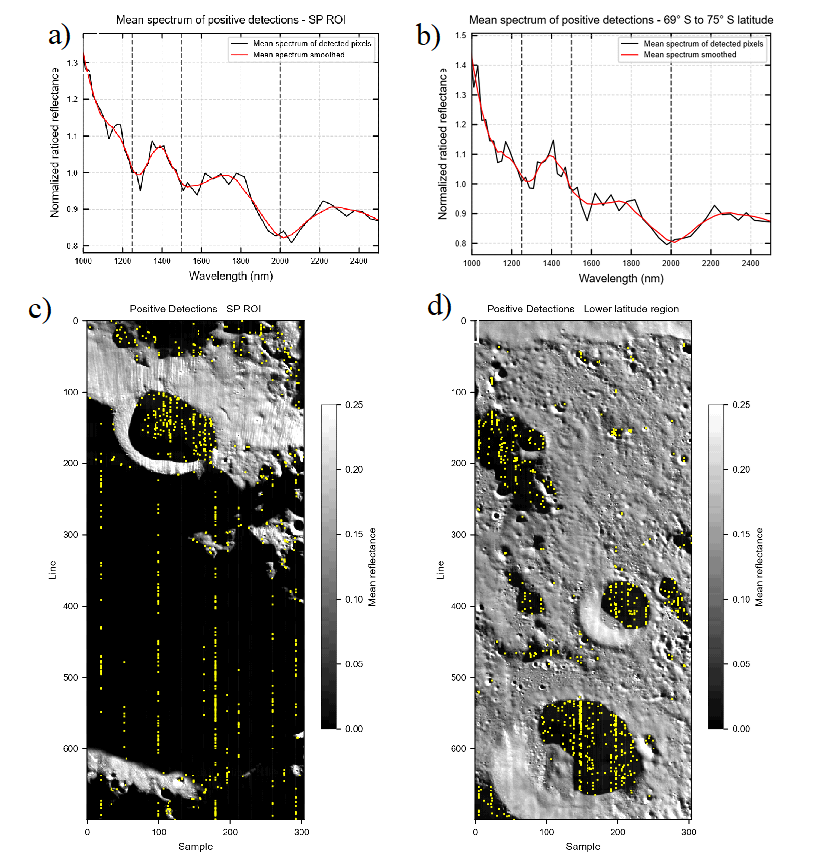
Figure 1: Mean spectra of the detected pixels are shown in figure (a, b) for the SP ROI and the lower latitude region 69° S - 75° S, respectively. The spectra are normalized to their mean value. Vertical dashed lines in the mean spectra indicate the 1250, 1500 and 2000 nm absorption band positions of water ice [9]. Positive detections (yellow dots) distribution in the SP ROI and in the lower latitude region are shown in panels c and d respectively.
We conducted a linearity analysis of the data and found that spectra become progressively distorted from high to low radiance levels. The shape of the distortion is very similar to the Radiance Calibration Coefficient (RCC) used in the instrument calibration pipeline.
We then carried out a statistical analysis to assess whether random noise, combined with the non-linear spectral response of the instrument, could account for the apparent water-ice detections. To this end, we generated a simulated dataset by applying the non-linear distortion derived from the linearity analysis and injecting M³-like noise. Figure 2 shows the scatterplot between the number of water ice detections in the simulated and in the M³ observation across different reflectance bins.
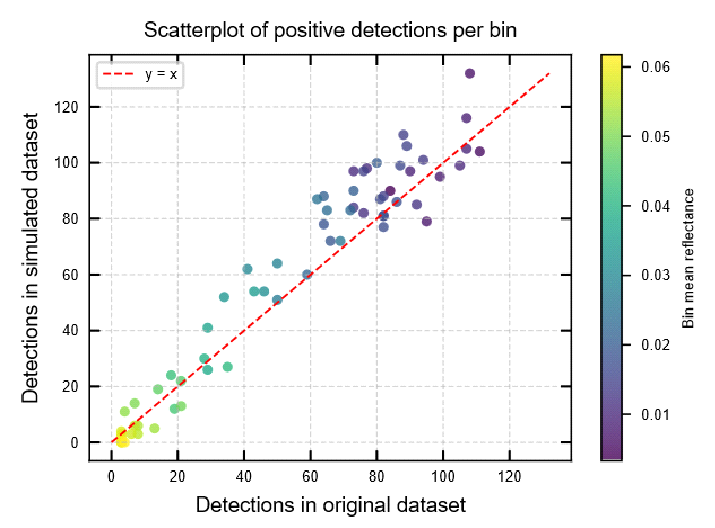
Figure 2: Detections in simulated and original datasets.
The strong linear anticorrelation between the number of detections and reflectance, observed in both datasets, confirms that the apparent water-ice spectral signatures in the M³ data are more likely produced by instrumental non-linearity than by the presence of surface water ice.
Conclusions:
In conclusion, we show that water ice-like spectral signatures can occur in M³ data even in regions where surface ice is not expected to be stable. Our analysis indicates that these detections can be explained by the combined effects of the instrument’s non-linear spectral response and the low signal-to-noise ratio of the data. However, this work does not rule out the presence of surface or subsurface water ice in lunar PSRs. Rather, it highlights that M³ observations at very low signal levels are affected by instrumental effects that can significantly bias the detection of water-ice signatures. Future in situ investigations of the lunar poles will therefore be crucial to assess the presence and distribution of water ice, by providing complementary datasets, higher signal-to-noise measurements, and instruments specifically designed to operate under extremely low-illumination conditions.
Aknowledgments:
This work is granted by Accordo ASI – INAF n. 2024-64-HH.0.
References
[1] Watson, K. et al. (1961). JGR, 66(9), 3033–3045. [2] Urey, H. C. et al. (1952). Physics Today, 5(8), 12-12. [3] Li, S. et al. (2018). PNAS, 115(36), 8907-8912. [4] Ando, J. et al. (2025). The PSJ, 6(3), 62. [5] Williams, J.-P. et al. PSJ 5, 209 (2024). [6] Mahanti, P. et al. J.A.S.S. 40, 131–148 (2023). [7] Li, S. et al. (2026) Sci. Adv. 12, eaec8211 [8] Hayne et al. (2021), Nature Astronomy 5, 169–175; [9] Clark, R. N. (1981) JGR 86, 3087–3096;
How to cite: Massa, G., De Sanctis, M. C., Altieri, F., Raponi, A., and Besse, S.: On the reliability of Water Ice Signatures in Moon Mineralogy Mapper (M3) Spectral Data, Europlanet Science Congress 2026, The Hague, The Netherlands, 7–11 Sep 2026, EPSC2026-1102, https://doi.org/10.5194/epsc2026-1102, 2026.


