
 1,1,2,1,1,3
- 1Université de Sherbrooke, Géomatique appliquée, (myriam.lemelin@usherbrooke.ca)
- 2Center for Space and Habitability, University of Bern, Gesellschaftsstrasse 6, 3012 Bern, Switzerland ()
- 3Applied Physics Laboratory, Johns Hopkins University, 11100 Johns Hopkins Rd, Laurel, MD 20723, United States
Introduction
Lunar Vertex, NASA’s first Payloads and Research Investigations on the Surface of the Moon (PRISM) delivery, will explore the Reiner Gamma lunar swirl (Figure 1) (Blewett et al., 2025). Swirls consist of high and low albedo variations in the form of loops and ribbons sometimes associated with crustal magnetic “anomalies”. Different hypotheses have been proposed to explain the presence of swirls (summarized in Blewett et al., 2021), including magnetic shielding of the surface from the darkening effects of the solar wind, scouring by gas and dust during the collision of a comet's coma or a meteoroid swarm, and accumulation of fine-grained dust in response to magnetic or electric fields associated with the magnetic anomaly. Studies have investigated the photometric properties of the uppermost regolith at swirls without reaching a consensus regarding their origin but suggest that solar wind shielding and dust levitation/sorting may both play a role (e.g., Denevi et al., 2016; Chrbolková et al. 2019; Kinczyk et al., 2025). Geomorphological studies suggest that on-swirl regions are lower than the off-swirl region by ~4 m at Reiner Gamma (Weirich et al., 2023), supporting the dust migration hypothesis, or local topographic variations pre-dating the formation of the swirls.
In this study, we investigate potential differences in regolith properties between on-swirl and off-swirl regions at Reiner Gamma to provide context for the Lunar Vertex mission. Our first objective is to quantify morphometric parameters from the bowl-shaped crater population to investigate potential dust migration mechanisms which may contribute to preferential crater infill on-swirl, or different regolith properties. Our second objective is to estimate regolith thickness using the non-bowl-shaped crater population to see if variations in local regolith thicknesses exist, and in turn, if dust migration mechanisms or differences in pre-impact topography could contribute to these variations.
Datasets and methods
We trained and used a YOLOv5-based model (e.g., Bickel et al., 2025) to detect craters across Reiner Gamma in hillshade images derived from Lunar Reconnaissance Orbiter (LRO) Narrow Angle Camera (NAC) digital terrain models (DTMs) at spatial resolutions from 2 to 5 meters. We developed “MorphoPy”, a Python-based automated crater morphology characterization tool (Martinez et al., 2026), which calculates morphometric parameters (e.g., depth, diameter, wall slope, rim slope, circularity, eccentricity, freshness) on DTMs for craters that have 36 semi-profiles each containing 10 valid measurements. Morphometric parameters are calculated for craters with a diameter (D) equal to or larger than 20 times the spatial resolution of the input DTM, here D≥40 m. In parallel, we manually identified non-bowl-shaped craters (e.g., flat floored, concentric craters, mound) in LROC NAC images on Quickmap and estimated regolith thicknesses using the formula of Bart et al. (2011).
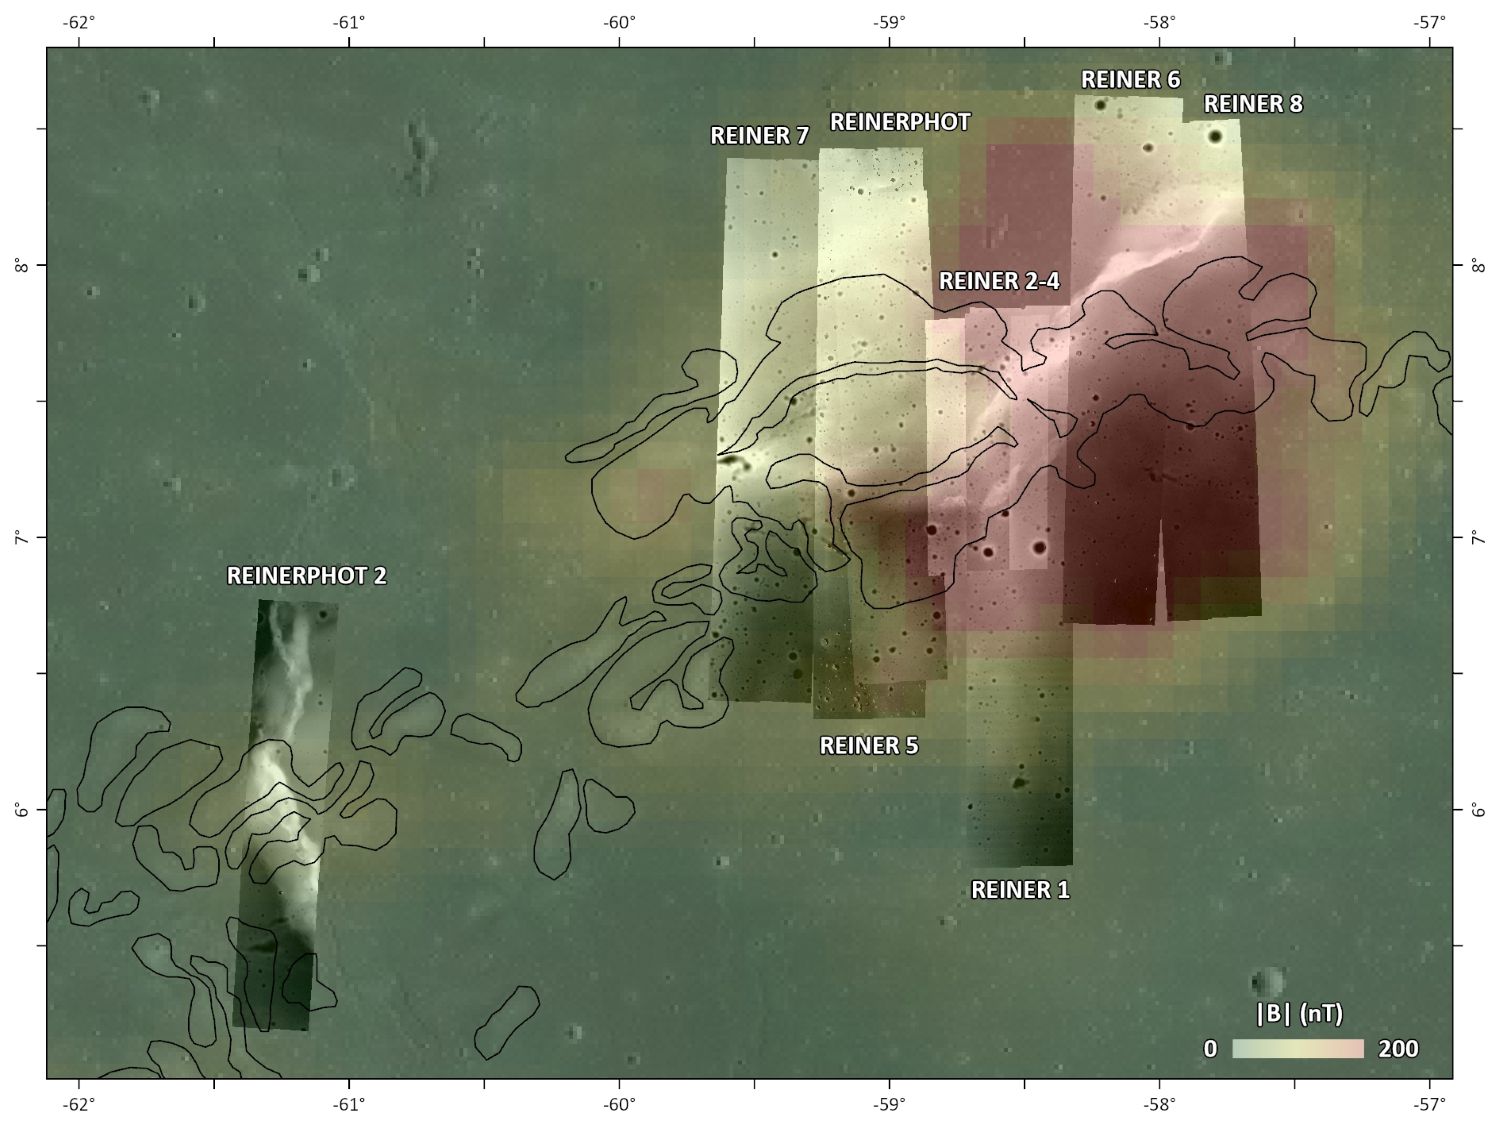
Figure 1. Map of Reiner Gamma showing the location of NAC DTMs used to investigate crater morphology overlain by the intensity of the magnetic field (Ravat et al., 2020) (swirl outline from Denevi et al., 2016).
Preliminary results
The YOLOv5 algorithm identified ~70 000 craters, and “MorphoPy” calculated morphometric parameters for ~25 000 of those. To investigate a subset of the freshest primary craters, we extracted values for craters having a circularity ≥ 0.9, opposite rim slope < 8˚ and a measurable rim for ≥ 50% of their half-profiles. Plots of depth versus diameter values (Figure 2) suggest that most of the freshest primary craters in the Reiner Gamma region have d/D values centered around ~0.1, especially for strength-dominated craters (D < 400 m). Depth versus diameter trends suggest that off-swirl craters are systematically deeper (hence have higher d/D values) than their on-swirl counterpart for a given crater diameter. Analyses will be conducted next to see if the trends are statistically different.
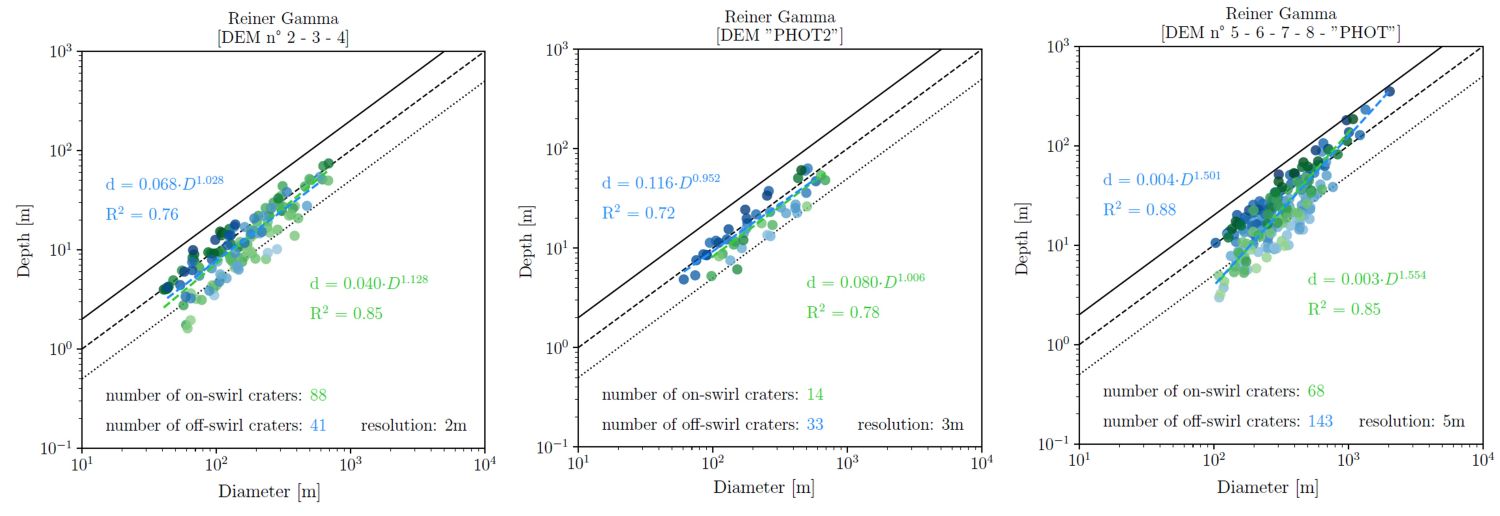
Figure 2. Depth versus diameter values for the freshest on-swirl and off-swirl craters in DTMs of different spatial resolution (solid line d/D=0.2, dashed line d/D=0.1, dotted line d/D=0.05).
We identified 918 non-bowl-shaped craters on Quickmap, and calculated regolith thickness for the 503 craters that exhibit a clear rim (apparent diameter, DA) and “inner feature” (measured at the base of the normal crater wall slope, DF). Bart et al. (2014) suggest that craters where DF/DA varies between 0.2 and 0.7 and where DA < 300 m are well suited to infer regolith thickness. In our case, 467 craters respect such values (296 off swirl, 171 on swirl) and yield a mean regolith thickness of 6.6 m off-swirl versus 6.1 on-swirl and median values of respectively 4.1 and 4.2 m. These values are consistent with those reported for mare surfaces (3.1–7.8 m; Cooper et al., 1974; Nakamura et al., 1975; Bart et al., 2011). The “regolith thickness” values calculated range between ~1 and 50 m. Impact craters that encounter a strength transition in the target have non-bowl-shaped morphologies. The strength transition can be a layer of regolith over bedrock but can also be a strength transition farther beneath the surface such as layering in the basalt (Bart et al, 2014). A hot spot analysis (Getis-Ord Gi) on the 467 regolith thickness measurements suggests that some high (hot spot) and low (cold spot) regolith thickness values cluster spatially and are statistically significant. Hot spots mostly occur on-swirl and towards the southern portion of Reiner Gamma, while cold spots mostly occur off-swirl and towards the northern portion of Reiner Gamma. The region at ~7.5˚N, 59.5˚W notably exhibits cold spots (regolith thickness values on the order of 1-3 m) in proximity to hot spots (“regolith thickness” or strength contrast at 5-50 m).
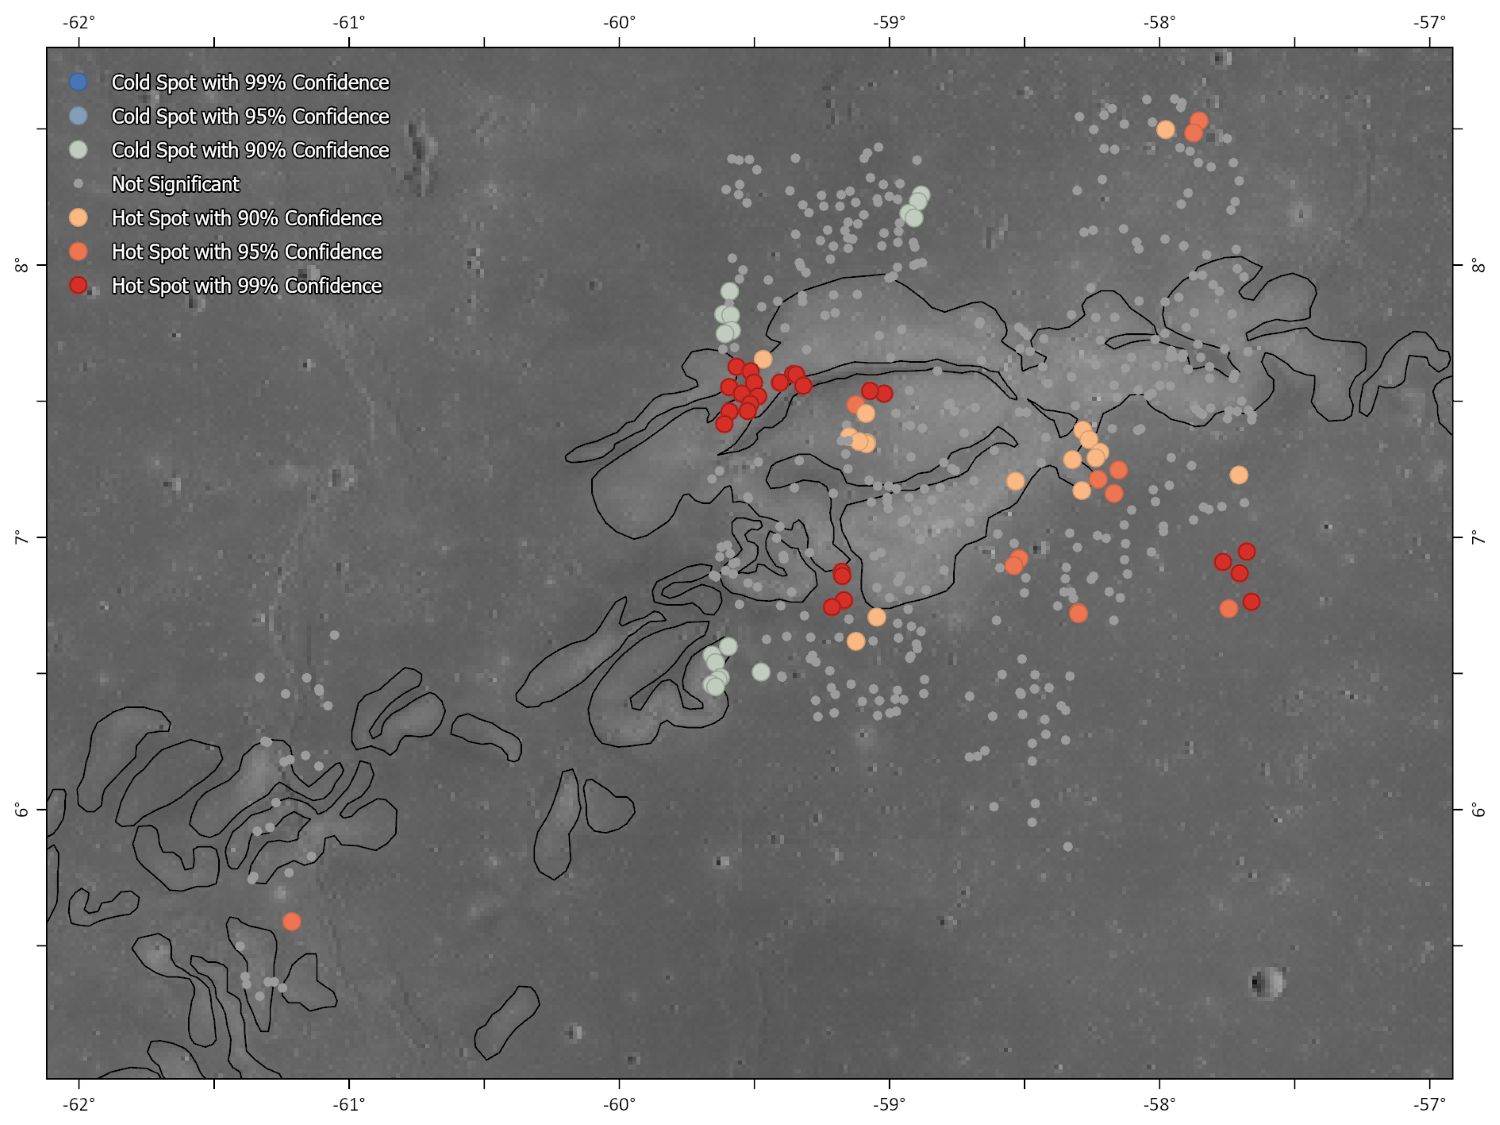
Figure 3. Hot spot analysis on 467 regolith thickness measurements.
Bart et al. (2011) Icarus 215, 485–490.
Bart et al. (2014) Icarus 235, 130–135
Bickel et al. (2025) GRL, 51, 24, e2024GL110674.
Blewett et al. (2021) Bulletin of the AAS, 53, 4.
Blewett et al. (2025) 56th LPSC, abstract #1233.
Chrbolková et al. (2019) Icarus, 333, 516-527.
Cooper et al. (1974) Rev. of Geophysics, 12, 3, 291-308.
Denevi et al. (2016) Icarus, 273, 53-67.
Kinczyk et al. (2025) Planet. Sci. J., 6, 57.
Nakamura et al. (1975) Nature, 13, 57-66.
Weirich et al. (2023) lanet. Sci. J., 4, 212.
How to cite: Lemelin, M., Martinez, L., Calas, G., Lagneaux, A., Roy, M., T. Bickel, V., Belleau-Magnat, G., Diotte, F., and T. Blewett, D.: The Structure of the Regolith at Reiner Gamma: Context for the Lunar Vertex Mission, Europlanet Science Congress 2026, The Hague, The Netherlands, 7–11 Sep 2026, EPSC2026-124, https://doi.org/10.5194/epsc2026-124, 2026.


