
 1,2,2,
- 1Centre for Mars Meteorology Monitoring and Forecasting/Paneureka, Le Bourget-du-Lac, France (lmontabone@paneureka.org)
- 2Laboratoire de Météorologie Dynamique/IPSL/CNRS/Sorbonne Université, Paris, France
Introduction
Martian weather has been continuously monitored for more than 25 years using observations from orbiters, landers, and rovers. A paradigm shift would be to move toward simultaneous monitoring of global Martian weather using a constellation of satellites in high-altitude orbits, such as areostationary orbit [1, 2].
Improving weather monitoring has direct implications for weather forecasting, which is considered a key exploration-focused science topic, as it supports and enables future exploration objectives. At the same time, developing weather forecasting capabilities for an extraterrestrial planet has broader implications for atmospheric science, making it also an exploration-enabled science topic, since it represents science made possible by exploration platforms and capabilities [3].
Alongside improved observational monitoring of Martian weather, reliable forecasting requires key developments in the models used to simulate the Martian atmosphere, such as Global Climate Models (GCMs). Improving the representation of the dust cycle, in particular, is of paramount importance for correctly reproducing the observed seasonal and interannual variability of Martian dust storms [4].
Data assimilation and machine learning have emerged as complementary approaches for monitoring and forecasting Martian weather: data assimilation combines observations with atmospheric models to produce multi-annual retrospective analyses, or “reanalyses” [e.g., 5], while machine learning enables data-driven prediction [e.g., 6].
From Monitoring…
Using thermal infrared data from instruments such as the Thermal Emission Spectrometer onboard Mars Global Surveyor, the Thermal Emission Imaging System onboard Mars Odyssey, the Mars Climate Sounder onboard Mars Reconnaissance Orbiter, and the Emirates Infrared Spectrometer onboard the Emirates Mars Mission, we have produced a reconstruction of daily maps of column dust optical depth (CDOD) spanning 14 Martian years (MY 24–37). These maps represent one of the longest consistent, observation-based, multi-instrument climatological records produced to date for a key Martian weather-relevant variable [7]. Among many applications, they are used as “dust scenarios” in the Mars Climate Database [8]
However, the observational coverage remains spatially sparse, requiring interpolation techniques, such as kriging or the use of climatological values, to complete the gridded maps. To move beyond purely spatial interpolation, we have developed a dynamical interpolation approach inspired by data assimilation. In this approach, incomplete gridded CDOD maps with a 6-hour cadence are assimilated into the Mars Planetary Climate Model (PCM; see [9]) using an adaptation of the Analysis Correction assimilation scheme [10], in which analysis increments are gradually introduced into the model integration.
Figure 1 illustrates the scheme concept. Figure 2 presents an application to the reconstruction of the diurnal evolution of a regional dust storm over one sol, compared with both a model-only simulation and the incomplete gridded maps. Figure 3 shows a similar reconstruction for daily averages over multiple sols, compared with both the model-only simulation and complete maps produced by combining gridding and kriging.
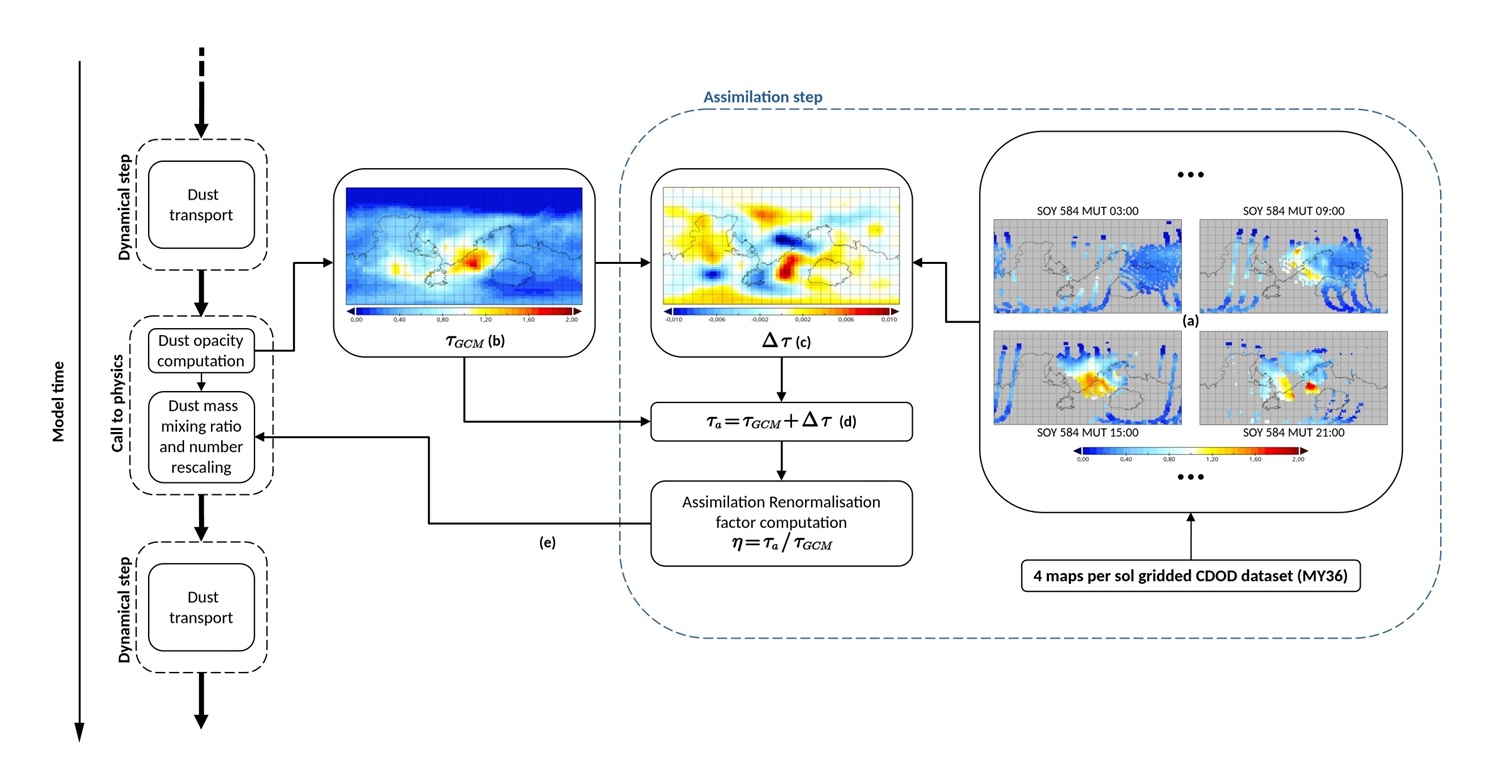
Figure 1: Schematic of the implemented dynamical interpolation approach. Example for MY 36, SOY 584, Ls ~ 313°, MUT 21:00, using incomplete gridded maps at MUT 03:00, 09:00, 15:00, and 21:00 (a). Other boxes show: (b) Mars PCM background CDOD, (c) CDOD assimilation increment, (d) analysis equation, and (e) analysis-derived CDOD rescaling factor used to adjust the dust tracer before transport.
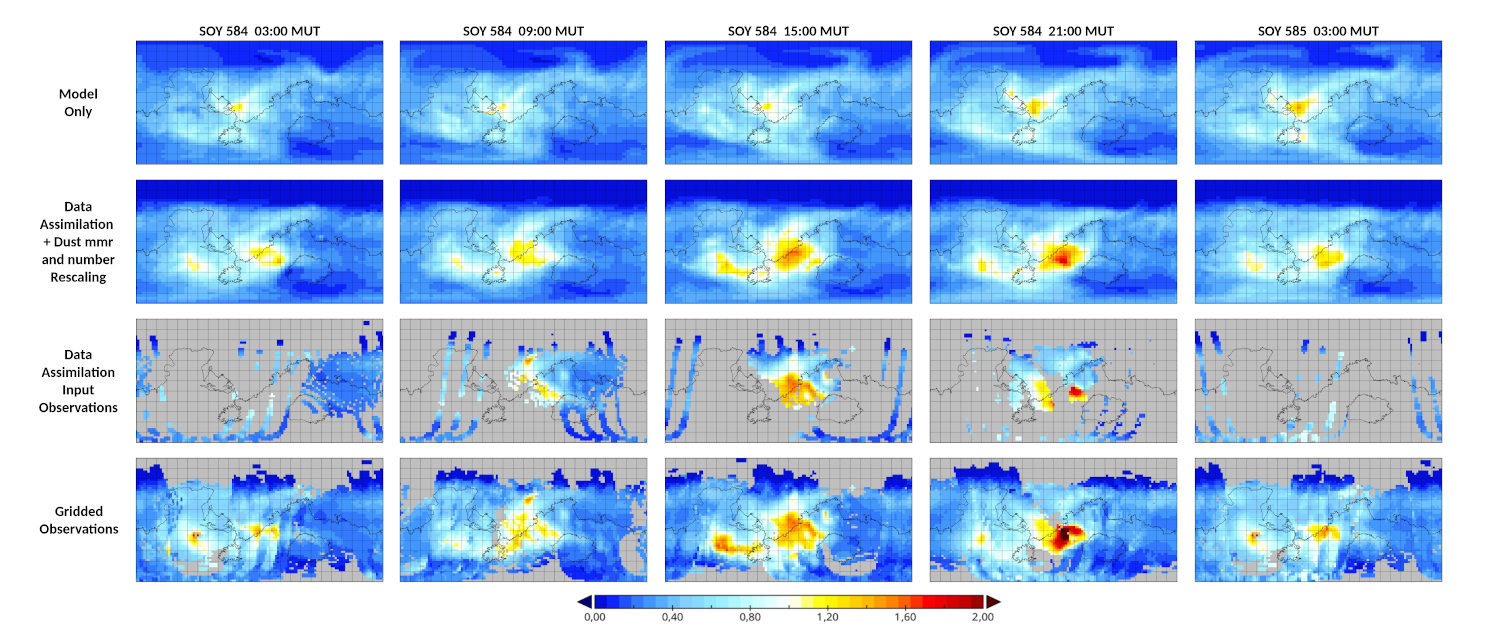
Figure 2: Comparison of the diurnal evolution of a regional dust storm (MY 36, SOY 584) among the PCM simulation, dynamical interpolation with the data assimilation scheme, incomplete gridded CDOD maps used as assimilation input (1-sol time window), and incomplete gridded maps reconstructed using time windows of up to 3 sols. All maps show extinction CDOD at 9.3 μm.
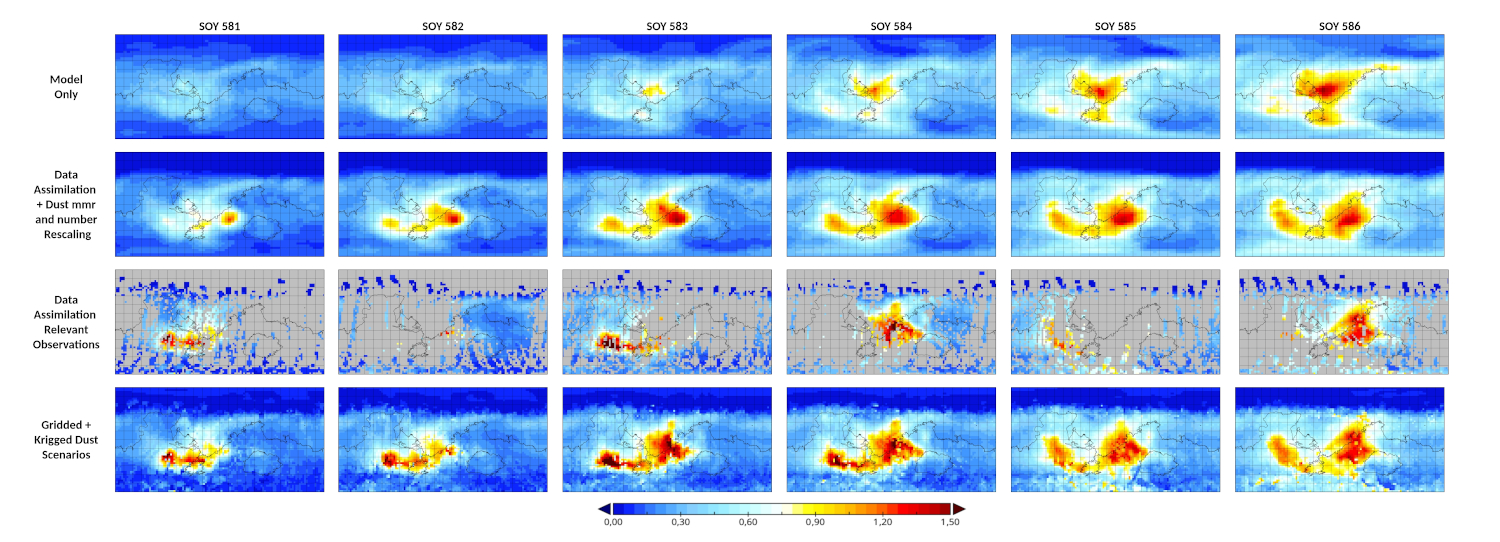
Figure 3: As in Figure 2 but showing the evolution of the same dust storm over 6 sols. Each map corresponds to a daily average. Kriging was also used for the bottom raw.
…to Forecasting
The products shown in Figures 2 and 3 represent a first step toward the implementation of a full data assimilation system for Martian weather, which could ultimately be used to produce initial conditions for numerical Martian weather forecasts. Although the underlying assimilation approach is established, the system is designed to be flexible and expandable, with future operational applications in mind.
A complementary approach to numerical weather forecasting is data-driven forecasting using machine learning (particularly deep learning models), which has recently shown promising results in terrestrial weather prediction. We have therefore begun exploring deep learning approaches by training convolutional forecasting models on a multi-annual reanalysis dataset [5] and multi-annual model-only simulations [4].
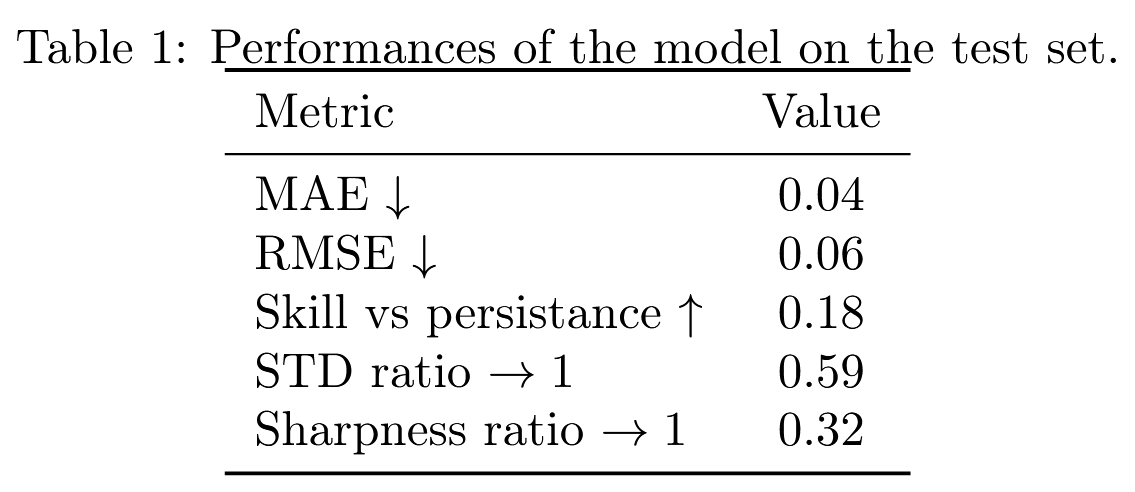
Figure 4 shows preliminary results from a ConvLSTM model applied to daily averaged CDOD prediction with a one-sol lead time. In this experiment, the model was trained on a single Martian year (MY 26) and tested on another year (MY 24), using 60% of the data for training and 40% for testing. We report the resulting model performance on the test set in Table 1. A skill score of 18% relative to persistence indicates that the model improves on a persistence forecast by 18% at a one-sol lead time. Because the standard-deviation ratio is below 1, the current model appears to underestimate variability. Similarly, a sharpness ratio below 1 suggests that the model still struggles to reproduce sharp gradients and tends to smooth spatial structures.
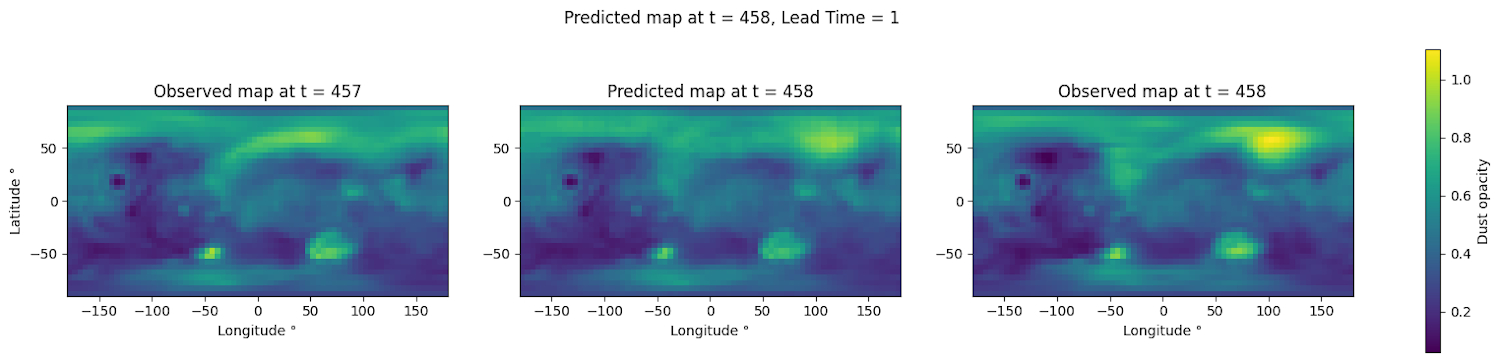
Figure 4: Example of CDOD field prediction using a ConvLSTM model. Left panel: observed field at the initial time (MY 24, SOY 457, LS ≈ 233°). Central panel: one-sol-ahead prediction produced by the model, using the seven preceding daily fields as input. Right panel: observed field corresponding to the prediction.
References
[1] Montabone et al., EPSC2021-625, https://doi.org/10.5194/epsc2021-625 (2021).
[2] Cardesin-Moinelo et al., EPSC2026-928 (2026)
[3] European Space Agency. The European Exploration Strategy: Explore2040. ESA (2024).
[4] Pierron et al., EPSC-DPS2025-724, https://doi.org/10.5194/epsc-dps2025-724 (2025).
[5] Valeanu et al., NERC EDS Centre for Environmental Data Analysis, https://dx.doi.org/10.5285/cd037a9ea387438fabf4d674dbe53088 (2026).
[6] Uprety et al., Proceeding of the DARES’25-ECAI 2025 workshop, Bologna, Italy (2025)
[7] Lombard et al., EPSC-DPS2025-1765, https://doi.org/10.5194/epsc-dps2025-1765 (2025).
[8] Millour et al., EPSC2026-776 (2026).
[9] Forget et al., 7th Mars Atmosphere Modeling and Observation workshop, Paris, France (2022).
[10] Lorenc et al., Q. J. R. Meteorol. Soc., 117, 59–89 (1991)
How to cite: Montabone, L., Lombard, T., Guyon, V., Le Dantec, J., Pierron, T., Forget, F., Millour, E., and Boukhobza, Y.: Weather on Mars: From Monitoring to Forecasting, Europlanet Science Congress 2026, The Hague, The Netherlands, 7–11 Sep 2026, EPSC2026-1310, https://doi.org/10.5194/epsc2026-1310, 2026.


