Multiple terms: term1 term2
red apples
returns results with all terms like:
Fructose levels in red and green apples
Precise match in quotes: "term1 term2"
"red apples"
returns results matching exactly like:
Anthocyanin biosynthesis in red apples
Exclude a term with -: term1 -term2
apples -red
returns results containing apples but not red:
Malic acid in green apples
hits for "" in
Network problems
Server timeout
Invalid search term
Too many requests
Empty search term
TP3
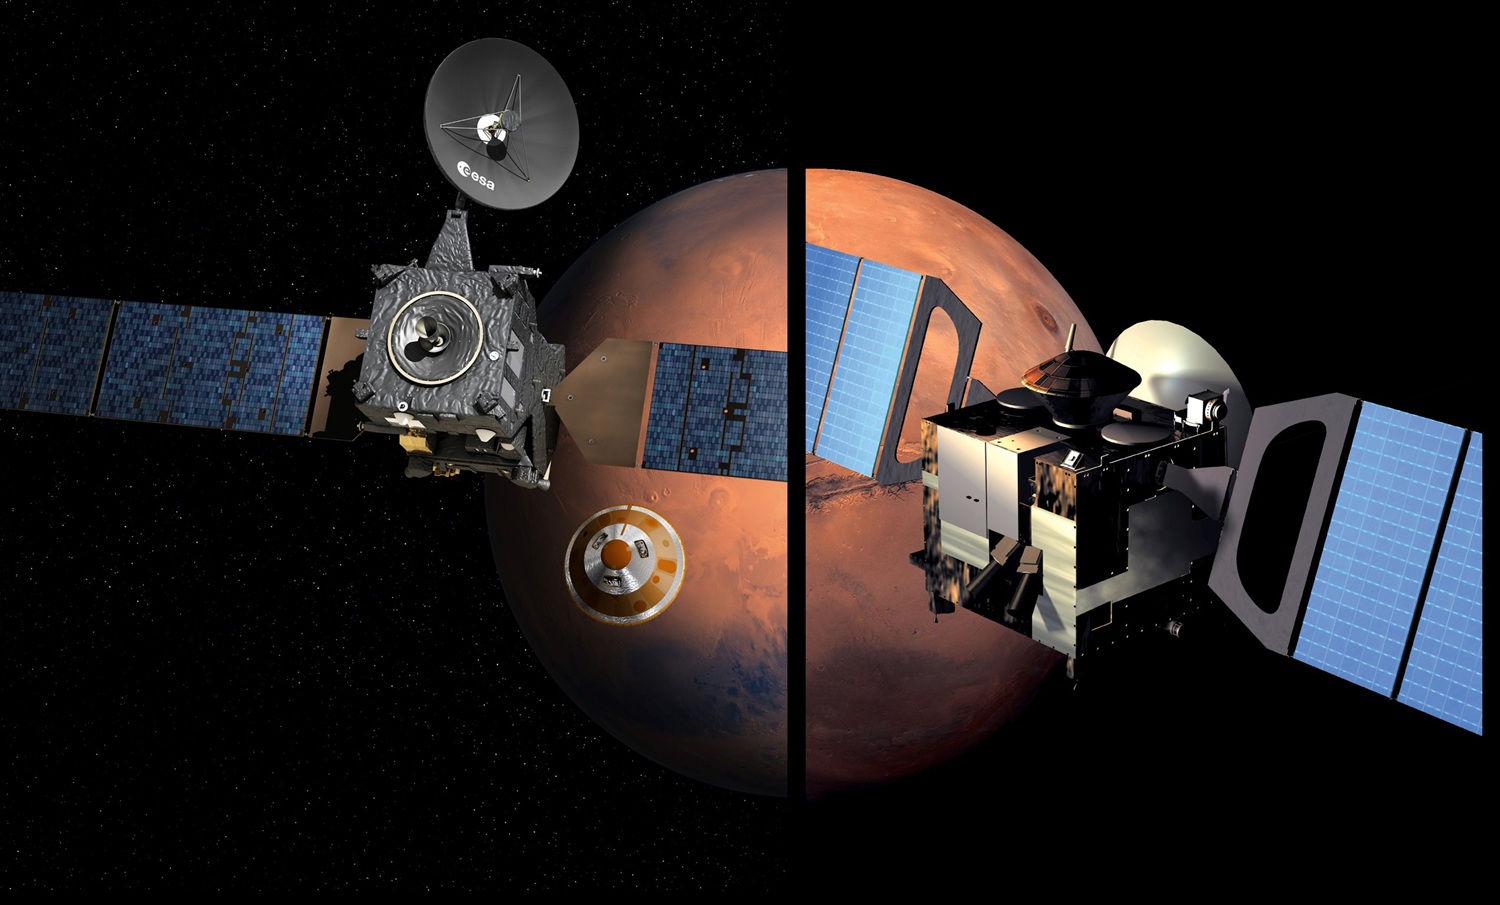
We welcome contributions from any field of Mars science (observation or modelling) and exploration (robotic and human), in particular mission status and instrument overviews of latest scientific results and technical developments. These may include latest scientific results and mission overviews, as well as new challenges, for orbiters (Mars Express, ExoMars TGO, Odyssey, MRO, Tianwen-1, Hope), surface assets (Mars Science Laboratory, Mars2020), and future missions: Martian Moons eXploration (MMX), ExoMars Rosalind Franklin Mission, ESCAPADE, and beyond.

ExoMars Trace Gas Orbiter (TGO): TGO will soon reach its tenth year at Mars: it arrived at Mars on 19 October 2016, and reached its nominal science orbit in April 2018.
Recent science highlights include (a) a new climatology of water vapor, tracing high-altitude water [1,2]; (b) further characterization of variations of HCl, including search for magmatic sources [3] and co-ordinated ground-based observations [4]; (c) study of the seasonal cycle of ice & dust deposition at Louth Crater [5].
The TGO spacecraft health is nominal and appears consistent with operation well into the 2030s.
Mars Express (MEX): MEX remains a highly productive mission as it enters its third decade of operation at Mars.
Recent science highlights include (a) discovery of englacial (internal) folding of the South Polar Layered Deposits, providing evidence of ice flow [1]; (b) an analysis of clays at Oxia Planum and Mawrth Vallis showing that they clay layers at both sites appear to have a common origin; (c) a new climatology of atmospheric dust from SPICAM; (d) detection of a huge enhancement of the M2 ionospheric layer in response to a solar storm, measured using spacecraft-to-spacecraft (MEX-to-TGO) radio occultation.
Mars Express operations are currently funded until end of 2026, with extension requested until end of 2029.
Acknowledgments: This abstract represents the work of hundreds of researchers across the MEX and TGO teams, as well as the spacecraft and science operations teams for these missions. MEX and TGO data are freely and publicly available at ESA’s Planetary Science Archive (https://psa.esa.int/). Digital Elevation Models from CaSSIS are available at https://cassis.oapd.inaf.it/archive/ .
References:
[1] A. Brines et al., JGR 2026, https://doi.org/10.1029/2024JE008916
[2] A. Brines et al., JGR 2026 https://doi.org/10.1029/2025JE009191
[3] Mege et al EPSC-DPS 2025, https://doi.org/10.5194/epsc-dps2025-985
[4] S. Faggi et al., JGR 2026, https://doi.org/10.1029/2025JE009105
[5] M. Azevedo et al., LPSC 2026
[6] L. Guallini et al, EPSL 2026, https://doi.org/10.1016/j.epsl.2025.119749
[7] Auré et al, Icarus 2026, https://doi.org/10.1016/j.icarus.2026.117113
[8] Fedorova et al, JGR 2026, https://doi.org/10.1029/2025JE009388
[9] Parrott et al., Nat Comm 2026, https://doi.org/10.1038/s41467-026-69468-z
How to cite: Wilson, C.: Europe’s Mars orbiters: Status & Highlights, Europlanet Science Congress 2026, The Hague, The Netherlands, 7–11 Sep 2026, EPSC2026-270, https://doi.org/10.5194/epsc2026-270, 2026.
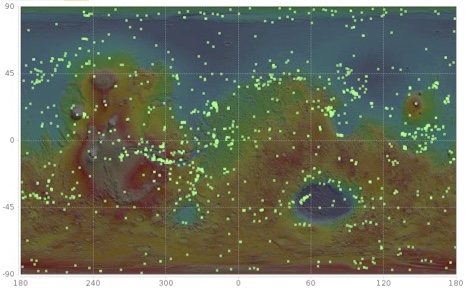
The High-Resolution Imaging Science Experiment (HiRISE) camera, orbiting Mars since 2006 on the Mars Reconnaissance Orbiter (MRO), has returned more than 102,000 large (gigapixel) images with scales as small as 25 cm/pixel covering 5.2% of the Martian surface. About 20% of these images are parts of stereo pairs providing 10000 anaglyphs of the martian surface. The HiRISE team has created over 1200 stereo Digital Terrain Models (DTMs; Figure 1) that provide the highest-resolution (1 m/px) planetary topography from orbit. HiRISE uses time delay integration (TDI) to image at a high signal-to-noise ratio in spite of the small view of each pixel and the fast groundtrack velocity. Thanks to our community targeting, rapid data release policy, and open distribution of analysis tools, the scientific impact of HiRISE has been extraordinarily high. A search for "HiRISE" and "Mars" in NASA ADS on 5 May 2026 yielded 2,687 refereed publications. There are 638 refereed publications from 2/2024 to 5/5/2026, published since the summary by McEwen et al. (2024, Icarus 419, id.115795). HiRISE has scouted and certified the landing sites for the Phoenix and InSight landers and the Curiosity, Perseverance, and Rosalind Franklin rovers. Furthermore, HiRISE images have helped to diagnose several failed landing attempts, allowed the Opportunity rover to avoid sand traps, monitored dust accumulation on Insight’s solar panels, and enabled Curiosity to choose drive paths to minimize wheel damage. HiRISE science results can be put into several major categories:
- Ancient Mars alteration: Widespread aqueous mineral alteration of ancient martian crust (and limited exposures of younger crust) has been a paradigm change over recent decades from orbiting spectrometers and other data. HiRISE data, especially with DTMs, enable placing the compositional data into stratigraphic context and extrapolation of some mineral exposures to smaller scales via the color data.
- Geologic processes: There have been hundreds of studies of martian stratigraphic, volcanic (lava and mud), impact, fluvial, mass wasting, tectonic, aeolian, glacial, and periglacial processes. Typically these studies use multiple datasets, but HiRISE provides the highest resolution views except where there have been successful landers, rovers, and drones.
- Ice in the mid latitudes forms an important climatic record and resource for future humans. HiRISE has determined the distribution of buried mid-latitude ice through the imaging of ice-exposing new impact craters including one located as equatorward as 35 N. HiRISE also characterizes thermokarst features that indicate the continued presence of buried excess ice as well as ice-exposing scarps that directly expose this ice.
- Polar science benefits from HiRISE’s polar orbit as well and the high signal-to-noise that its TDI system provides. Stereo DTMs allow for signal analysis of polar layered exposures that show orbital control of Mars’ climate over millions of years. HiRISE shows seasonal CO2 defrosting activity actively changing sand dunes and other surface features today. Dozens of avalanches in progress and mass wasting from polar scarps are measured in HiRISE data. Interannual change in dynamic CO2 ice landforms are measured and can be related to the current climate.
- Current non-polar activity has been shown by HiRISE to be surprisingly common. Dune migration is measured at all latitudes providing information on near-surface winds and the efficacy of aeolian processes today. Modern gully activity has been recorded by HiRISE in enough seasonal detail to determine that seasonal CO2 frost and not liquid water is the responsible agent. Recurring slope lineae mimic the appearance of seeping water tracks on Earth, but HiRISE DTMs and seasonal monitoring showed they are probably narrow thermally-triggered dry landslides. Thousands of newly-formed impact craters have been measured by HiRISE and constrain the present-day impact rate.
- Co-analysis with landed missions has been a part of hundreds of publications. Although landers and rovers provide high-resolution images of very small areas around the surface cameras, HiRISE images and topography provide essential geologic context. For example, the Amapari Marker bed (AMB), for which Curiosity indicated lacustrine deposition, has been mapped around Gale crater with HiRISE data, showing that the lake could have been up to 14-km across (Mondro et al. 2025, JGR Planets 130). In some cases there are dozens of publications even before landing has occurred, such as for the Rosalind Franklin rover.
- Computer vision (or machine learning) has been increasingly important given the very large volume of data from Mars. Such studies have transitioned in recent years from simply demonstrating the potential to producing significant science results. Examples include mapping the global distribution of pitted cones, whose distribution strongly supports an origin as mud eruptions, and finding new impact locations including smaller events where HiRISE can make follow-up diameter measurements, reducing the discrepancy between optical and seismic detections.

Figure 1. HiRISE DTMs archived with PDS plotted (green squares) on a map of Mars based on MOLA elevations.
How to cite: McEwen, A. and Byrne, S.: 20 Years of Mars Science from MRO HiRISE, Europlanet Science Congress 2026, The Hague, The Netherlands, 7–11 Sep 2026, EPSC2026-169, https://doi.org/10.5194/epsc2026-169, 2026.
The High Resolution Stereo Camera (HRSC) onboard ESA’s Mars Express (MEx) has been a cornerstone of global Mars mapping for more than two decades. Originally designed for high-resolution, multi-spectral stereo imaging of the surface, HRSC is now also being used increasingly for systematic monitoring of the Martian atmosphere and weather, whose understanding is essential for scientific investigations and mission planning.
The atmosphere is highly dynamic, showing strong diurnal, seasonal and interannual variability and complex circulation patterns that couple surface and atmosphere. Long-term, multi-instrument observations are therefore required to place atmospheric processes into a global and seasonal context and to support future robotic and human exploration. Continuous monitoring improves knowledge of climate variability, dust activity, and cloud formation, all of which are relevant for landing site characterization and mission safety.
The long operational lifetime and orbital flexibility of Mars Express, combined with HRSC’s imaging capabilities, enable routine weather monitoring alongside continued high-resolution surface imaging. With map scales of 200 to 800 m/px, HRSC’s high-altitude observations bridge the gap between global-scale atmospheric imagers (e.g., MRO/MARCI, MEX/VMC, EMM/EXI) and very high-resolution cameras (e.g., TGO/CaSSIS). This intermediate scale allows detailed analyses of cloud and storm morphology, e.g., for size, speed, and altitude measurements, while still capturing the entire phenomenon.
The atmospheric monitoring campaign has yielded several hundred multi-temporal observations of a broad range of phenomena, including synoptic-scale dust storms and cyclones, local- to regional-scale dust lifting events, orographic clouds, atmospheric gravity waves, seasonal water- and CO₂-ice clouds, twilight clouds, and many other cloud types. In addition, HRSC’s high-resolution observations from lower altitudes expand the range of applications by enabling the detection and measurement of small-scale features such as dust devils [1].
Coordinated observation campaigns with the OMEGA spectrometer (Observatoire pour la Minéralogie, l'Eau, les Glaces et l'Activité) and the Visual Monitoring Camera (VMC), both on Mars Express, as well as the Colour and Stereo Surface Imaging System (CaSSIS) on the ExoMars Trace Gas Orbiter, provide complementary observations across multiple spatial and temporal scales, spectral ranges, and viewing geometries, enabling comprehensive multi-instrument studies [e.g. 1,2,3,4] (see Fig. 1–4 for comparative images of exemplary phenomena).
To facilitate data discovery and use, the HRSC Cloud Atlas [5] has been developed as a central portal providing curated atmospheric observations, quick-look imagery, and integrated metadata for analysis and outreach. HRSC atmospheric data are openly available through several platforms, including the ESA Planetary Science Archive [6], the FU Berlin map server [7], the MUTED database [8], the data products node of the HRSC team site [9], and DLR’s SFTP distribution service upon request. In addition, the comprehensive dataset of dust devil migration based on HRSC and CaSSIS data [1] is available via the BORIS repository [10]. This multi-platform approach ensures long-term preservation and rapid accessibility.
This presentation aims to raise awareness within the scientific community about the availability of these atmospheric monitoring data, describe their key characteristics, illustrate their scientific potential through selected examples, and provide guidance on how they can be accessed. Through dedicated observation strategies, streamlined processing, and improved data access, HRSC now contributes significantly to the multi-mission study of Martian weather.
[1] Bickel et al., SciAdv., 2025.
[2] Hernández-Bernal et al., JGR, 2021 and Hernández-Bernal et al., Nature Geoscience (under review).
[3] Sánchez-Lavega et al., Icarus, 2022.
[4] Brasil et al., JGR, 2025. and Brasil et al., JGR (under review).
[5] Tirsch et al., EPSC, 2024 and Tirsch et al., EPSC, 2025.
[6] HRSC @ PSA: https://psaftp.esac.esa.int/#/MARS-EXPRESS/HRSC/
[7] HRSC map server @ FU Berlin: https://maps.planet.fu-berlin.de/#map=3/2074498.35/0
[8] The Multi-Temporal Database of Planetary Image Data (MUTED): https://muted.uni-muenster.de/?z=3.5&d=101 and Heyer et al., PSS, 2018.
[9] HRSC team site @ DLR: https://hrscteam.dlr.de/public/
[10] CaSSIS and HRSC dust devil migration dataset @ Bern Open Repository and Information System (BORIS): https://doi.org/10.48620/87803.
Fig. 1. Typicall annular cyclone at Vastitas Borealis observed by HRSC (left) and VMC (right).
Fig. 2: The Arsia Mons Elongated Cloud (AMEC, [1]), is a special type of orographic clouds appearing each S-spring to summer at the volcano’s edifice. HRSC (left) and VMC (right).
Fig. 3: Weather or storm fronts on Mars as observed by HRSC (top) at Utopia Planitia and by CaSSIS (bottom) at Aonia Terra.
Fig. 4: The composition of the orographically induced lee waves at Phlegra Montes can be determined using spectral information from OMEGA data (left), which compare very well with the visual HRSC observations (right).
How to cite: Tirsch, D., Hauber, E., Matz, K.-D., Kersten, E., Hernández-Bernal, J., Sánchez-Lavega, A., Bickel, V., Thomas, N., Carter, J., Ligier, N., Brasil, F., Machado, P., Yazici, I. S., Cardesin, A., and Wilson, C.: Beyond Surface Mapping: MEx/HRSC’s New Approach to Monitor Atmospheric Weather on Mars, Europlanet Science Congress 2026, The Hague, The Netherlands, 7–11 Sep 2026, EPSC2026-1118, https://doi.org/10.5194/epsc2026-1118, 2026.
Since our first mutual radio occultation observations between Mars Express and the Trace Gas Orbiter in 2020, we have collected over 300 vertical profiles of the Martian ionosphere. After refining the observation planning and processing chain, we now collect two measurements per week. Mutual radio occultations have several unique benefits over conventional spacecraft-Earth radio occultations, such as the ability to capture the midday and midnight regions of the diurnal cycle, revealing hard-to-observe thermospheric temperature trends and the full response to solar flares.
This presentation will show the key scientific takeaways made possible by mutual radio occultation, and the current progress in extending the technique to surface sounding, similar to bistatic reflectometry, to derive surface dielectric properties.
This talk should also serve as an advertisement for the Planetary Science Archive’s release of the mutual radio occultation datasets to the wider scientific community, followed by a larger release of conventional TGO-Earth occultation datasets.
How to cite: Parrott, J., Cardesín-Moinelo, A., Svedhem, H., and Wilson, C.: ExoMars Trace Gas Orbiter Radio Science with using Spacecraft-Earth and Mutual Radio Links., Europlanet Science Congress 2026, The Hague, The Netherlands, 7–11 Sep 2026, EPSC2026-479, https://doi.org/10.5194/epsc2026-479, 2026.
Martian Moons eXploration [MMX] is a mission dedicated to addressing open science questions about Phobos and Deimos, with a particular emphasis on Phobos on which MMX is set to land a small rover and to perform sample collection for return on Earth.
The unique orbit (coined quasi-stationary orbit) followed by MMX around Phobos is designed to optimize science operations around and on Phobos and to maximize scientific return during the three years of operation in the Martian system.
Using MMX instruments to study Mars' atmosphere will be possible during various opportunity windows during which observing Phobos will not be possible while observing Mars will be favourable.
The unique combination of MMX's extensive instrumentation and equatorial orbital configuration is a unique opportunity to broaden our understanding of the water and dust cycle on Mars.
It is unusual yet stimulating for atmospheric science on Mars to envision observations for which the community has only few grasp and flexibility on the observed season, with some seasons not being covered given complex operations dedicated to Phobos.
There is actually always something interesting to observe in the Martian atmosphere, and many knowledge gaps to close, provided a detailed strategy is put forward. Furthermore, the original point of view offered by MMX reinforces the interest of any opportunity to observe the Mars' atmosphere that could be possible within the observation plan.
Based on past observations and global-climate modeling, we will show how the observing opportunities of Mars' atmosphere with MMX could offer observations of the aphelion cloud belt (including vertical transport of water vapor, e.g. Fedorova et al. JGR planets 2020, and cloud activity) and dust storms on Mars (of various types: local, A, C, Z, global dust events -- see statistics by Battalio and Wang Icarus 2021 and Leseigneur et al. 2026) including possible fast-developing dusty convective events akin to rocket dust storms.
To achieve this goal, MMX instruments for atmospheric science (Ogohara et al. Earth, Planets and Space 2022) feature the MIRS pushbroom near-infrared spectrometer with 10 km resolution per pixel and temporal resolution less than 1 hour (Barucci et al. 2025), as well as two cameras OROCHI (wide-angle, possible high-frequency monitoring) and TENGOO (telescopic, close-up views). MIRS may operate in nominal mode with continuous observation of the same area (with access to diurnal variability) global mapping mode of the sunlit hemisphere, tracking mode to study specific regions and transient events, as well as potential for limb scanning. The MSA ion analyzer offers perspectives to study atmospheric escape processes and their link to lower atmospheric processes, in particular dust storm activity (e.g., Heavens et al. Nature Geoscience 2018).
We will discuss possible observation plans for observing key features of the dust and water cycles on Mars, related to the aforementioned analysis. Other possible perspectives for Mars' atmospheric science include determining aerosol optical properties, mapping pressure using the CO2 absorption band, studying signatures in O2 dayglow, assessing CO concentration and trace gases, conducting exploratory science for instance about surface-atmosphere interactions.
Possible synergetic approaches of MMX observations, with past and present spectrometry and imagery to study Mars' atmosphere from orbit, or with in-situ landers and rovers, offer potentially fruitful approaches.
How to cite: Spiga, A., Bertrand, T., Leseigneur, Y., Gautier, T., Nakagawa, H., Aoki, S., and Imamura, T. and the Mars Science MMX Team: Mars Atmospheric Science with MMX, Europlanet Science Congress 2026, The Hague, The Netherlands, 7–11 Sep 2026, EPSC2026-676, https://doi.org/10.5194/epsc2026-676, 2026.
The Martian Moons eXploration (MMX) mission [1], led by the Japan Aerospace Exploration Agency (JAXA), is scheduled for launch in October 2026 and aims to investigate Phobos, Deimos, and the Martian atmosphere [2]. Among its payload, the MMX InfraRed Spectrometer (MIRS) [3] will observe the planet’s atmosphere in the infrared range (0.9–3.6 µm) [4], with the goal of improving our understanding of dust transport and water-ice cloud processes [5].
In preparation for the analysis of the first observations of the Martian atmosphere expected in autumn 2027, we simulate the I/F spectra that will be measured by MIRS in order to better constrain key aerosol (water ice and dust) properties [6], such as optical depth and particle radius. To this end, we use the pyRT_DISORT module from the DISORT (DIScrete-Ordinate-method Radiative Transfer) radiative transfer model [7,8] to generate the spectra across the MIRS spectral range.
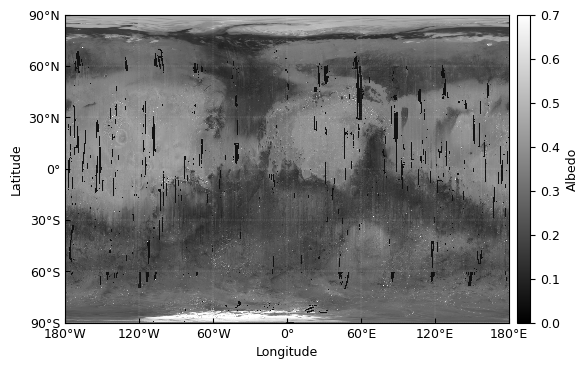
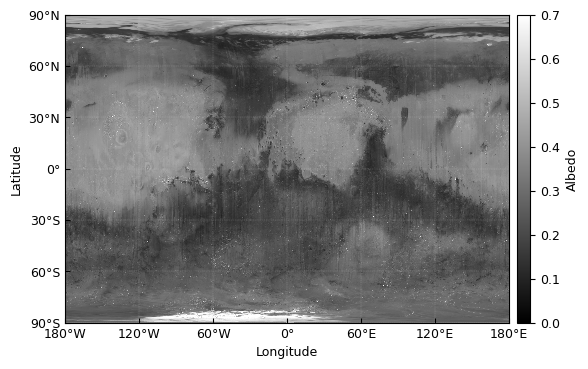
These simulations require an accurate map of the surface albedo for specific martian regions defined by their given latitude and longitude coordinates. Surface albedo is a critical input parameter, particularly under clear atmospheric conditions [9], as it strongly influences the simulated I/F spectra. We therefore rely on an albedo map derived from OMEGA/MEX observations at 1.08 µm [10] (fig.1), which lies within the MIRS spectral range. However, due to instrumental and observational constraints, approximately 3% of the map contains missing data, or bright artifacts. To address this, we reconstructed these pixels using a complementary visible-wavelength albedo dataset from MARCI/MRO (band 5, 0.718 µm) [11], selected for its spectral proximity and global coverage. The resulting completed albedo map (fig. 2) provides continuous albedo coverage over the entire simulations’ domains, enabling the generation of realistic spectra for all pixels. Instrument-like noise provided by the CNES is then added to reproduce conditions representative of future MIRS observations.

Figure 1 : OMEGA albedo map at 1.08 µm [10].

Figure 2 : Improved OMEGA albedo map at 1.08 µm, after the dark and bright pixels corrections.
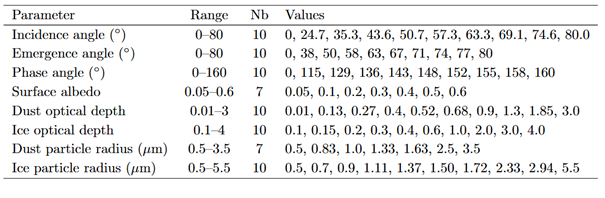
These synthetic spectra, to which we added noise, are then intended to serve as test observations for the development and validation of an inversion framework based on comparison with a precomputed Look-Up Table (LUT) (Table 1). The LUT itself is constructed from DISORT simulations through an extensive sensitivity analysis covering the main parameters controlling the signal, including surface albedo, aerosol optical depth, particle radius, and observation geometry (incidence, emission, and phase angles).

Table 1 : Final LUT defined from the sensitivity analysis.
The parameter values were chosen to ensure a uniform distribution of the resulting I/F spectra across the explored spectral domain, covering atmospheric conditions from optically thin (clear atmosphere) to increasingly optically thick (opaque atmosphere) cases. Preliminary tests have recently been initiated using a search algorithm inspired by face-recognition techniques, namely Facebook AI Similarity Search (FAISS) [12]. This approach is expected to enable efficient identification of the synthetic spectrum within the LUT that best matches an observed MIRS spectrum, and therefore retrieval of the associated aerosol properties.
Acknowledgments :
We thank M. J. Wolff and S.W. Lee for sharing the MARCI albedo map (personal communication). We thank the MMX JAXA teams for their efforts and CNES for the financial support and collaboration to build the MIRS instrument.
References :
[1] Kuramoto K. et al., Earth, Plan. and Space, 74, 12.
[2] Nakamura T. et al., Earth Plan. and Space, 2021, 73.
[3] Barucci M. A. et al., Earth, Plan. and Space, 2021, 73, 211.
[4] Barucci M. A. et al., Progress in Earth and Planetary Science, 2025, 12, pp.69.
[5] Määttänen A. et al., Space Science Reviews. 2024. 220. 10.1007/s11214-024-01092-z.
[6] Leseigneur Y. et al. (2025) EPSC-DPS2025-1672
[7] Stammes K. et al., Applied Optics, 1988, 27, 2502-2509.
[8] Connour K. and Wolff M. (2022) pyRT_DISORT: A pre-processing front-end to help make DISORT simulations easier in Python, version 1.0.0.
[9] D.F. Wellington, J.F. Bell, Icarus, Volume 349, 2020, 113766, ISSN 0019-1035.
[10] Ody A. et al., Journal of Geophysical Research, 2012, Vol. 117, E00J14.
[11] Bell, J. F.III, et al., J. Geophys. Res., 2009, 114, E08S92.
[12] M. Douze et al., "The Faiss Library," in IEEE Transactions on Big Data, vol. 12, no. 2, pp. 346-361, April 2026.
How to cite: Le Bail, G., Lasue, J., Stcherbinine, A., Leseigneur, Y., Bertrand, T., Gautier, T., and Théret, N.: Preparing MMX InfraRed Spectrometer (MIRS) observations : Simulations of the Martian Atmosphere for Aerosol Retrieval, Europlanet Science Congress 2026, The Hague, The Netherlands, 7–11 Sep 2026, EPSC2026-581, https://doi.org/10.5194/epsc2026-581, 2026.
Mars Express revealed that ultraviolet aurorae could occur in the Mars atmosphere, despite lacking a global magnetic field. Then, MAVEN discovered that these aurorae are much more frequent than expected with Mars Express. MAVEN showed that these ultraviolet aurorae could either be localized and caused by electrons or, sometimes, much wider and due to proton precipitations related to SEP events. Aurorae have also been observed by MAVEN in regions without any crustal magnetic field. More recently, EMM captured stunning synoptic views of the Mars nightside in the UV and EUV, showing that auroral features can occur everywhere on the planet, at any time, and are highly variable in time and space. Finally, the Perseverance rover was able to acquire the first signature of a visible aurora, corresponding to the atomic oxygen green line emission at 557.7 nm. The next step is now to get highly sensitive images and movies of the visible aurorae, which is the goal of M-AC, the Mars Aurora and dust Camera on board M-MATISSE. Such observations will enable to assess the role of the magnetic field in driving the formation of aurorae, and to identify the profile of energy deposition of the particles.
M-MATISSE (Mars–Magnetosphere ATmosphere Ionosphere and Space-weather SciencE) is an ESA Medium-class mission (M7) candidate, in competition with two other missions. The selection will be made in June 2026. The goal of M-MATISSE is to understand how the Martian Magnetosphere, Ionosphere, and Thermosphere (M-I-T) system responds to space weather variations with coordinated in situ and remote sensing instruments onboard twin spacecraft.
M-MATISSE will carry the Mars Aurora and dust Camera (M-AC). One of the two spacecraft will host a near ultraviolet (NUV) camera, while the other will be equipped with the first visible camera to observe the Martian aurorae. The NUV camera will measure the CO2+ Fox-Duffendack-Barker (FDB) emission at 367.0-393.2 nm and the visible camera will target the atomic oxygen green line at 557.7 nm. By combining the NUV and visible channels, M-AC will be able to measure the auroral emissions for both the electron (NUV and visible cameras) and proton (NUV) aurorae and to distinguish between the disk reflectance of water ice clouds (NUV) and that of dayside dust (visible). The wide 100° field of view of M-AC will enable coverage of areas larger than 200 km, even at periapsis, with a spatial resolution better than 10 km, and a high temporal resolution down to 1-2 seconds.
M-AC will therefore be an essential instrument to measure the signature of the precipitations of energetic particles into the Mars atmosphere, to assess the role of the magnetic field in driving these precipitations, and to identify the profile of energy deposition. M-AC will also measure the disk reflectance in the dayside to characterize the spatial distribution and evolution of atmospheric dust, an important driver of the state of the Mars thermosphere.
How to cite: Soret, L., Nakagawa, H., Harada, Y., Nakamura, Y., Leblanc, F., and Sanchez-Cano, B. and the M-AC team: Observing the Mars aurorae with M-MATISSE and the Mars Aurora and dust Camera (M-AC), Europlanet Science Congress 2026, The Hague, The Netherlands, 7–11 Sep 2026, EPSC2026-223, https://doi.org/10.5194/epsc2026-223, 2026.
Please decide on your access
Please use the buttons below to download the supplementary material or to visit the external website where the presentation is linked. Regarding the external link, please note that Copernicus Meetings cannot accept any liability for the content and the website you will visit.
Forward to presentation link
You are going to open an external link to the presentation as indicated by the authors. Copernicus Meetings cannot accept any liability for the content and the website you will visit.
We are sorry, but presentations are only available for conference attendees. Please register for the conference first. Thank you.
Mars 2020 Perseverance rover is currently exploring Jezero Crater on Mars, which contains an ancient lake-delta fan system. Since its landing in 2021 the rover has investigated different parts of the Jezero crater including the crater floor, the delta fan, the crater margin (Margin unit’) and the Neretva Vallis channel, identifying several different potentially habitable environments. Currently the rover is exploring the crater rim, which contains some of oldest rocks on Mars, when Mars might have been its most habitable.
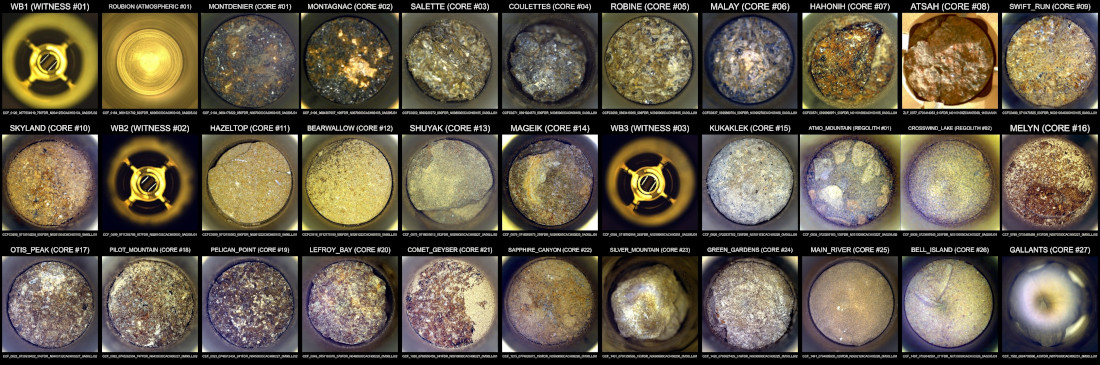
One of Perseverance’s primary science goals is to collect samples for potential return to Earth (Farley et al. 2020). Since February 2021, Perseverance has sealed 33 tubes containing 27 rock cores, 2 regolith samples, one atmosphere sample and three witness tubes (Fig. 1). Of the samples collected, several collected from the fan front, the Margin unit and the Neretva Vallis channel have large potential for answering questions about past climate, habitability and the potential for life on Mars.
The rock cores collected at the fan front and Neretva Vallis are fine-grained clay-rich sedimentary rocks that were likely deposited in a lacustrine/deltaic environment (Bosak et al. 2024; Hurowitz et al. 2025). The fine-grained and phyllosilicate rich nature of these samples are beneficial for the preservation of biosignatures. The Neretva Vallis sample contains tantalizing signatures including organic material and phosphate and sulfide-rich reaction fronts that potentially could have been produced by life (Hurowitz et al. 2025; Murphy et al. accepted). Other more coarse-grained sedimentary samples, such ones collected at the fan top samples, which were likely deposited in a river setting, could inform about a Martian source to sink system, contain lithologies from greater Nilli Fossae area and be used for paleomagnetism studies.
The rock cores collected at the Margin unit contain abundant carbonate and silica which likely were formed by carbonation and serpentinization of ultramafic rocks (Williford et al. 2026). In addition to trapping CO2 and thus providing information about the past atmosphere and climate on Mars, this process could have provided energy and a habitat for potential microbes (Siljeström et al. in prep). Microcrystalline carbonates and silica are also known to preserve biosignatures.
The rock cores have also been collected at the crater rim including a serpentine sample and a phyllosilicate-rich sample will inform about potential habitability during the Noachian. The serpentine rock, collected at a potential megablock, is dominated by minerals formed from serpentinization, informing about Noachian water-rock interaction and providing energy for potential microbes. The phyllosilicate-rich sample was collected from an altered likely Noachian basement and could provide insights into water-rock interactions and a potentially habitable environment in Mars’ most ancient past.
In addition, the rock cores from the crater floor and rim which will be critical for constraining the timing of different events on Mars including aqueous activity in Jezero Crater and when and for how long Mars was habitable (Farley et al. 2022). They will also inform about Mars’ igneous history and potential impact processes on Mars.
Perseverance will continue exploring the crater rim and collecting samples for next couple of years, expanding the number of samples and that can be answered, if returned to Earth.

References:
Bosak, T. et al. (2025) AGU Advances, 5, e2024AV001241.
Farley K.A. et al. (2020) Space Science Reviews 216, 142.
Farley, K.A. et al. (2022) Science 377, eabo2196.
Hurowitz J.A., et al. (2025) Nature 645, 332–340.
Murphy A.E., et al. accepted, Science Advances
Siljeström, S. et al. in prep., JGR-Planets
Williford, K. et al. (2026) Science 391, eadu8264.
How to cite: Siljeström, S., Herd, C., Bosak, T., Farley, K., Stack, K., Benison, K., Czaja, A., Debaille, V., Hausrath, E., Hickman-Lewis, K., Mayhew, L., Sephton, M., Shuster, D., Simon, J., and Zorzano, M.-P.: The returned sample science of the samples collected by NASA Perseverance rover at Jezero Crater, Mars, Europlanet Science Congress 2026, The Hague, The Netherlands, 7–11 Sep 2026, EPSC2026-444, https://doi.org/10.5194/epsc2026-444, 2026.
Introduction: The Perseverance rover landed at Jezero crater on February 18th, 2021. The choice of this landing site for the Mars2020 mission was motivated by its geological significance and the potential insights into Mars’ past habitability and search for past life. Indeed, Jezero crater once contained an ancient lake, with a very well-preserved delta on the Western edge of the crater, making it an ideal location to search for signs of ancient microbial life. The Perseverance rover has four main objectives: 1. Search for traces of past microbial life; 2. Characterize Mars’s climate and geology ;3. Collect samples for later return to Earth; 4. Test technologies for future human exploration missions.
Perseverance is equipped with seven scientific instruments, including the SuperCam suite [1,2]. SuperCam combines several remote-sensing techniques in order to study both the Martian surface and its atmosphere: 1. The LIBS (Laser-Induced Breakdown Spectroscopy) technique gives access to the chemical composition of the targets (up to 15m). All major elements are quantified [3] and the quantification of minor elements is ongoing [4]; 2. The Raman spectroscopy enables the identification of major mineral phases [5]; 3. The VISIR spectroscopy gives access to the mineralogy, via the reflection of sunlight to access the frequency of molecule bond vibrations of the targets [6]; 4. The Remote Micro Imager (RMI) uses a CMOS camera, with an angular size of 10 microradians and a resolution of 50 microradians; 5. The microphone records air pressure fluctuations from 20 Hz to 12.5 or 50 kHz, at sampling rates of 25 or 100 KHz, respectively. SuperCam performs remote observations around the rover allowing a large number of acquisitions. Indeed, when analyzing a target to get access to its chemistry and/or mineralogy, several point analyses are performed when doing LIBS, Raman and/or VISIR, in order to assess its homogeneity. Moreover, the atmospheric studies require recurrent observations, either at similar times (passive measurements) or at different times of the day (microphone) to investigate potential seasonal effects or atmospheric processes.
As of sol 1843, Perseverance has driven more than 43 km, has exited the crater and is now exploring the Lac De Charmes area, which is located on the outer rim of the Jezero crater.
SuperCam efforts: SuperCam addresses all the main objectives of the Mars2020 mission.
Geological context and astrobiological interest During the crater floor campaign, two units were investigated: Máaz and Séítah [7]. Both units correspond to igneous material, with successive lava flows at Máaz [8] while Séítah represents an olivine-rich cumulate [9]. The delta front campaign revealed a diversity of secondary material, suggesting either different sources or different paleo-environments [10]. In situ investigation of the delta revealed the lake level fluctuations along with the investigation of the fluvial deposits including flood deposits [11]. Still on the delta top, several olivine-rich boulders have been hypothesized to be potential mantle rocks excavated by successive impacts [12]. Perseverance was able to confirm the enrichment in carbonates in the Margin Unit (intimately mixed with olivine), even though the origin of these rocks is still debated. Nevertheless, we have been able to constrain the formation process of the carbonates constituting an important part of these rocks [13]. SuperCam observations at Neretva Vallis have helped constraining the different environments where the potential biosignatures that have been detected [14-16]. SuperCam has also been used to investigate the stability of hydrated minerals freshly exposed at the surface in abraded targets [17].
Since 2025, Perseverance has started to climb the Jezero crater rim, where a diversity of rocks has been observed [18,19]. Some of them were float rocks but revealed an ancient hydrothermal system thanks to the observations of more or less crystallized hydrated Si phases [20], whereas other float rocks suggested magmatic or metamorphic processes, thanks to the detection of corundum in plagioclase, with the SuperCam time-resolved luminescence capability [21]. The crater rim gives access to the oldest terrains never explored in situ before. Some of them suggest that Mars underwent important serpentinization process early in Mars history, with important implications concerning the crust [22]. SuperCam is therefore of prime importance to help in the selection process of the samples for planned Mars sample return [23].
Atmospheric science. The SuperCam microphone has, for the first time, revealed the acoustic landscape of Mars [24] and shed light on the unique sound propagation properties in a thin CO₂ atmosphere [25] Above all, it provides a particularly effective dataset for studying rapid atmospheric fluctuations, specifically the characterization of the thermal turbulence field through the propagation of acoustic wave in inhomogeneous medium [26] and the properties of the dissipative regime [27] in which molecular viscosity dissipates the turbulent kinetic energy into heat. The microphone also revealed the presence of triboelectric discharges in dust devils and dust storms, with important implications for the surface and atmospheric chemistry (e.g., for the oxidants production). Passive sky observations are used to investigate the variability of molecular oxygen in the Martian atmosphere [28], as well as the physical properties of the dust and water ice aerosols [29]. Atmospheric observations have also contributed to the discovery of a Martian aurora from the SuperCam and MastCam-Z instruments [30].
[1] Maurice et al., (2021) [2] Wiens et al., (2021) [3] Anderson et al., (2022) [4] Gabriel et al., (2024) [5] Lopez-Reyes et al., (2025) [6] Fouchet et al., (2022) [7] Wiens et al., (2022) [8] Udry et al., (2022) [9] Beyssac et al., (2023) [10] Dehouck et al., (2024) [11] Mangold et al., (2024) [12] Beyssac et al.,(2026) [13] Clavé et al., (2026) [14] Hurowitz et al., (2025) [15] Mandon et al., this meeting [16] Manelski et al., (2026) [17] Connell et al., (2025) [18] Quantin-Natf et al., (2026) [19] Bedford et al., (2026) [20] Beck et al., (2025) [21] Ollila et al., (2026) [22] Quantin-Nataf et al, (2025) [23] Siljeström et al., this meeting [24] Maurice et al (2022) [25] Chide et al., EPSL (2023) [26] Chide et al., (2023) [27] Stott et al., (2026) [28] McConnochie et al., this meeting [29] Stcherbinine et al., this meeting [30] Knutsen et al. (2025).
How to cite: Cousin, A. and the SuperCam team: Overview of results of the SuperCam Instrument onboard Perseverance , Europlanet Science Congress 2026, The Hague, The Netherlands, 7–11 Sep 2026, EPSC2026-97, https://doi.org/10.5194/epsc2026-97, 2026.
At Jezero crater, Mars, the MEDA instrument on the Perseverance rover provides meteorological measurements of unprecedented quality and cadence [1-2]. Here, we present an investigation of the atmospheric turbulence in the Martian surface layer (SL), which is the lower portion of the planetary boundary layer [3]. Turbulence parameterization schemes aim to reduce the study of near-surface turbulence to a few variables related to the transport of heat and momentum [4]. We use MEDA temperature and wind data to calculate the scaling parameters for shear-stress at the surface (friction velocity), near-surface buoyancy (temperature scale), and typical SL depths (Obukhov Length). Friction velocities, temperature scales, and Obukhov Length are calculated in 5-minute windows when MEDA data of ground temperature, air temperature, and wind speed are available. We present these values up to sol 313 of the Mars 2020 mission (LS 22.5-153º).
We estimate these SL scaling parameters by following turbulence parameterization schemes previously used on Mars [5-7], which build on the Monin-Obukhov Similarity Theory (MOST) [8]. MOST assumes flat and homogeneous terrain, and hypothesizes that several atmospheric magnitudes, such as gradients and variances of some atmospheric properties, can be expressed in terms of universal functions that only depend on the atmospheric stability. This procedure is useful for estimating surface layer turbulence parameters, while direct measurements of turbulent fluxes are not yet available for Mars. The latter would require vertical wind data, simultaneous horizontal wind measurements at different heights and a sampling frequency greater than 1 Hz capturing the whole spectral range of turbulence [9]. We run atmospheric simulations centered at Jezero crater [10-11] to further evaluate the order of magnitude of SL turbulence scaling parameters in wider spatial scales.
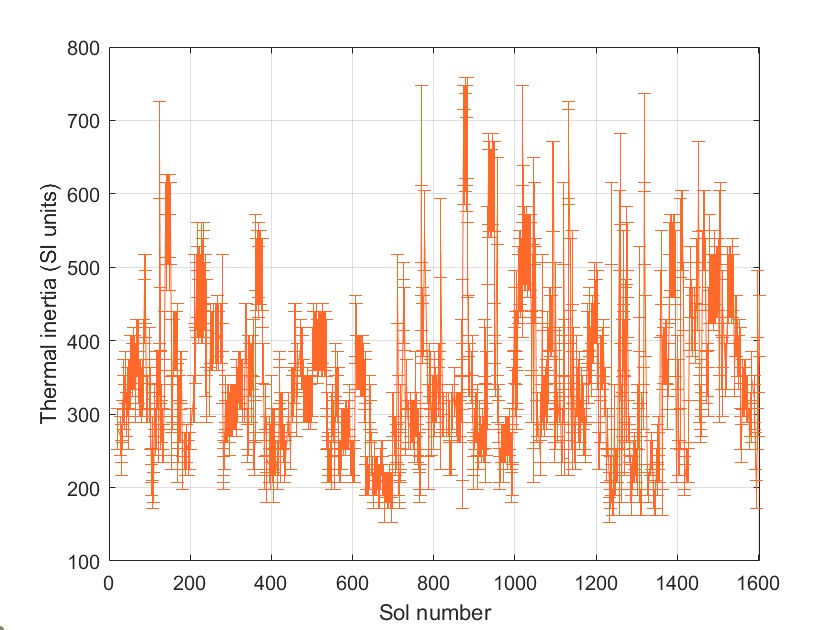
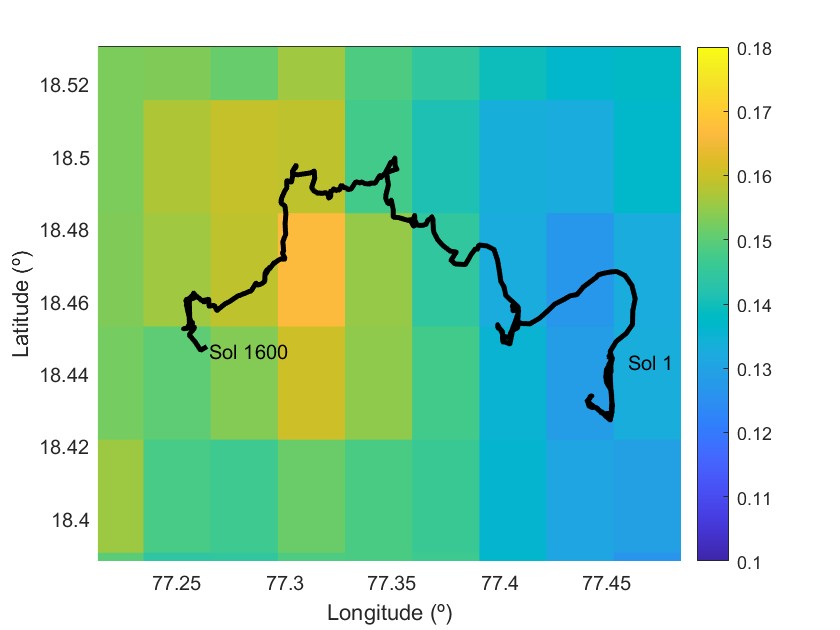
The friction velocity, important for dust lifting thresholds and aeolian activity, is on the order of 0.6-0.9 m/s. The scale of thermal fluctuations can be as high as 6 K, resulting in shallow surface layers with daily maximum depths of 10-55 m. The deepest surface layers develop over high thermal inertia terrains, which highlights the local nature of the SL and the importance of accounting for horizontal heterogeneity. The order of magnitude of these parameters is in line with values found from atmospheric simulations and previous studies at other locations on Mars. We discuss necessary improvements to the current turbulence parameterizations on Mars. Constraining the SL depth at Jezero is relevant to contextualize different atmospheric studies, quantify surface-atmosphere interactions, and to inform the design and operation of future Martian aerial vehicles.
References
[1] Rodriguez-Manfredi, J. A., et al. (2021). The Mars Environmental Dynamics Analyzer, MEDA. A suite of environmental sensors for the Mars 2020 mission. Space science reviews, 217(3), 1-86. DOI: 10.1007/s11214-021-00816-9.
[2] Rodriguez-Manfredi, J. A., et al. (2023). The diverse meteorology of Jezero crater over the first 250 sols of Perseverance on Mars. Nature Geoscience, 16. DOI: 10.1038/s41561-022-01084-0.
[3] Stull, R. B. (1988). An Introduction to Boundary Layer Meteorology. Springer. DOI: 10.1007/978-94-009-3027-8
[4] Kaimal, J. C., Finnigan, J. J., (1994). Atmospheric Boundary Layer Flows: Their Structure and Measurement. Oxford University Press. ISBN: 978-0195062397.
[5] Sutton, J. L., et al. (1978). Diurnal Variations of the Martian Surface Layer Meteorological Parameters During the First 45 Sols at Two Viking Lander Sites. Journal of the Atmospheric Sciences, 35(12). DOI: 10.1175/1520-0469(1978)035<2346:dvotms>2.0.co;2.
[6] Tillman, J. E., et al. (1994). The boundary Layer of Mars: Fluxes, Stability, Turbulent Spectra, and Growth of the Mixed Layer. Journal of the Atmospheric Sciences, 51(12). DOI: 10.1175/1520-0469(1994)051<1709:tblomf>2.0.co;2.
[7] Martínez, G. M., et al. (2009). Characterization of the Martian Surface Layer. Journal of the Atmospheric Sciences, 66(1). DOI: 10.1175/2008JAS2765.1.
[8] Monin, A, Obukhov, A, (1954). Osnovnye zakonomernosti turbulentnogo peremeshivanija v prizemnom sloe atmosfery (basic laws of turbulent mixing in the atmosphere near the ground). Trudy Geofizicheskogo Instituta, Akademiya Nauk SSSR, 24(151).
[9] Read, P. L., et al. (2017). The Martian Planetary Boundary Layer. In Haberle, et al. (Eds.). The Atmosphere and Climate of Mars (Cambridge Planetary Science, pp. 172–202). Cambridge University Press. DOI: 10.1017/9781139060172.007
[10] Forget, F., et al. (1999). Improved general circulation models of the Martian atmosphere from the surface to above 80 km. Journal of Geophysical Research, 104(E10). DOI: 10.1029/1999JE001025.
[11] Spiga, A, Forget, F, (2009). A new model to simulate the Martian mesoscale and microscale atmospheric circulation: Validation and first results. Journal of Geophysical Research, 114(E2). DOI: 10.1029/2008JE003242
Acknowledgements
We acknowledge the operations and hardware teams from the Mars 2020 project. This project is carried out as part of the NASA Mars exploration program in the US. A.M. is a postdoctoral researcher funded by Programa Posdoctoral de Perfeccionamiento de Personal Doctor del Gobierno Vasco. A.M., R.H., A.S.L. and A.S. are supported by grant PID2023-149055NB-C31 funded by MICIU/AEI/10.13039/501100011033/ and FEDER, UE. GM acknowledges funding from grant PID2024-161247OB-C31 funded by MICIU/AEI/ 10.13039/501100011033 and by ERDF/EU.
How to cite: Munguira, A., Martínez, G. M., Sánchez-Lavega, A., Hueso, R., Bertrand, T., and Stott, A. E.: Surface Layer Turbulence Scaling Parameters at Jezero Crater, Mars, Europlanet Science Congress 2026, The Hague, The Netherlands, 7–11 Sep 2026, EPSC2026-71, https://doi.org/10.5194/epsc2026-71, 2026.
Dust devils are convective vortices that produce intense winds able to lift dust from the surface [1]. On the cold and tenuous Martian atmosphere, dust devils are more frequent than on Earth and are frequently observed from spacecraft imagery and surface missions. The frequency, activity and overall properties of dust devils at different Martian location follow a daily and seasonal cycle driven by the characteristics of the planetary boundary layer and the local terrain. Perseverance, the rover of the Mars 2020 mission, has observed intense dust devil activity in its landing site at the Jezero area and the surrounding locations explored by Perserverance ever since the start of the mission in Feb. 2021 [2, 3]. Currently, data from Perseverance include observations obtained over more than 1800 sols or nearly 3 Martian Years. Here we analyze in situ meteorological data obtained by the MEDA instrument onboard Perseverance. MEDA is a set of meteorological sensors that obtain high-cadence observations of atmospheric variables including among others atmospheric pressure and temperature [4, 5]. MEDA is also equipped with wind sensors that started to accumulate damage from impacts with dust grains after sol 313 [3], but continued to be operated pending a recalibration of the data after that sol. MEDA is also equipped with the Radiation and Dust Sensor (RDS) [6], a series of photodiodes oriented in several directions that identify the presence of dust devils from the increase or reduction of light produced by the aerosols in the moving dust devil [7]. All of these sensors, including the progressively damaged wind sensors acquire data with a cadence of 1 Hz [5], but can be operated separately to save power and data volume, implying that MEDA measurement sessions may not have wind data during part of the observations with other sensors.
Here we focus our attention on the properties of the most intense vortices observed by MEDA. The close passage of convective vortices are identified by the pressure drop recorded by the pressure sensor. Events with pressure drops larger than 5.0 Pa are extreme in their characteristics. They generally include warm cores up to 10 K warmer than the environment from MEDA’s Air Temperature Sensors, and contain large amounts of dust from the simultaneous observations with the RDS. These events correspond to the close passage of very intense dust devils of a scale much stronger than a previous case imaged while passing through Perseverance [8]. The geometry of the encounters with these dust devils, and the overall dust content of the vortices are investigated from the analysis of the light signals obtained by the different lateral and vertical sensors in the RDS. Because convective vortices are near cyclostrophic equilibrium, these intense pressure drops should also be accompanied by fast winds that should change in direction and intensity while the vortex approaches and separates from Perseverance. We here show that a new retrieval of wind data being tested by the MEDA team produces additional results about the geometry of the encounter that can be independently tested with the signals recorded by the RDS. We compare and present data simultaneously obtained by all MEDA sensors during the passage of the most intense vortices observed over 1800 sols. We show the observed and derived characteristics of record events in terms of their internal pressure drop, the wind intensity, the internal temperatures in the vortex and the amount of dust in the dust devil walls. We also show the seasonal and local terrain context for the emergence of these extremely intense dust devils.
REFERENCES
[1] Balme, M., and R. Greeley (2006), Dust devils on Earth and Mars, Rev. Geophys., 44, RG3003, doi:10.1029/2005RG000188.
[2] Newman, C. E., et al. (2022). The dynamic atmospheric and aeolian environment of Jezero crater, Mars. Science Advances, 8(21), eabn3783. https://doi.org/10.1126/sciadv.abn3783
[3] Hueso, R., et al. (2023). Convective vortices and dust devils detected and characterized by Mars 2020. Journal of Geophysical Research: Planets, 128, e2022JE007516. https://doi.org/10.1029/2022JE007516
[4] Rodriguez-Manfredi, J.A., et al. (2021) The Mars Environmental Dynamics Analyzer, MEDA. A Suite of Environmental Sensors for the Mars 2020 Mission. Space Sci Rev 217, 48. https://doi.org/10.1007/s11214-021-00816-9
[5] Rodriguez-Manfredi, J.A., et al. (2023). The diverse meteorology of Jezero crater over the first 250 sols of Perseverance on Mars. Nat. Geosci. 16, 19–28. https://doi.org/10.1038/s41561-022-01084-0
[6] Apestigue, V., et al. (2022). Radiation and Dust Sensor for Mars Environmental Dynamic Analyzer Onboard M2020 Rover. Sensors, 22(8), 2907. https://doi.org/10.3390/s22082907
[7] Toledo, D., et al. (2023). Dust devil frequency of occurrence and radiative effects at Jezero crater, Mars, as measured by MEDA Radiation and Dust Sensor (RDS). Journal of Geophysical Research: Planets, 128, e2022JE007494. https://doi.org/10.1029/2022JE007494
[8] Murdoch, N. et al. (2022). The sound of a Martian dust devil. Nat Commun. 13, 7505. https://doi.org/10.1038/s41467-022-35100-z
How to cite: Hueso, R., Navarro, S., Toledo, D., Apestegui, V., Munguira, A., Sánchez-Lavega, A., Stott, A., Martínez, G., Rodríguez-Manfredi, J. A., Newman, C. E., and Lorenz, R.: Extreme Dust Devils at Jezero from Mars 2020 MEDA data, Europlanet Science Congress 2026, The Hague, The Netherlands, 7–11 Sep 2026, EPSC2026-338, https://doi.org/10.5194/epsc2026-338, 2026.
Dust plays a fundamental role in shaping the dynamics of the Martian atmosphere. By interacting with solar radiation through scattering and absorption, it modifies atmospheric heating rates at the surface and aloft, driving buoyancy and vertical mixing processes. These thermally induced gradients contribute to the development and modulation of turbulent motions across different atmospheric layers. In turn, turbulence influences the lifting, transport, and redistribution of dust particles, leading to a tightly coupled, non-linear feedback system between radiative forcing and atmospheric dynamics.
The Radiation and Dust Sensor (RDS) [1], part of the Mars Environmental Dynamics Analyzer (MEDA) [2] payload onboard the Mars 2020 Perseverance rover, is a radiometer that measures downwelling solar irradiance at the surface across multiple spectral bands at a frequency of 1Hz. Rapid temporal fluctuations in the measured irradiance are associated with variations in dust concentration induced by atmospheric turbulence.
Most previous studies of Martian atmospheric turbulence have relied on near-surface in situ measurements (e.g. wind and temperature sensors) substantially limiting our understanding of Martian turbulence at higher altitudes. In contrast, the RDS radiometric signal, shaped by scattering along the zenith-pointing optical path, is sensitive to dust fluctuations at different altitudes, thereby enabling access to turbulent processes that are otherwise difficult to observe directly. Here, we study RDS irradiance fluctuations time series to characterize their spectral properties in the context of atmospheric turbulence; we analyze inertial-range behavior and introduce a synthetic turbulence modeling framework that, by treating dust as a passive and perfect tracer, allows us to directly examine how the RDS signal responds to atmospheric turbulence. In particular, this approach makes it possible to assess how variations in turbulent behavior across different layers, together with the structure of the vertical atmospheric profile, influence both the fluctuations of the RDS signal and the characteristics of its inertial range.
References:
[1] Apestigue, V., et al. “Radiation and Dust Sensor for Mars Environmental Dynamic Analyzer
Onboard M2020 Rover”. Sensor 22.8 (2022): 2907.
[2] Rodriguez-Manfredi, Jose Antonio, et al. “The Mars Enviromental Dynamics Analyzer, MEDA. A suite of enviromental sensors for the Mars 2020 mission.” Space science reviews 217.3 (2021): 1-86.
How to cite: Lorenzo-Corvo, C., Toledo, D., Apestigue, V., Arruego, I., Rodríguez-Veloso, R., Munguira, A., Martínez, G. M., Hueso, R., Lemmon, M. T., and Rodríguez-Manfredi, J. A.: Characterization of Martian atmospheric turbulence using irradiance measurements from MEDA Radiation and Dust Sensor (RDS), Europlanet Science Congress 2026, The Hague, The Netherlands, 7–11 Sep 2026, EPSC2026-385, https://doi.org/10.5194/epsc2026-385, 2026.
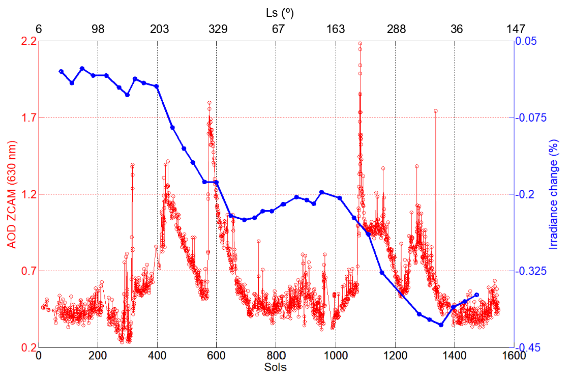
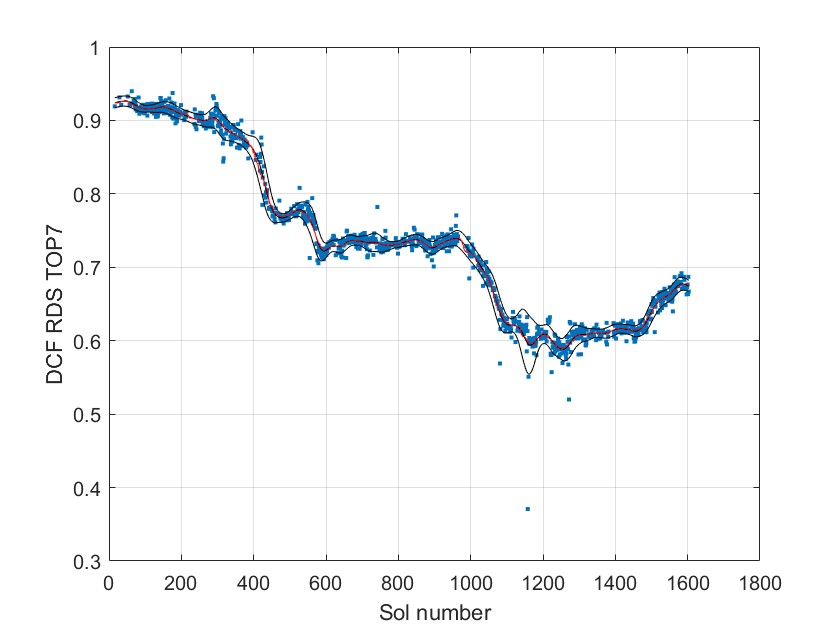
Aerosols on Mars are a primary element for studying the interaction between the solar radiation and the atmosphere and surface. Depending on properties such as aerosol number density, particle radius, or refractive index, the aerosols can provide positive or negative radiative feedbacks on the atmospheric dynamics. Previous studies have revealed large temporal and spatial variability in the aerosol optical properties, emphasizing the need for continuous monitoring throughout the day and at multiple locations. To address these measurements, the Radiation and Dust Sensor (RDS) [1] was included as part of the Mars Environmental Dynamics Analyzer (MEDA) [2] payload onboard the Perseverance rover of the Mars 2020 mission. The RDS instrument is composed of two sets of eight photodiodes (RDS-DP) and a sky-pointed camera (RDS-SkyCam). One set, oriented toward the zenith, captures radiation from 190 to 1200 nm, while the other, inclined 20° above the horizon at 45° azimuthal intervals, samples a single wavelength. The analysis of these observations, through a radiative transfer model [3], allows for the retrieval of key aerosol parameters such as aerosol opacity at different wavelengths and particle radius. However, the continuous deposition of dust over the sensors [4], since the beginning of the mission, introduces modifications in their optical response. In particular, the zenith-pointed photodiodes require angular response calibration due to the progressive accumulation of dust on their optical surfaces. Here, we present the calibration approach developed for the mission, essential to ensure the accuracy of aerosol property retrievals and reliable long-term atmospheric monitoring. Figure 1 shows the temporal evolution of the RDS-TOP 7 irradiance change derived from our calibration alongside Matscam-Z opacities [5], highlighting the impact of atmospheric conditions. In addition, we report ongoing radiative transfer retrievals of aerosol (dust and ice) optical properties during the first two years of the Mars 2020 mission. The relationship between vortex population and dust deposition rates will also be discussed.

Figure 1. Temporal evolution of the irradiance change measured by MEDA-RDS TOP 7 (blue) of the Mars 2020 mission at Jezero Crater, compared with atmospheric opacity at 630 nm measured by Mastcam-Z (red) over the first two years.
References:
[1] Apestigue, V., et al. “Radiation and Dust Sensor for Mars Environmental Dynamic Analyzer
Onboard M2020 Rover”. Sensor 22.8 (2022): 2907.
[2] Rodriguez-Manfredi, Jose Antonio, et al. “The Mars Enviromental Dynamics Analyzer, MEDA. A suite of enviromental sensors for the Mars 2020 mission.” Space science reviews 217.3 (2021): 1-86.
[3] Toledo, D., et al. “Measurement of aerosol optical depth and sub-visual cloud detection using the optical depth sensor (ODS)”. Atmospheric Measurement Techniques 9.2 (2016): 455-467.
[4] Vicente-Retortillo, A., et al. “Dust Accumulation and Lifting at the Landing Site of the Mars 2020 Mssion, Jezero Crater, as Observed From MEDA.” Geophysical Research Letters 51 (2024).
[5] Lemmon, M. T. Et al. “Dust, sand and winds within an active Martian storm in Jezero crater.” Geophysical Research Letters, 49.17 (2022): 0094-8276.
How to cite: Rodriguez-Veloso, R., Toledo, D., Apestigue, V., Arruego, I., Lorenzo-Corvo, C., Martínez, G. M., Lemmon, M. T., Jiménez-Martín, J. J., García-Menéndez, E., Hueso, R., Smith, M. D., Vicente-Retortillo, Á., Viudez-Moreiras, D., and Rodríguez-Manfredi, J. A.: Aerosol Optical Properties and Dust Deposition as observed by MEDA Radiation and Dust Sensor (RDS) at Jezero Crater, Mars, Europlanet Science Congress 2026, The Hague, The Netherlands, 7–11 Sep 2026, EPSC2026-378, https://doi.org/10.5194/epsc2026-378, 2026.
Zonal wavenumber one (s = 1) Kelvin mode (K1) is one of the atmospheric normal modes. In the Martian atmosphere, the theoretical K1 wave period is ~22.8 Mars hours, which is quite close to a diurnal period. Thus, previous studies suggested that K1 becomes near resonance with s = 1 eastward nonmigrating tide (DE1). However, there have been few studies that focus on K1 and directly detect it in observational data, although numerous studies have investigated DE1.
The purpose of this study is to extract K1 using InSight surface pressure measurements and examine its seasonal variations in terms of amplitudes and frequency. The InSight data used in this study span more than one Martian year from late in Mars Year (MY) 34 to the beginning of MY36 including the C dust event in MY34 (C34), which impacted considerably the global meteorology. To distinguish K1 from diurnal signals, Singular Spectrum Analysis (SSA) was used. SSA is commonly used for the analysis of non-stationary and quasi-periodic signals. This method allows us to separate the trend, quasi-periodic signal components, and noise.
In addition to the strong diurnal signals (S1), SSA decomposition captured quasi-diurnal signals whose period is ~22 Mars hours. Although we cannot separate the propagation direction using only one point observation, K1 is the only mode that corresponds to a period slightly shorter than 24 Mars hours. Thus, we regarded this signal with the period of ~22 Mars hours as K1. During C34, a pronounced K1 signal was detected. The amplitudes of K1 and S1 reached their maximum simultaneously, with peak values of ~8 Pa and ~39 Pa, respectively. Near the peak time, K1 and S1 were in phase, and interestingly the S1 period shortened to ~23.5 Mars hours. Afterward, K1 rapidly decayed and the S1 period recovered to ~24 Mars hours. Judging from the phase relation between K1 and S1 and the S1 period shortening, it is considered that a resonance occurred between DE1 and K1. It is also found that the temporal evolution of the S1 and K1 amplitudes appears to correlate with the zonally non-uniform distribution of dust. DE1 is considered to be generated through the interaction of diurnal forcing with a lower-boundary inhomogeneity, especially the s = 2 topography. During the early stage of the dust storm, the dust loading is zonally non-uniform, which provides strong zonally asymmetric thermal forcing similar to the effect of topography. It is inferred that this transient forcing enhances DE1 and consequently amplifies K1.
How to cite: Asumi, A., Hernández-Bernal, J., Sato, K., and Spiga, A.: Quasi-diurnal Normal Mode Kelvin Wave Observed in the Atmosphere of Mars by the Pressure Sensor on the InSight Lander, Europlanet Science Congress 2026, The Hague, The Netherlands, 7–11 Sep 2026, EPSC2026-999, https://doi.org/10.5194/epsc2026-999, 2026.
Please decide on your access
Please use the buttons below to download the supplementary material or to visit the external website where the presentation is linked. Regarding the external link, please note that Copernicus Meetings cannot accept any liability for the content and the website you will visit.
Forward to presentation link
You are going to open an external link to the presentation as indicated by the authors. Copernicus Meetings cannot accept any liability for the content and the website you will visit.
We are sorry, but presentations are only available for conference attendees. Please register for the conference first. Thank you.
Introduction: The European Space Agency’s ExoMars was conceived to search for signs of life on Mars. The design of the mission puts the science team in the best possible condition to search for biosignatures, using:
- a 2-m depth drill;
- the suite of 8 scientific instruments in the Pasteur Payload;
- the selected landing site, Oxia Planum, and;
- the surface exploration strategy that guides how the Rover and instruments are used together to achieve the mission objectives.
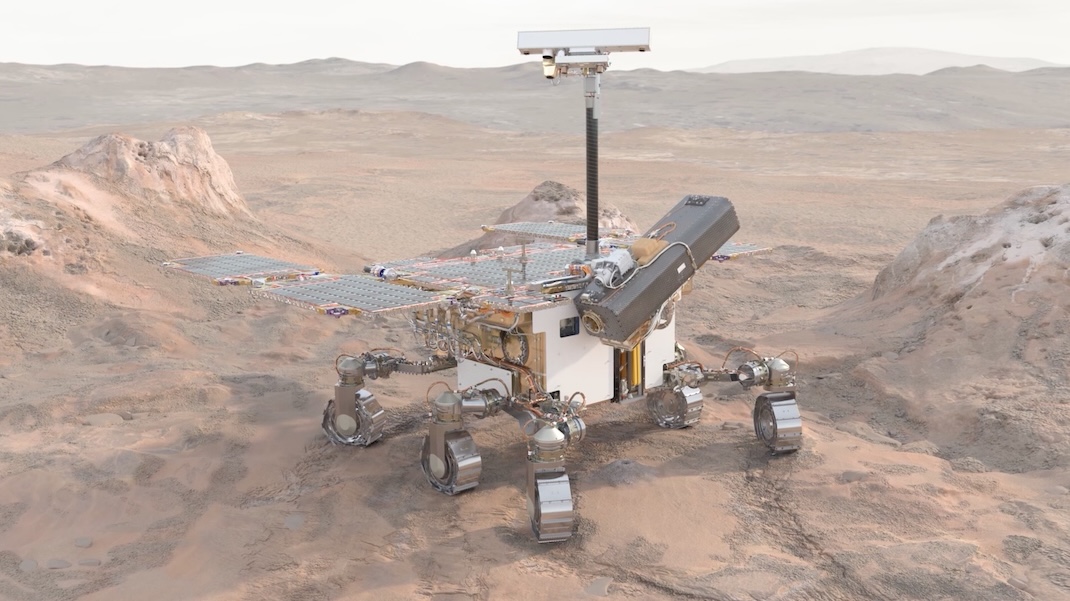
The Rosalind Franklin Mission (RFM) is a re-establishment of the ExoMars 2022 mission [1]. With European industrial prime contractor Thales Alenia Space, and important contributions from partner, NASA. RFM is on schedule for launch in the latter part of 2028 and to land at Oxia Planum in 2030.

Figure 1: The ExoMars Rosalind Franklin rover. Credit ESA/MLabspace
Pasteur Payload: The heart of the characterisation and analysis capabilities of the Rosalind Franklin Rover lies in the suite of complementary scientific instruments that comprise the Pasteur Payload. At macroscopic scales, the PanCam investigation [2], with its wide-angle multispectral stereo camera (WAC), and narrow-angle, high-resolution camera (HRC), working together with NavCam and LocCam navigation cameras, constitutes the eyes of the rover. An infrared spectrometer, Enfys [3], will reveal mineralogical signatures at targeted locations. The CLUPI instrument [4] serves as a geologist’s hand-lens, allowing close-up characterization of surface lithologies. The WISDOM ground penetrating radar [5] will reveal subsurface structures and survey potential drilling sites. Ma_Miss comprises an IR spectrometer head near the drill tip and will allow reconstruction of mineralogical stratigraphy in drilled boreholes [6]. In the rover’s Analytical Laboratory Drawer (ALD), the MicrOmega imaging Visible/IR spectrometer [7], Raman Laser Spectrometer, RLS [8], and Mars Organic Molecule Analyser (MOMA) [9] (which combines gas-chromatography and laser desorption with a linear ion trap mass spectrometer), work together to determine the mineralogy and organic composition of crushed samples.
Science Team Activities: The ExoMars Science Working Team (ESWT), ExoMars project, and industrial partners are nearing completion of refurbishment of the rover and its instruments. The ExoMars Rover Science Operations Working Group (RSOWG), chartered in 2019 by the ESWT, continues working to advance science readiness. The ‘Micro’ sub-group addresses topics regarding the spatial scale of the samples that will be extracted from down to 2m depth by the rover’s drill, their terrestrial analogues, and plans for their analyses, including by the three ALD instruments. Ongoing work regards the ‘Mission Reference Samples’ – a suite of natural and synthetic analogue samples most relevant to the landing site and mission objectives, which are under characterization by ground models of all the Pasteur Payload instruments. A set of geotechnical analyses are led by an Interdisciplinary Scientist (IDS) team focussing on sub-surface investigations [10], to maximize retrieval of information from drill telemetry in concert with visible images from CLUPI [4] and PanCam [2], infrared spectra from Ma_Miss [6] and information from the WISDOM radar [5].
Members of the ‘Macro’ sub-group continue geological interpretation of the landing site [e.g. [11], [12]] and continue to build interpretations from the published a high-fidelity geological map of Oxia Planum [13], the culmination of a 4-year team effort [14]. A dedicated co-author team is preparing the mission Strategic Science Plan (SSP), which traces mission science objectives to specific questions and hypotheses that are testable by Pasteur Payload instruments. Further, a Science Sampling Strategy (S3) is in development to provide tools for the science team to implement the priorities of the SSP into daily rover operations [15].
The European Entry Descent and Landing Module (EDLM) is in advanced development and will deliver the Rosalind Franklin rover to Oxia Planum. The module contains sensor packages that will support EDL and environmental characterisation at the surface for the time that the platform is operational after landing. Amongst them are the COMARS+ suite (Combined Aerothermal and Radiometer Sensors Instrument Package), four visible wavelength cameras for imaging the descent; and the Platform Atmospheric Characterisation Instrument Suite (PACIS), installed on the lander, which contains atmospheric pressure and temperature sensors, and a microphone. Telemetry from various sensors used during EDL supports the ExoMars Atmospheric Mars Entry and Landing Investigations and Analysis (AMELIA) team [16].
Continued Preparations for Operations: The Rover Operations Control Centre (ROCC, Turin) is maintained and updated, while continuing to host a schedule of tests and simulations, providing regular opportunities to exercise Science and Control Team processes. A Science Knowledge Management Programme (SKP) continues to support key expertise within the science and instrument teams, to retain and develop valuable team knowledge and experience that was built in preparation for the 2022 mission opportunity [17]. Preparations are well underway for rover field trials, to be held in 2026 and 2027 at a Mars analogue site, using a testbed rover and emulators of survey instruments, and building on experience from prior field tests [18], [19].
This presentation will explain how ESA, supported by industry and the payload teams and with our NASA partners, remains on track for a 2028 launch of the ExoMars Rosalind Franklin Mission. We will present the current level of advancement of the project and highlight the main science objectives and overall strategic plan for the mission.
References:
[1] J. L. Vago et al., Astrobiology, doi: 10.1089/ast.2016.1533.
[2] A. J. Coates et al., Astrobiology, doi: 10.1089/ast.2016.1548.
[3] A. Coates et al., Jul. 03, 2024. doi: 10.5194/epsc2024-927.
[4] J.-L. Josset et al., Astrobiology, doi: 10.1089/ast.2016.1546.
[5] V. Ciarletti et al., Astrobiology, doi: 10.1089/ast.2016.1532.
[6] M. C. De Sanctis et al., Astrobiology, doi: 10.1089/ast.2016.1541.
[7] J.-P. Bibring et al., Astrobiology, doi: 10.1089/ast.2016.1642.
[8] F. Rull et al., Astrobiology, doi: 10.1089/ast.2016.1567.
[9] F. Goesmann et al., Astrobiology, doi: 10.1089/ast.2016.1551.
[10] F. Altieri et al., Adv. Space Res., doi: 10.1016/j.asr.2023.01.044.
[11] I. T. Auré et al., Icarus, doi: 10.1016/j.icarus.2026.117113.
[12] J. D. Mcneil et al., JGRP, doi: 10.1029/2022JE007246.
[13] P. Fawdon et al., J. Maps, doi: 10.1080/17445647.2024.2302361.
[14] E. Sefton-Nash et al., LPSC#52, https://ui.adsabs.harvard.edu/abs/2021LPI....52.1947S
[15] F. Ferri et al., Space Sci. Rev., doi: 10.1007/s11214-019-0578-x.
[16] E. Sefton-Nash et al., LPSC2022, https://ui.adsabs.harvard.edu/abs/2022LPICo2678.2109S/abstract
[17] G. Ligeza, et al., Mars Through Time Int. Conf. https://www-mars.lmd.jussieu.fr/mtt2025/abstracts/Ligeza.pdf
[18] M. R. Balme et al., Planet. Space Sci., doi: 10.1016/j.pss.2018.12.003.
[19] M. Balme et al., EPSC 2020, doi: 10.5194/epsc2020-1073.
How to cite: Sefton-Nash, E., Vago, J. L., Joudrier, L., Zekri, E., Baglioni, P., Ball, A. J., Favaro, E. A., Ligeza, G., Tacconi, B., and Balme, M. R.: ExoMars Rosalind Franklin Mission (RFM) Update, Europlanet Science Congress 2026, The Hague, The Netherlands, 7–11 Sep 2026, EPSC2026-411, https://doi.org/10.5194/epsc2026-411, 2026.
Introduction: The ExoMars mission will deploy the Rosalind Franklin rover in Oxia Planum (OP), a region in western Arabia Terra at the transition between the heavily cratered highlands of Mars and the ancient and filled impact basin, Chryse Planitia [1]. This site was selected [2] because (i) landing is technically feasible and (ii) exposed phyllosilicate-bearing rocks offer access to the early history of the planet, when Mars is thought to have been most habitable. The primary science goal of ExoMars is to analyze the geology and geochemistry of the local environment with the aim of identifying potential biosignatures [1].
To characterize the geology of the landing ellipses, local HiRISE-scale mapping has been performed as a joint effort. A total number of 116 individually mapped 1×1 km boxes, covering an area of 8750 km2 [3], has been assembled into a consistent map at a scale of 1:30,000 [4]. After the shift of the launch date from 2022 to 2028, however, the location of the landing ellipses has changed, so the HiRISE-scale map does not fully cover the new ellipses anymore. Regional mapping at ~CTX-scale fully covers the ellipses, and provides a more synoptic view of the wider landing site within OP, enabling the contextualization of the units within the stratigraphy of western Arabia Terra and Chryse Planitia. We also mapped a region in Xanthe Terra which is characterized by mineralogical and textural features that are very similar to Oxia Planum (e.g., presence of phyllosilicates, polygonised surface texture) [5]. This will enable a comparison of both sites at the same mapping scale, and will help to address the question whether Oxia Planum is a localized phenomenon, or is representative of regional or even global geologic processes on Mars [e.g., 6]. It is expected that the CTX-scale Oxia Planum map will serve as a reference throughout the mission and subsequent data analysis.
Mapping Area and Datasets: The mapping area is located between 16.5°N and 19.5°N, and 334°E to 338°E. The geodetic reference is provided by the HRSC quadrangles MC11E and MC11W [9] which are tied to the global MOLA geodetic model. The data sets used for mapping include HRSC, THEMIS IR (day and night), CTX, and CaSSIS. Mapping scale in a GIS environment is 1:100,000, which will result in a final printable map at a scale of 1:1M. The mapping follows established and newly developed guidelines for planetary geologic mapping [10-13].
Preliminary Results: The spatially most widespread units are the phyllosilicate-bearing plains that are the prime ExoMars target (with distinctly enhanced THEMIS nighttime temperatures when compared to its surroundings), a dark resistant unit of possibly volcanic or sedimentary origin, and a mantling unit that was likely emplaced by aeolian processes. Multiple channels of various morphology and degradation state as well as sedimentary fan-shaped deposits (with low nighttime temperatures) imply a diverse and possibly long-lived history of surface runoff, perhaps accompanied or replaced by groundwater processes such as sapping. Inverted landforms (channels, impact crater fills) are the result of intense erosion. Additional mapped features include tectonic structures such as wrinkle ridges and lobate scarps (delineating a basin-like depression in the central mapping area), remnant erosional buttes that are predominantly located in the northwestern portion of the mapping area (i.e., towards Chryse Planitia), craters and their ejecta blankets, and fields of aeolian bedforms and secondary craters.
Comparison with Similar Site(s): The phyllosilicate-bearing rocks in Oxia Planum are part of a circum-Chryse »belt« of surface materials displaying spectral evidence of aqueous alteration [7]. If there is indeed such a geologically coherent »bathtub« ring, the phyllosilicates at OP may be characteristic for a basin-related setting of regional importance, rather than being unique to OP. In that case, hypotheses related to the origin of OP phyllosilicates may also be tested at other circum-Chryse locations. To enable such tests, we selected a »reference« site in northern Xanthe Terra (~11±2°N/316.5±1°E) that exhibits several key characteristics of OP: Light-toned and fractured bed-rock with a high nighttime IR brightness, nearby chan-nels and sedimentary deposits (the Hypanis Valles and their terminal fans exhibiting low nighttime IR brightnesses, and erosional remnant buttes towards Chryse. The combination and spatial pattern of these features is very similar to OP and suggests that a similar geologic evolution may have shaped both areas.
Preliminary Conclusions: Overall, our mapping confirms previous geologic analyses. However, some features (e.g., contractional structures, channels, possible sapping landforms) need further attention as the may provide important constraints on the tectonic and aqueous evolution of the ExoMars landing area.
Acknowledgments: The data used in this study are available via the Planetary Data System (PDS) of NASA, the Planetary Science Archive (PSA) of ESA, and additional data repositories at DLR and the USGS.
References:
[1] Vago, J. L. et al. (2017) Astrobiology, 17, 471–510. [2] Loizeau, D. et al. (2019) LPS L, Abstract #2378. [3] Fawdon, P. et al. (2021) Journal of Maps, 17(2), 621–637. [4] Fawdon, P., et al. (2024) Journal of Maps, 20(1), 2302361. [5] Früh, T. et al. (2023) 54th LPSC, LPI Contribution No. 2806, id.1440. [6] Torres, I. et al. (2026] Icarus, 117113 (in press). [7] Carter, J. et al. (2023) Icarus, 389, 115164.
How to cite: Hauber, E., Tirsch, D., Adeli, S., Früh, T., and Hiesinger, H.: Regional Geologic Mapping of the Oxia Planum Landing Site for the Exomars 2028 Rosalind Fanklin Mission, Europlanet Science Congress 2026, The Hague, The Netherlands, 7–11 Sep 2026, EPSC2026-1105, https://doi.org/10.5194/epsc2026-1105, 2026.
The ExoMars Rosalind Franklin Mission is designed to address one of the most fundamental questions in planetary science: whether life ever existed on Mars [1]. The selected landing site, Oxia Planum, exposes some of the oldest Noachian terrains (~4.1–3.7 Ga), characterized by widespread Fe–Mg phyllosilicate-rich deposits formed in the presence of water. These environments are considered highly favourable for the preservation of biosignatures [2, 3]. Achieving the mission’s scientific objectives depends on the rover’s ability to identify, prioritise, and sample the most promising geological targets, that is, those with the highest potential to harbour preserved biosignatures, and within the available operational resources (time, energy, and data volume).
This study has two main objectives:
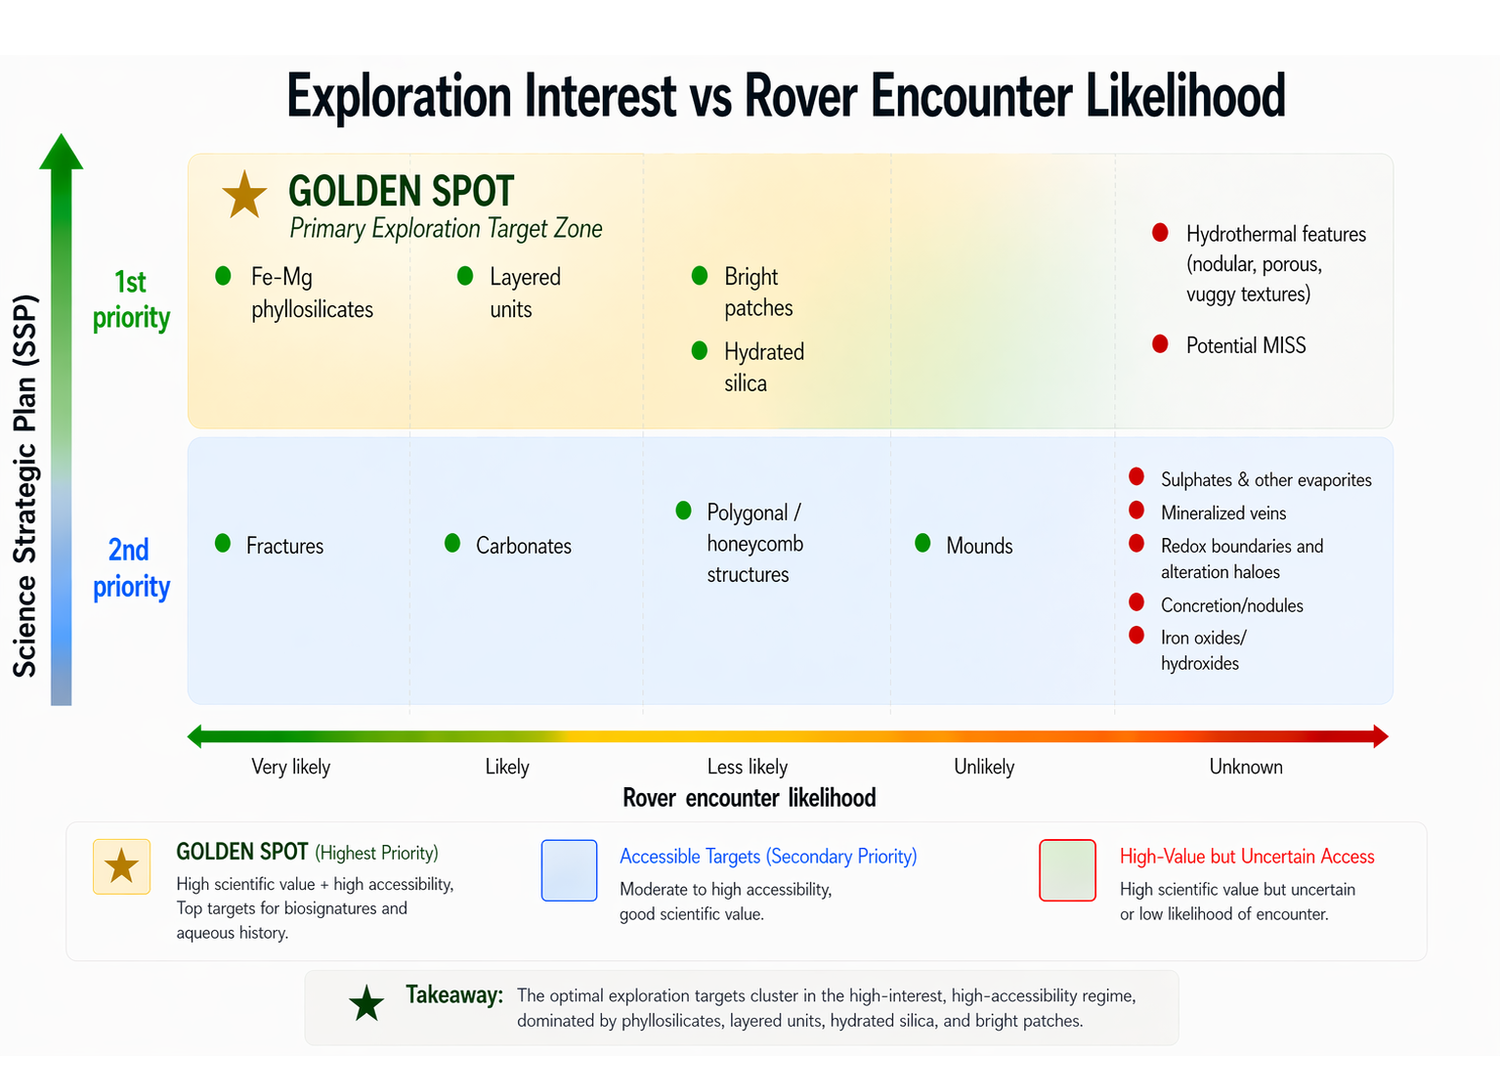
First, to identify high-priority features for the ExoMars Rosalind Franklin rover. Priorities of relevant features are determined from the Strategic Science Plan (SSP, in preparation); the set of prioritised questions that are elaborated from overall mission science objectives. Then, the detection and spatial distribution of such features is interpreted using orbital observations [2, 3, 5] and the resulting geological map of Oxia Planum [4]. Together with predicted landing ellipses, we may calculate the relative importance of features in S3 according to their scientific priority, and the likelihood of encountering them during the rover surface mission phase.
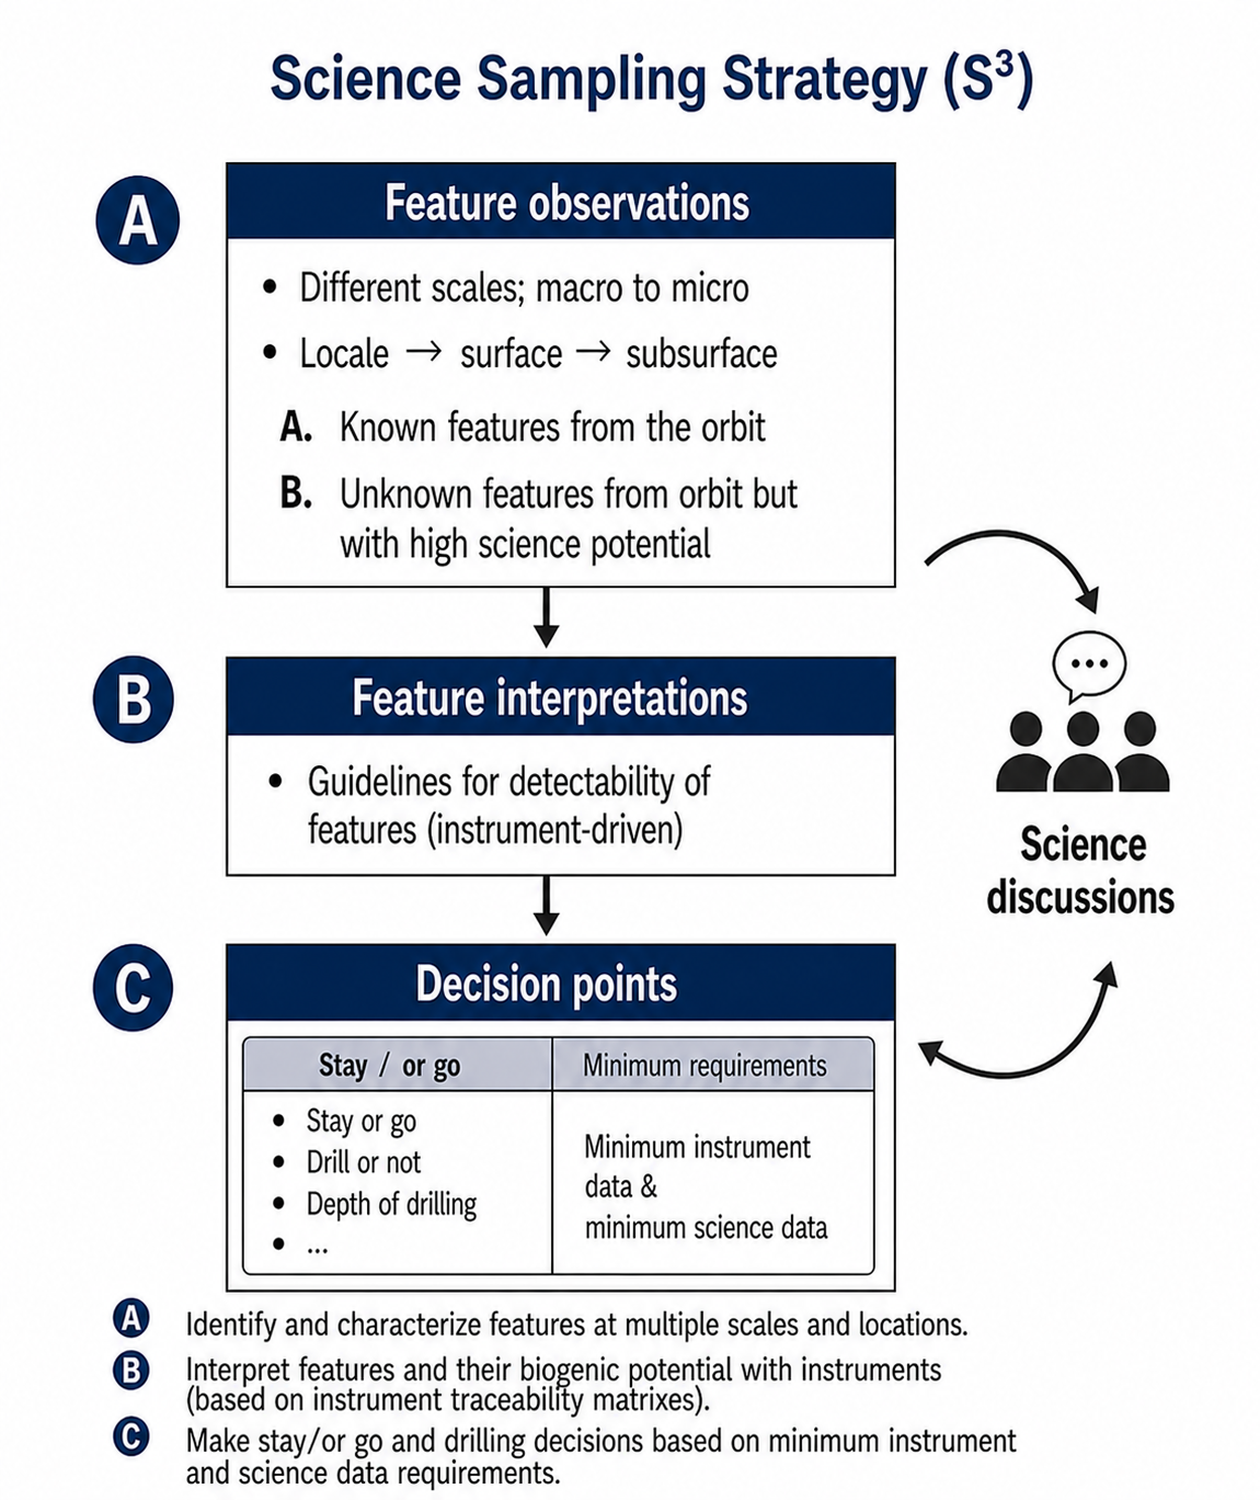
Second, to develop a Science Sampling Strategy (S3) that incorporates these features and priorities into rover operations by defining how such features can be systematically recognised in situ and assessed for sampling. The S3 is designed to support science-driven decision-making during rover operations, particularly in relation to surface mission phases (see Experiment Cycle (EC) in [1]), at key decision points, such as “stay or go” at a site, “drill or not drill”, and the selection of appropriate subsurface sampling depth.
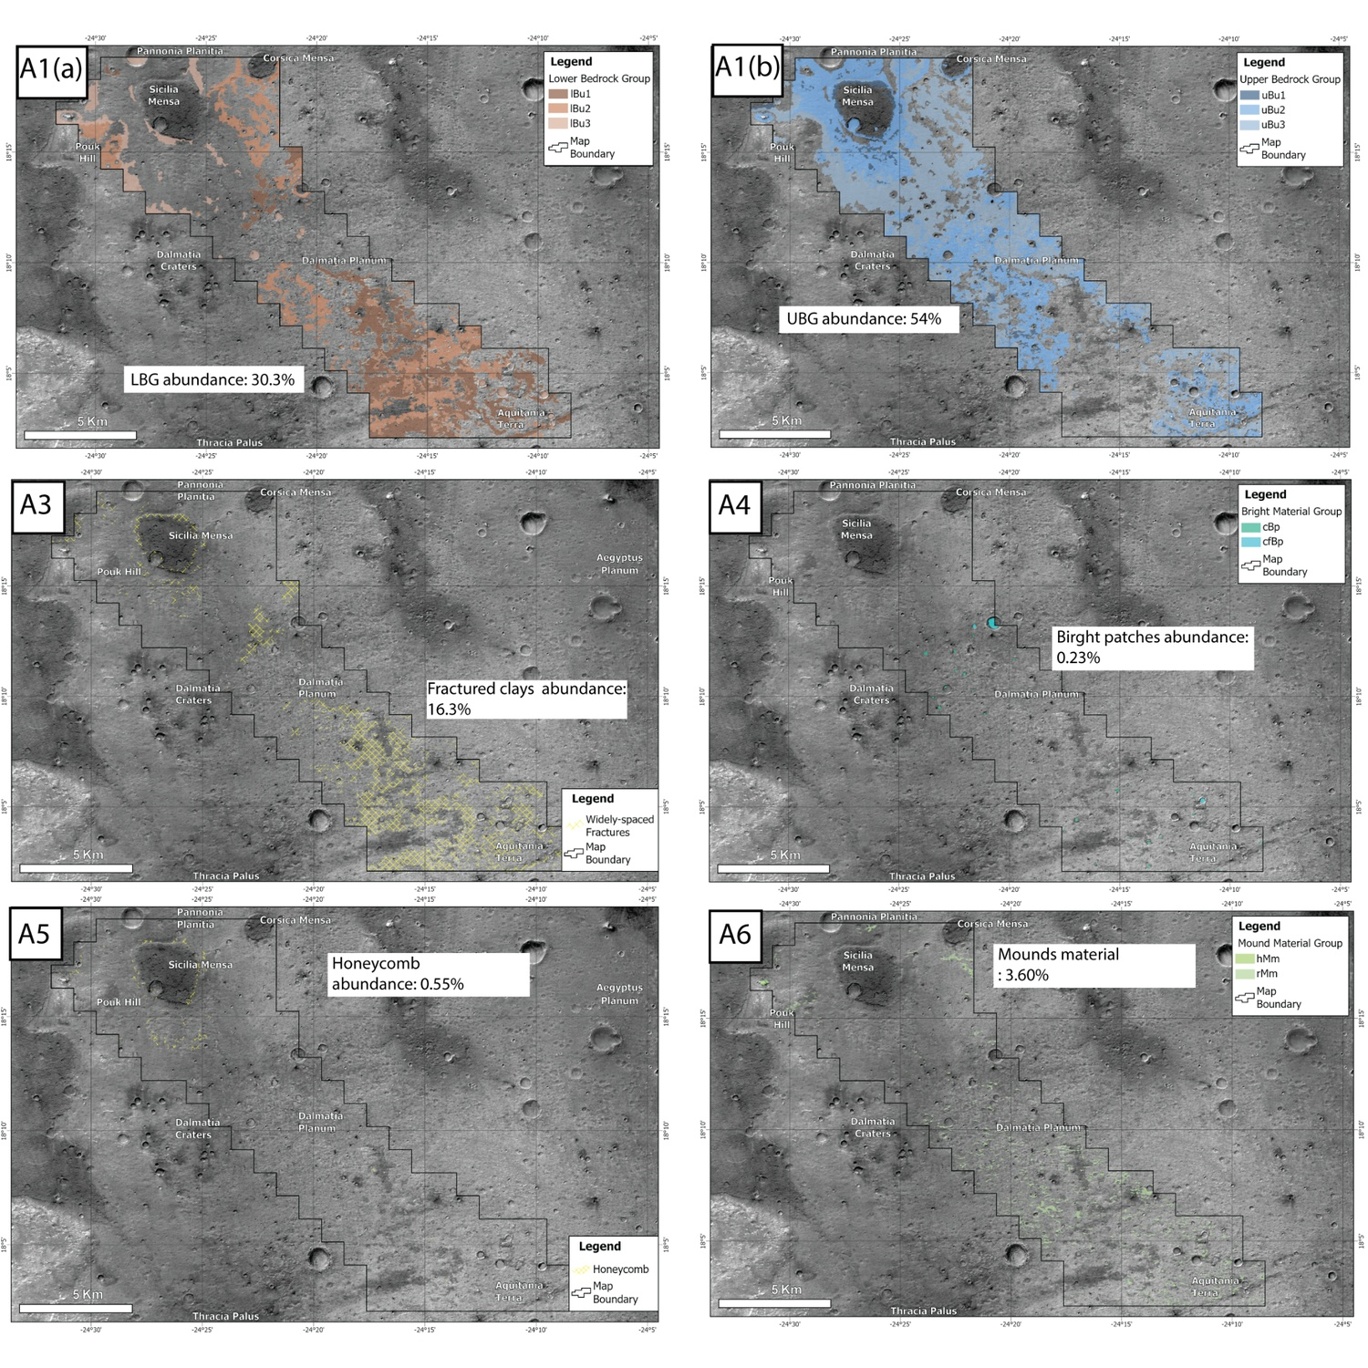
Identification of high-priority features: We identify two main groups of features: Group A, features known from orbital data within the landing ellipse, and Group B, features too small to resolve from orbit but that correspond to the first priority of the Science Strategic Plan (SSP) and are indicators of biosignature preservation. Group A includes Fe–Mg phyllosilicates, layered sedimentary units, fractures, bright patches, polygonal/honeycomb structures, and mounds. Their abundances within the map boundary [4] were quantified using ArcGIS (Fig. 1). Group B includes features inferred from interpretation of the landing site and analogues from Mars rover missions, limited to those relevant to the first SSP priority. These include carbonates, hydrated silica, hydrothermal textures (nodular, porous, vuggy), sulphates, mineralized veins, redox boundaries, concretions, iron oxides/hydroxides, and microbially induced sedimentary structures (MISS). Their potential occurrence at Oxia Planum is supported by geological context and indirect spectral evidence, such as silica detections near the sedimentary fan within the landing ellipse [5].

Figure 1: Group A high-priority features identified from orbital data and their abundances within the landing ellipse.
Exploration prioritisation: To integrate scientific value with operational feasibility, we introduce a feature prioritisation framework that evaluates targets based on two parameters: scientific interest (aligned with the Science Sampling Plan, SSP) and likelihood of rover encounter (Fig.2) This approach identifies a “golden spot” where features of high scientific value—particularly those related to the formation and preservation of life on Mars—coincide with a high likelihood of rover encounter. Accordingly, priority targets for rover exploration include Fe–Mg phyllosilicates, layered units, bright patches, hydrated silica and/or other hydrothermal features (e.g., nodular or porous textures), and potential microbially induced sedimentary structures (MISS), if present at the surface.

Figure 2: Exploration prioritisation for high priority features at Oxia Planum, their exploration interest based on SSP vs. likelihood of rover encounter.
Science Sampling Strategy (S3): The S3 incorporates high-priority features into a structured operational framework. It defines observations required to characterise geological context, recognise high-priority features in situ, and support sampling decisions.
The strategy is organised into three sequential stages (Fig.3). Observations are acquired across multiple spatial scales, from landscape context (PanCam WAC, NavCam, WISDOM)[6,7] to outcrop and target-scale investigations (PanCam HRC, CLUPI, Enfys)[6,8], with subsurface information provided by WISDOM [7] and Ma_Miss [9] (down to ~2 m depth). Interpretation integrates morphological, stratigraphic, and mineralogical data to reconstruct palaeoenvironmental conditions and assess biosignature preservation potential. Decision-making links these observations to operational decisions, including “stay or go” at a site, “go/no-go for drilling”, and drilling depth selection.
This workflow ensures observations are acquired and evaluated, enabling efficient decision-making. A key strength of the S3 framework is its adaptability. While anchored in orbital predictions, it allows incorporation of newly identified features, addressing uncertainties in orbital interpretations. S3 aims for consistency in preparing for decisions made in operations, so that decision-makers are provided with at least the minimum essential level of supporting information about a certain site or feature.

Figure 3: Science Sampling Strategy (S3) workflow.
Conclusions and preparations for operations : We present a Science Sampling Strategy (S3) that links high-priority geological targets at Oxia Planum with a structured, instrument-driven operational workflow for the Rosalind Franklin rover. The strategy enhances science-driven decision-making during rover operations and maximises mission return by focusing on environments most favourable for biosignature preservation.
The S3 will be further refined and validated through upcoming simulation campaigns and operational testing. In the near-term, it will be tested in the first of two ExoMars rover Field Tests, planned for mid-September 2026, providing a critical step toward readiness for surface mission operations.
References: [1] Vago, J. L. et al. (2017) Astrobiology 17, 471–510. [2] Quantin-Nataf, C. et al. (2021) Astrobiology, 21(3), pp.345-366. [3] Torres-Auré, I. et al. (2026). Clay continuity between Oxia Planum and Mawrth Vallis. Icarus, 117113.[4] Fawdon, P. et al. (2024) Journal of Maps, 20(1), p.2302361. [5] McNeil, J.D. et al. (2025) Journal of Geophysical Research: Planets, 130(9), p.e2025JE008989. [6] Coates, A. J. et al. (2017) Astrobiology 17, 511–541. [7] Ciarletti, V. et al. (2017) Astrobiology 17, 565–584. [8] Josset, J.-L. et al. (2017) Astrobiology 17, 595–61. [9] De Sanctis, M. C. et al. (2017) Astrobiology 17, 612–620.
How to cite: Ligeza, G., Sefton-Nash, E., Orgel, C., and Vago, J. L.: Science Sampling Strategy (S3) for High-Priority Features for the ExoMars Rosalind Franklin Rover – Where are They and How to Identify Them?, Europlanet Science Congress 2026, The Hague, The Netherlands, 7–11 Sep 2026, EPSC2026-152, https://doi.org/10.5194/epsc2026-152, 2026.
Introduction: Mars is one among the Solar System bodies of highest interest for research about prebiotic chemistry, mainly because early Mars surface environment was similar to the Earth’s one at the time Life arose on our planet [1]. This is one reason why Mars surface has been intensively explored for decades, notably by the use of mobile rover probes, which allowed the first detection of indigenous organic molecules [2].
The Exomars mission has among its main objectives to characterize the organic matter present in its landing site, Oxia Planum, which is characterized by wide plains rich in clays [3]. Clay formation requires prolonged exposure to liquid water. The geochemical conditions necessary for the formation of such clays could facilitate prebiotic activity [4]. Therefore, Oxia Planum deposits could hold a record of formation and evolution of organic matter into molecules of biological interest. To prepare the interpretation of future data to be collected by the different instruments onboard the Rosalind Franklin rover, the Exomars science team organized a campaign of analyses performed on a variety of terrestrial samples, possibly analogs of Oxia Planum soils and rocks, that were distributed among the laboratories participating to the ExoMars project.
Mars Organic Molecule Analyzer (MOMA) is the main instrument dedicated to characterize the organic matter present in the collected samples. It is a dual-mode instrument aboard the rover, designed to detect and characterize organic molecules in subsurface samples down to 2 m depth, where radiation-induced degradation is minimized [5]. MOMA employs a combination of laser desorption (LD) and gas chromatography–mass spectrometry (GC-MS) with complementary sample preparation techniques: pyrolysis (up to 850 °C) which allows organic molecules to evolve (or be fragmented) into volatile species prior to their injection into the GC-MS analyzer. In addition to this vaporization technique, chemical derivatization using tetramethylammonium hydroxide (TMAH), to support molecule vaporization but limiting their fragmentation or N-methyl-N-(trimethylsilyl)trifluoroacetamide (MTBSTFA), and dimethylformamide–dimethylacetamide (DMF-DMA) for polar organic molecules of interest for prebiotic chemistry analyzable by GC-MS, such as amino acids or fatty acids [6].
My work focuses on the GC-MS analysis part. The goal of this study is to replicate MOMA GCMS protocols in the laboratory and asses the best parameters to confirm the detectability of biomarkers then understand the best conditions to operate MOMA. To this aim, each sample was subjected to sequential pyrolysis (250 °C, 400 °C, 550 °C, 700 °C, and 850 °C) and derivatization with TMAH, MTBSTFA, and DMF-DMA. All analyses were performed using laboratory-scale GC-MS systems configured to replicate MOMA operational parameters. Blank runs and procedural controls were conducted to assess contamination levels.
Results: We were able to detect organic molecules in all the samples, using MOMA analytical technics, though in various abundances and number, depending on the samples. Although the possibility of contamination cannot be ruled out, it remains minimal. We observed that the thermal treatment (temperature and duration of pyrolysis) had a significant impact on the nature of the organic molecules detected (Fig. 1). These results allowed us to determine that in order to extract as much information as possible from a sample, two pyrolysis temperature should be used successively. A first “low temperature” (550°C) pyrolysis to extract volatile compounds while limiting their alteration, and a “high temperature” (850°C) pyrolysis to extract molecules potentially trapped in refractory minerals that can thermally decompose above 550°C, with the drawback of aromatization processes that occur to organic molecules at such high temperatures.
Fig. 1. Distribution by chemical family of the number of compounds detected by pyrolysis GCMS for successive pyrolysis temperatures of 250°C, 400°C, 550°C, 700°C and 875°C, applied to the same fraction of the Modern Gypsum sample of the ExoMars mission sample exercise.
The derivatization techniques used allowed us to identify important biological molecules like amino acids or fatty acids. It was observed that the MTBSTFA (in large excess comparing to MOMA conditions) derivatization allowed the identification of a higher number of compounds. Results also show that for the same sample the amino acids identified depend on the derivatization agent used. Furthermore, even if DMF-DMA (also in large excess) derivatization does not allow to detect as much molecules as with MTBSTFA, DMF-DMA leaves room for chiral separation of the molecules. This observation demonstrates the derivatization technics are complementary to each other’s and to pyrolysis.
Conclusion: We demonstrated that the sample preparation technics used in the MOMA instrument to perform GCMS analyses, allow to detect organic molecules, including species of interest for prebiotic chemistry, in martian analog samples. This works also demonstrated the interest of a two-step pyrolysis when analyzing natural sample to prevent the alteration of the most volatile compounds. In addition, the derivatization technics allowed the identification of building blocks of life, proving the relevance and the complementarity of the technics boarding MOMA.
Though these results focus on laboratory technics reproducing MOMA, the MOMA team works together studying the same sample in more MOMA-like situation (subsystems, sample to reagent ratio …) in order to transpose our results to the actual instrument.
Acknowledgments: Thanks are due to the Exomars project team and the teams that provided the variety of samples to be characterized in the frame of the “ExoMars mission samples” campaign. T. Govekar acknowledges financial support from the Centre national d’études spatiales (CNES), France (ROR: https://ror.org/04h1h0y33) within the framework of the ExoMars mission. T. Govekar thanks University of Versailles Saint Quentin and CNES for his PhD grant funding.
References: [1] Cockell, et al. (2016), 16(1), 89-117. [2] Freissinet, et al. (2015). Journal of Geophysical Research: Planets. [3] Quantin-Nataf, et al. (2021). Astrobiology, 21(3), 345-366. [4] Pinnavaia, T. J. (1983). Science, 220(4595), 365-371. [5] Vago, et al. (2017). Astrobiology, 17(6-7), 471-510. [6] Goesmann, et al. (2017). Astrobiology, 17(6-7), 655-685.
How to cite: Govekar, T., Szopa, C., Freissinet, C., Buch, A., Bouhier, B., Couderc, O., Azemard, C., Stalport, F., and Yesil Sahan, F.: ExoMars analog sample campaign: preparing in situ research of organic matter with Gas Chromatography-Mass Spectrometry at Oxia Planum, Mars, with the MOMA experiment , Europlanet Science Congress 2026, The Hague, The Netherlands, 7–11 Sep 2026, EPSC2026-320, https://doi.org/10.5194/epsc2026-320, 2026.
Introduction: Rover-based geological investigations rely on multispectral imaging to distinguish lithological and mineralogical variability, helping to reconstruct palaeoenvironmental conditions on Mars [1-5]. However, the interpretation of geological targets from rover imagery is constrained by the discrete spectral sampling of multispectral imaging systems, potentially limiting discrimination of subtle spectral variations within compositionally heterogeneous materials. Evaluating how effectively rover multispectral observations preserve diagnostic mineralogical information is therefore essential for reliable geological interpretation and informed scientific target selection during planetary surface exploration.
The Panoramic Camera (PanCam) is a context imaging instrument onboard the ExoMars Rosalind Franklin rover [6-7]. The optical bench consists of a High-Resolution Camera (HRC) and two multispectral Wide Angle Cameras (WACs), enabling stereo imaging and visible to near-infrared observations across the 440-1000 nm wavelength range [7-9]. PanCam is designed to support geological characterisation and drill target prioritisation within the phyllosilicate-rich terrain of Oxia Planum [10], using a geology filter set optimised for the detection of ferric mineral signatures and broad mineralogical variability [9].
Here, we evaluate the mineralogical discrimination capabilities of PanCam using imagery acquired with the PanCam Training Model (TM), a functional replica of the flight instrument configured with the Right WAC (RWAC) and a filter wheel containing 11 of the 12 geology filters (excluding the 500 nm filter). Using diverse Mars analogue materials, we assess how effectively PanCam multispectral observations preserve diagnostic mineralogical information, while additionally exploring the potential of PanCam imagery to support the astrobiological objectives of the Rosalind Franklin mission.

Figure 1. PanCam TM HRC images of a) a polymict lithic impact breccia from the Ries crater, Germany; b) a peridotite mantle xenolith from Arizona, USA; and c) cryptoendolith horizons within Antarctic Dry Valley sandstones [12]. Scale bars each represent 10 cm.
Dataset and methods: Multispectral image datasets were collected under controlled laboratory conditions for ten Mars analogue samples selected to represent a range of mineralogical compositions, lithologies, and formation environments. The sample suite includes a clay-rich polymict lithic impact breccia collected during fieldwork at the Ries impact structure, Germany (Figure 1a), and an ultramafic mantle xenolith sourced from the San Carlos volcanic field, Arizona, USA (Figure 1b). Radiometric calibration was performed using the PanCam Operations Toolkit (PCOT) [11], supporting derivation of reflectance spectra, image enhancement products, and spectral parameter maps. Hyperspectral VIS-NIR measurements were also collected using a high spectral-resolution ASD RxSpec 700Z contact probe spectrometer (350–2500 nm) within the same regions of interest for comparative analysis.

Figure 2. a) Cropped PanCam TM RWAC image of a mantle xenolith sample (RGB: 670, 530, 440 nm) showing ROIs corresponding to b) olivine-rich and c) enstatite-rich regions. Panels b–c compare PanCam TM image-derived spectra (red) with corresponding ASD contact probe spectra (green).
Results: Spectra derived from RWAC images (Figure 2a) capture diagnostic features across diverse mineralogies, including olivine (Figure 2b), enstatite (Figure 2c), and materials not originally prioritised during filter selection, such as illite-bearing assemblages. Comparisons with ASD measurements, that were also resampled to the 11 bands of the TM, show strong agreement in spectral trends across the PanCam wavelength range, indicating minimal loss of diagnostic spectral information despite the reduced spectral resolution of multispectral imaging.
PanCam multispectral observations additionally resolve spectral variations associated with microbial colonisation (Figure 1c), with distinct endolithic horizons detectable at distances of 2 m. Extracted spectra exhibit features consistent with biologically associated pigments, including chlorophyll, melanin, and phycocyanin. Several analogue samples containing endolithic growth and photosynthetic pigments display spectral characteristics consistent with a diagnostic red edge feature within the PanCam wavelength range, suggesting that biologically derived spectral signatures may be distinguishable alongside mineralogical variability within PanCam imagery.
Summary: This work contributes to the development of a PanCam image-based spectral library of analogue materials and demonstrates the value of multispectral imaging for interpreting geologically heterogeneous targets on Mars. These results additionally highlight the potential of PanCam multispectral observations to investigate biologically derived spectral signatures within Mars analogue environments relevant to the astrobiological objectives of the Rosalind Franklin mission.
[1] Bell et al., 2004, Science [2] Bell et al., 2022, Science [3] Farrand et al., 2007, JGR: Planets [4] Royer et al., 2024, Nature [5] Harris et al., 2015, Icarus [6] Vago et al., 2017, Astrobiology [7] Coates et al., 2017, Astrobiology [8] Cousins et al., 2010, Astrobiology [9] Cousins et al., 2012, Planetary and Space Science [10] Quantin-Nataf et al., 2021, Astrobiology [11] Finnis et al., 2024, Geoscience Data Journal [12] Preston et al., 2015, Applied Spectroscopy.
How to cite: Warrilow, R., Preston, L. J., Tornabene, L. L., Dartnell, L., Osinski, G. R., Ballard, C., Hunt, T., and Coates, A.: Multispectral Analysis and Geological Characterisation Using the PanCam Training Model, Europlanet Science Congress 2026, The Hague, The Netherlands, 7–11 Sep 2026, EPSC2026-1180, https://doi.org/10.5194/epsc2026-1180, 2026.
Introduction
Ma_MISS is the visible and near-infrared spectrometer embedded in the drill system of the ExoMars Rosalind Franklin rover [1]. It will acquire spectral reflectance measurements along the walls of boreholes drilled into the Martian subsurface, down to depths of about 2 m, providing mineralogical and stratigraphic information in situ before samples are extracted and delivered to the rover analytical laboratory. Ma_MISS acquires single-point spectra through a small sapphire window on the side of the drill tool. Each spectrum is collected from a small spot (about 120 μm large) on the borehole wall. By exploiting the finely controllable rotation and vertical translation of the drill tool, Ma_MISS can build hyperspectral maps of the borehole wall, acquiring one spatial pixel at a time. A sequence of acquisitions interleaved with small drill rotations produces a “ring” scan, while a “column” operation consists of multiple rings acquired at different depths, with small vertical translations between consecutive rings.
Operations simulation and planning
The scientific return of Ma_MISS observations will depend strongly on the selected acquisition strategy. A Ma_MISS operation is defined mainly by the angular step between acquisitions, the vertical step between rings, the number of points per ring, and the number of rings. These parameters control the spatial sampling and the depth interval covered by a scan, but they also determine the time, data volume, and energy required to complete the operation. Since the time available for Ma_MISS observations during rover operations will be limited, operation planning requires explicit trade-offs between spatial resolution, depth coverage, and resource constraints.
We are developing software tools to support the planning and optimization of Ma_MISS acquisition sequences. The first component is a command-sequence simulator that estimates the duration and generated data volume from a proposed sequence of Ma_MISS commands. These estimates can be used in two complementary planning modes. In the first, the user fixes the spatial sampling and resource limits, and the tool determines the maximum depth interval that can be covered within the available time. In the second, the user specifies the depth interval to investigate and the available resources, and the tool searches for an acquisition strategy that maximizes the expected scientific return. This second approach is essentially a constrained optimization problem and requires a quantitative objective function. Importantly, the best strategy is not necessarily the one with the largest number of individual spectra: depending on the target material and on the scientific objective, a more regular sampling pattern, or a different balance between angular and vertical resolution, may preserve more useful information.
Simulations based on DAVIS measurements
To develop and test optimization strategies and to compare acquisition sequences meaningfully, it is necessary to simulate not only the required resources but also the hyperspectral datasets that would be produced by different Ma_MISS acquisition sequences. Previous work used synthetic borehole geometry models to rapidly generate simulated datasets [2]. Here we extend this approach using DAVIS, a Ma_MISS laboratory model designed to acquire spectra inside holes drilled in rock samples, with a measurement geometry and optical head representative of Ma_MISS [3]. Through automated rotation and translation actuators, DAVIS can be used to reproduce Ma_MISS acquisition sequences in rock samples.
As a first proof of concept, we acquired a high-spatial-sampling DAVIS scan over a limited region inside the hole of a drilled rock sample. The scan covered an angular sector of about 9° and a depth range of about 40 mm, using a rotation step of 0.5° and a vertical step of 0.1 mm. The resulting dataset contains 7200 spectra, arranged as 400 partial rings of 18 points each. Coarser acquisition strategies can then be simulated by subsampling this reference dataset. Figure 1 shows examples of such strategies, from the full 18 × 400 acquisitions dataset to progressively faster operations with fewer acquired points.
To compare the simulated strategies, each subsampled dataset was interpolated back onto the full grid using bilinear interpolation (Figure 2). The interpolated products can then be compared with the complete high-resolution dataset to quantify the information lost when the number of acquisitions is reduced. As an example metric, we used the Structural Similarity Index (SSIM) [4] to rank acquisition strategies according to their similarity to the full reference dataset. This provides a practical demonstration of how laboratory hyperspectral data can be used to define objective functions for Ma_MISS operation planning.

Figure 1. Each panel shows the results of a different acquisition strategy simulated from DAVIS data, with operation decreasing duration from left to right. The leftmost panel shows the full dataset. The hyperspectral dataset is represented as an RGB composite of three bands (660 nm, 532 nm, 480 nm respectively). The duration of each sequence is reported above each panel as a percentage of the duration of the full sequence.

Figure 2. Same as Figure 1, but with each simulated hyperspectral dataset interpolated back to the original size. The SSIM value is reported below each panel.
Future work
This preliminary test is based on a small spatial region and on a single, highly heterogeneous rock sample. Future work will extend the method by using DAVIS to simulate more complete Ma_MISS scans, including acquisitions over the full borehole circumference and larger depth intervals. We will also test multiple rock samples with different textures and degrees of heterogeneity, including layered, clastic, and veined materials. This will allow us to evaluate how the optimal Ma_MISS acquisition strategy depends on the geological target and to develop more robust metrics for quantifying scientific return and comparing different acquisition strategies.
Acknowledgements
This work is supported by the ASI grant ASI-INAF n. 2023-3-HH.0 and by the ESA Rosalind Franklin Mission’s Ma_MISS SKP (Science Knowledge Programme).
References
[1] De Sanctis M. C. et al. (2022), Planetary Science Journal, 3, 142. https://doi.org/10.3847/PSJ/ac694f
[2] Rossi L. et al. (2022), EPSC2022-391. https://doi.org/10.5194/epsc2022-391
[3] De Angelis S. et al. (2022), LPSC 53, Abstract #1796.
[4] Wang Z. et al. (2004), IEEE Transactions on Image Processing, 13, 600–612. https://doi.org/10.1109/TIP.2003.819861
How to cite: Rossi, L., Fonte, S., Bruschini, E., Jimenez Sanz, D., De Angelis, S., Altieri, F., and De Sanctis, M. C.: Simulating and optimizing Ma_MISS operations, Europlanet Science Congress 2026, The Hague, The Netherlands, 7–11 Sep 2026, EPSC2026-846, https://doi.org/10.5194/epsc2026-846, 2026.
The characterization of Martian analogue samples requires robust, multi-disciplinary laboratory methodologies capable of resolving physical, mineralogical, and geochemical properties across a wide range of materials. In support of the European Space Agency (ESA) work to characterize terrestrial Mars analogue samples and provide data to the scientific community, the Norwegian Geotechnical Institute (NGI), in collaboration with Norwegian research partners, has developed and implemented a comprehensive testing framework for Mars analogue materials. This framework targets rock and soil analogues, as well as the FS-120 reference material, a porous fused silica previously used as an organic check material in studies related to the Sample Analysis at Mars (SAM) instrument on the Curiosity rover, and integrates standardized techniques commonly used in geotechnical engineering and planetary science. This study presents the results of test campaigns 1–7, focusing on the systematic materials characterization of six Mars analogue materials and the FS-120 reference material. The objective is to evaluate the applicability, complementarity, and limitations of a broad suite of laboratory techniques for constraining the physical properties, mineralogy, and geochemistry of analogue materials relevant to Mars sample science and curation. Each analogue sample was subjected to a standardized yet adaptable testing workflow including: (i) classification and index testing (e.g., particle size distribution, bulk and grain density), (ii) mineralogical and geochemical analyses (XRD, XRF, ICP-OES, ICP-MS, TOC), and (iii) microstructural and imaging techniques (SEM, optical microscopy, micro- and nano-CT, photogrammetry). For selected samples, strength and mechanical behaviour were additionally assessed through uniaxial compression and tensile strength tests. The analytical programme was designed to provide both qualitative and quantitative datasets while allowing flexibility depending on sample type and scientific priorities. The six natural analogue samples exhibit significant variability in mineralogical composition, grain size distribution, and microstructural characteristics, reflecting a range of potential Martian lithologies. Combined XRD and XRF/ICP datasets provide consistent identification of major phases and elemental composition, while CT and SEM analyses reveal complex pore structures and grain morphologies across scales. Mechanical testing highlights variability in strength and anisotropy, particularly in samples with sedimentary structures. For FS-120, this work extends previous mission-focused characterization into a more comprehensive open baseline dataset, supporting its use as a reference material alongside the natural analogues. The results demonstrate that a multi-technique characterization strategy is important to capture the complexity of Mars analogue materials and to support future Mars sample analysis missions. The workflows developed here provide a flexible approach that can be adapted to future analogue materials. Ongoing and future campaigns will expand the dataset. This work was carried out under ESA contract 4000145811/24/NL/PA.
How to cite: Griffiths, L., Kydland Lysdahl, A., Thiessen, F., Silva, D., Mikesell, T. D., Sefton-Nash, E., and Kminek, G.: Multi-technique characterization of Mars analogue samples: results from test campaigns 1-7, Europlanet Science Congress 2026, The Hague, The Netherlands, 7–11 Sep 2026, EPSC2026-888, https://doi.org/10.5194/epsc2026-888, 2026.
Please decide on your access
Please use the buttons below to download the supplementary material or to visit the external website where the presentation is linked. Regarding the external link, please note that Copernicus Meetings cannot accept any liability for the content and the website you will visit.
Forward to presentation link
You are going to open an external link to the presentation as indicated by the authors. Copernicus Meetings cannot accept any liability for the content and the website you will visit.
We are sorry, but presentations are only available for conference attendees. Please register for the conference first. Thank you.
Introduction
Martian weather has been continuously monitored for more than 25 years using observations from orbiters, landers, and rovers. A paradigm shift would be to move toward simultaneous monitoring of global Martian weather using a constellation of satellites in high-altitude orbits, such as areostationary orbit [1, 2].
Improving weather monitoring has direct implications for weather forecasting, which is considered a key exploration-focused science topic, as it supports and enables future exploration objectives. At the same time, developing weather forecasting capabilities for an extraterrestrial planet has broader implications for atmospheric science, making it also an exploration-enabled science topic, since it represents science made possible by exploration platforms and capabilities [3].
Alongside improved observational monitoring of Martian weather, reliable forecasting requires key developments in the models used to simulate the Martian atmosphere, such as Global Climate Models (GCMs). Improving the representation of the dust cycle, in particular, is of paramount importance for correctly reproducing the observed seasonal and interannual variability of Martian dust storms [4].
Data assimilation and machine learning have emerged as complementary approaches for monitoring and forecasting Martian weather: data assimilation combines observations with atmospheric models to produce multi-annual retrospective analyses, or “reanalyses” [e.g., 5], while machine learning enables data-driven prediction [e.g., 6].
From Monitoring…
Using thermal infrared data from instruments such as the Thermal Emission Spectrometer onboard Mars Global Surveyor, the Thermal Emission Imaging System onboard Mars Odyssey, the Mars Climate Sounder onboard Mars Reconnaissance Orbiter, and the Emirates Infrared Spectrometer onboard the Emirates Mars Mission, we have produced a reconstruction of daily maps of column dust optical depth (CDOD) spanning 14 Martian years (MY 24–37). These maps represent one of the longest consistent, observation-based, multi-instrument climatological records produced to date for a key Martian weather-relevant variable [7]. Among many applications, they are used as “dust scenarios” in the Mars Climate Database [8]
However, the observational coverage remains spatially sparse, requiring interpolation techniques, such as kriging or the use of climatological values, to complete the gridded maps. To move beyond purely spatial interpolation, we have developed a dynamical interpolation approach inspired by data assimilation. In this approach, incomplete gridded CDOD maps with a 6-hour cadence are assimilated into the Mars Planetary Climate Model (PCM; see [9]) using an adaptation of the Analysis Correction assimilation scheme [10], in which analysis increments are gradually introduced into the model integration.
Figure 1 illustrates the scheme concept. Figure 2 presents an application to the reconstruction of the diurnal evolution of a regional dust storm over one sol, compared with both a model-only simulation and the incomplete gridded maps. Figure 3 shows a similar reconstruction for daily averages over multiple sols, compared with both the model-only simulation and complete maps produced by combining gridding and kriging.

Figure 1: Schematic of the implemented dynamical interpolation approach. Example for MY 36, SOY 584, Ls ~ 313°, MUT 21:00, using incomplete gridded maps at MUT 03:00, 09:00, 15:00, and 21:00 (a). Other boxes show: (b) Mars PCM background CDOD, (c) CDOD assimilation increment, (d) analysis equation, and (e) analysis-derived CDOD rescaling factor used to adjust the dust tracer before transport.

Figure 2: Comparison of the diurnal evolution of a regional dust storm (MY 36, SOY 584) among the PCM simulation, dynamical interpolation with the data assimilation scheme, incomplete gridded CDOD maps used as assimilation input (1-sol time window), and incomplete gridded maps reconstructed using time windows of up to 3 sols. All maps show extinction CDOD at 9.3 μm.

Figure 3: As in Figure 2 but showing the evolution of the same dust storm over 6 sols. Each map corresponds to a daily average. Kriging was also used for the bottom raw.
…to Forecasting
The products shown in Figures 2 and 3 represent a first step toward the implementation of a full data assimilation system for Martian weather, which could ultimately be used to produce initial conditions for numerical Martian weather forecasts. Although the underlying assimilation approach is established, the system is designed to be flexible and expandable, with future operational applications in mind.
A complementary approach to numerical weather forecasting is data-driven forecasting using machine learning (particularly deep learning models), which has recently shown promising results in terrestrial weather prediction. We have therefore begun exploring deep learning approaches by training convolutional forecasting models on a multi-annual reanalysis dataset [5] and multi-annual model-only simulations [4].
Figure 4 shows preliminary results from a ConvLSTM model applied to daily averaged CDOD prediction with a one-sol lead time. In this experiment, the model was trained on a single Martian year (MY 26) and tested on another year (MY 24), using 60% of the data for training and 40% for testing. We report the resulting model performance on the test set in Table 1. A skill score of 18% relative to persistence indicates that the model improves on a persistence forecast by 18% at a one-sol lead time. Because the standard-deviation ratio is below 1, the current model appears to underestimate variability. Similarly, a sharpness ratio below 1 suggests that the model still struggles to reproduce sharp gradients and tends to smooth spatial structures.

Figure 4: Example of CDOD field prediction using a ConvLSTM model. Left panel: observed field at the initial time (MY 24, SOY 457, LS ≈ 233°). Central panel: one-sol-ahead prediction produced by the model, using the seven preceding daily fields as input. Right panel: observed field corresponding to the prediction.

References
[1] Montabone et al., EPSC2021-625, https://doi.org/10.5194/epsc2021-625 (2021).
[2] Cardesin-Moinelo et al., EPSC2026-928 (2026)
[3] European Space Agency. The European Exploration Strategy: Explore2040. ESA (2024).
[4] Pierron et al., EPSC-DPS2025-724, https://doi.org/10.5194/epsc-dps2025-724 (2025).
[5] Valeanu et al., NERC EDS Centre for Environmental Data Analysis, https://dx.doi.org/10.5285/cd037a9ea387438fabf4d674dbe53088 (2026).
[6] Uprety et al., Proceeding of the DARES’25-ECAI 2025 workshop, Bologna, Italy (2025)
[7] Lombard et al., EPSC-DPS2025-1765, https://doi.org/10.5194/epsc-dps2025-1765 (2025).
[8] Millour et al., EPSC2026-776 (2026).
[9] Forget et al., 7th Mars Atmosphere Modeling and Observation workshop, Paris, France (2022).
[10] Lorenc et al., Q. J. R. Meteorol. Soc., 117, 59–89 (1991)
How to cite: Montabone, L., Lombard, T., Guyon, V., Le Dantec, J., Pierron, T., Forget, F., Millour, E., and Boukhobza, Y.: Weather on Mars: From Monitoring to Forecasting, Europlanet Science Congress 2026, The Hague, The Netherlands, 7–11 Sep 2026, EPSC2026-1310, https://doi.org/10.5194/epsc2026-1310, 2026.
We summarize here the contributions of an international consortium of atmospheric and magnetospheric scientists, for the study and development of future Mars missions based on small satellites and compact instrumentation.
Past and present Mars orbiters have focused mostly on targeted, high-resolution observations, but lacked continuous global coverage. Yet key atmospheric phenomena—such as clouds and dust storms—and space weather processes, including solar wind interactions, aurorae, and radiation, require simultaneous, global, and sustained measurements to properly characterize Mars’ dynamic climate and environment. Continuous monitoring is essential both for scientific understanding and for enabling future robotic and human exploration.
“Mars GRADIVUS” is a Spanish ESA Prodex study led by a collaboration between INDRA/Deimos, IAA, Aurora SSC Space, INTA, UPV, and Thales Alenia Space. Its goal is to assess the technical feasibility of cost-effective CubeSats delivering high-value science at Mars using a New Space approach. Conceived as a flexible piggyback payload, it aims to demonstrate the scientific viability of a CubeSat dedicated to monitoring the Martian atmosphere and space weather. [Cardesin 2025, and proceedings of CPESS-8, Paths2Space & SEA2026]
Building upon this study, the “MACAWS” (Mars Constellation for Atmosphere and Space Weather Studies) mini-F proposal to ESA is a low-cost constellation of three spacecraft in high-altitude orbit (~17,000 km). Designed for the 2030s, MACAWS would provide the first quasi-global, simultaneous, high-cadence monitoring of Mars’ lower atmosphere and near-space environment across the full diurnal cycle, with a modular architecture supporting international contributions. [Montabone 2025 & 2026: EPSC-DPS2025 and 46th COSPAR 2026]

These efforts align with the priorities of European Space Agency (Voyage 2050, TerraNovae2030+), NASA’s Mars Exploration Future Program, and the International Mars Exploration Working Group (IMEWG), through its Access to Mars and Infrastructure for Lower-Cost Missions (LCM).
Keywords: Mars, Small Satellites, Mars Atmosphere, Space Weather, Global Monitoring
References:
[Cardesin 2025]: Mars Small Satellite Missions: Mars Gradivus Study and New ESA Mini-F Proposal for Mars Global Meteorology and Space Weather. CPESS-8 Proceedings https://spainportugal-eps.org/images/cpess-8/20250314093504_cpess-8-cardesinmoinelo.pdf
[Montabone 2026]: The Mars Constellation for Atmosphere and Space Weather Studies (Macaws) Mission Concept. 46th COSPAR Scientific Assembly 2026
[Montabone 2025]: Science Case for the MArs Constellation for Atmosphere and space Weather (MACAWS) mission concept EPSC-DPS2025-2067 https://doi.org/10.5194/epsc-dps2025-2067
How to cite: Cardesin-Moinelo, A., Montabone, L., Lopez-Valverde, M. A., and Hernandez-Bernal, J. and the Mars GRADIVUS and MACAWS science consortia: Small Missions for Mars Global Meteorology and Space Weather: Mars GRADIVUS Study and MACAWS Mini-F Proposal, Europlanet Science Congress 2026, The Hague, The Netherlands, 7–11 Sep 2026, EPSC2026-928, https://doi.org/10.5194/epsc2026-928, 2026.
Mars was long thought to be in a quiescent state with minimal geodynamic processes taking place at present. However, NASA's InSight mission shed light on the planet's present-day tectonic activity, part of which is likely related to mantle plumes and associated magmatic that, in the recent past, might have contributed to building up the Martian atmosphere through mantle outgassing. We propose a dedicated gravimetric satellite mission for Mars: the Mars Quantum gravity sensing of Interior Structure and atmosphere mission (MaQuIS) to understand these intricate dynamic processes and use gravity observations to constrain the interior structure and geologic evolution of the red planet. The mission will enable us to decipher Mars' ongoing geodynamic activity, the structure of its lithosphere, as well as to probe for subsurface water reservoirs and to characterise the temporal dynamics of the atmosphere. MaQuIS follows a well-crafted mission scenario, inherited from the successful Gravity Recovery and Climate Experiment (GRACE) and Gravity Recovery and Interior Laboratory (GRAIL) missions deployed around Earth and the Moon, respectively. Compared to its predecessors, MaQuIS will include state-of-the-art quantum sensing technologies to improve the detection of fine variations in Mars' gravitational field and maximize the mission's scientific return. MaQuIS will contribute to the following main science objectives:
1. Uncover the evolution of Mars by studying interior dynamics, detailed structure and composition of the planet's lithosphere and deep mantle.
2. Capture Mars' climate history by monitoring the density of the planet's upper atmosphere and uncover the monthly, seasonal, and long-term changes.
3. Explore potential scenarios for the fate and sequestration pathways of Mars' surface liquid water.
These primary mission goals will have profound and long-lasting impacts on the study of Mars, shedding new light on Mars' geologic evolution and ongoing interior and atmosphere activity.
Activities are ongoing to increase the TRL-level of the instrument technology. Both improved systems for the main instruments are being developed. LRI link acquisition is being developed to improve the initialisation phases. Also, other laser frequencies are being looked at to be able to share laser sources for the LRI and CAI accelerometers. Improvements of the internal layout of the CAI instrumentation help in detecting bottlenecks in the new technology. Mission design studies are improving the understanding of the impact of certain orbit choices to the precission and coverage of the observations. Finally we will also present some preliminary CFD studies performed on the whole mission design, highlighting that the mission is technological feasible and will provide excellent data to improve our understanding of Mars.
How to cite: Root, B., Wörner, L., and Weigelt, M. and the MaQuIS consortium: Research opportunities with MaQuIS - updates and continuation of a dedicated consortium, Europlanet Science Congress 2026, The Hague, The Netherlands, 7–11 Sep 2026, EPSC2026-815, https://doi.org/10.5194/epsc2026-815, 2026.
We present work supporting the preliminarily selected MeteorCam instrument for the LightShip-1 mission (shown in Fig.1). Earlier LightShip studies considered both nightside Martian fireball imaging and in situ dust impact detection [1], but our focus is the selected space-based meteor camera concept and how modelling can define its expected scientific return. This supports MEPAG Goal IV, Sub-Objective A2, which calls for characterization of the meteoroid environment around Mars before future exploration [2].

Fig.1 MeteorCam global architecture, with envelope dimensions 100x100x150 mm3
Using our Mars meteoroid simulation framework (example of simulated Mars meteors are shown in Fig.2), we evaluate the types of fireballs detectable from orbit with a SPOSH/MeteorCam-type instrument [3,4]. The platform altitude is 5720 km, with 20 degrees inclination and a 46 degree field of view covering the full Martian disc and part of the surrounding atmosphere. The current concept assumes 15 FPS, an apparent stellar limiting magnitude of +4 mag, a spectral range of 400–800 nm, and optical transmission above 85%.

Fig.2 Earth meteors re-simulated in the Martian atmosphere at corrected Mars speeds of 50 and 15 km/s.
To place MeteorCam in a broader measurement context, we also discuss a possible complementary dust analyzer and estimate the meteoroid flux it could encounter at Mars (shown in Fig.3). We consider particles larger than 0.1 mm, which are most relevant to spacecraft risk [5] and aligned with the MEPAG objective [2]. Such measurements would be valuable, but direct in situ detection of a statistically significant number of particles may be challenging because of realistic detector-area and mission-lifetime limits [1].

Fig.3 Preliminary Flux results of meteoroids ranging from 10-6 to 10 g, in the ram, wake and zenith direction at 5720 km from Mars
To address these low-number statistics, we compare the potential science return from direct impact measurements with that from observing meteors produced by mm-sized meteoroids, which are expected to be much more readily detectable than direct impacts from mm-sized particles. Our meteor predictions use 144 observed sporadic meteors with peak absolute magnitudes near +2 at Earth. Their physical properties were inferred using an erosion-fragmentation model [6] and dynamic nested sampling [7,8], then re-simulated in the Martian atmosphere [9]. Predicted Martian meteors reach peak absolute magnitudes of +2 to +7 (Median absolute magnitude profiles shown in Fig.4). The fastest events remain similar in brightness to their Earth counterparts, while slower ones become fainter. Most Martian luminous emission occurs between 55 and 110 km altitude, compared with 80 to 120 km at Earth, and trail lengths on both planets average about 20 km [9]. We also examine ground-based, low-orbit, and high-orbit cameras; wide and narrow fields of view; and possible spectral capabilities. This maps trade-offs among detection rate, spatial coverage, brightness sensitivity, and data quality.

Fig.4 Median absolute magnitude profiles as a function of height for the Earth observations of mm size meteoroids and the corresponding Mars predictions.
References:
[1] Ball, A. J. et al. (2025). A Strawman Mars Dust & Debris Monitor for LightShip. ESA-E3P-LS1-TN-010, Issue 1.0.
[2] Mars Exploration Program Analysis Group (MEPAG) (2020). Mars Science Goals, Objectives, Investigations, and Priorities: 2020 Version.
[3] Oberst, J. et al. (2011). The Smart Panoramic Optical Sensor Head (SPOSH): A camera for observations of transient luminous events on planetary night sides. Planetary and Space Science, 59, 1–9.
[4] Christou, A. A. et al. (2012). Orbital observations of meteors in the Martian atmosphere using the SPOSH camera. Planetary and Space Science, 60, 229–235.
[5] Moorhead, A., Cooke, B., Blaauw, R., Moser, D., & Ehlert, S. (2019). A meteoroid handbook for aerospace engineers and managers. NASA/TM-2019-220142.
[6] Borovička, J., Spurný, P., & Koten, P. (2007). Atmospheric deceleration and light curves of Draconid meteors and implications for the structure of cometary dust. Astronomy & Astrophysics, 473, 661–672.
[7] Speagle, J. S. (2020). dynesty: A dynamic nested sampling package for estimating Bayesian posteriors and evidences. Monthly Notices of the Royal Astronomical Society, 493, 3132–3158.
[8] Vovk, M., Brown, P. G., Vida, D., Lee, D., & Harmos, E. G. (2026). Inferring meteoroid properties with dynamic nested sampling: A case study of Orionid and Capricornid shower meteors. Icarus, 116963.
[9] Vovk, M., Brown, P. G., & Vida, D. (2026). From Earth Meteors to Mars: Predicting Where to See the First Martian Meteors. Manuscript submitted to Advances in Space Research.
How to cite: Vovk, M., Brown, P., Vida, D., Millinger, M., and Koschny, D.: Constraining the Martian Meteoroid Environment: Supporting the Preliminarily Selected MeteorCam for LightShip-1, Europlanet Science Congress 2026, The Hague, The Netherlands, 7–11 Sep 2026, EPSC2026-66, https://doi.org/10.5194/epsc2026-66, 2026.
The recent push to develop Mars terraforming technologies, increasingly driven by unaccountable private wealth, risks the irreversible destruction of planetary records we have barely begun to read. In this sense, terraforming Mars would be akin to the destruction of the Library of Alexandria. Echoing Carl Sagan’s words about the library, in this piece we argue that we should not let such an extensive loss of information happen again. As terraforming Mars would melt and destroy the icy record on Mars, we suggest closing an important gap in the COSPAR planetary protection framework, by expanding regulations on preventing biological contamination to preventing large-scale atmospheric modification and destruction of cryospheric and geologic records.
How to cite: Roelofs, L., Koeppel, A., Vrech, S., Rutledge, A., Turbet, M., and Edwards, C.: The Martian Library of Alexandria- Why Terraforming Risks Destroying a Great Unread Archive, Europlanet Science Congress 2026, The Hague, The Netherlands, 7–11 Sep 2026, EPSC2026-54, https://doi.org/10.5194/epsc2026-54, 2026.
Please decide on your access
Please use the buttons below to download the supplementary material or to visit the external website where the presentation is linked. Regarding the external link, please note that Copernicus Meetings cannot accept any liability for the content and the website you will visit.
Forward to presentation link
You are going to open an external link to the presentation as indicated by the authors. Copernicus Meetings cannot accept any liability for the content and the website you will visit.
We are sorry, but presentations are only available for conference attendees. Please register for the conference first. Thank you.
Hyperspectral imaging has become one of the main tools for mineralogical mapping on Mars, particularly through CRISM observations acquired by the Mars Reconnaissance Orbiter (MRO). These datasets have enabled the identification of hydrated minerals, phyllosilicates, sulfates, and silica-bearing deposits associated with ancient aqueous environments, including candidate landing sites such as Oxia Planum [1,2]. Indeed, hydrated silica has previously been reported in this region within the Hydrated Silica-bearing Unit (HSU) [3], together with possible sulfates associated with an absorption feature around 1.75 µm [3].
In the literature, several approaches have been employed for mineralogical determination in satellite images, including DAFA/TT (Dynamic Aperture Factor Analysis/Target Transformation) [4], Spectral Angle Mapper (SAM) [5], abundance-based mapping methods using peak or maximum abundance criteria [6], and spectral unmixing models [7].
These approaches differ in stability, sensitivity to preprocessing, and susceptibility to false positives, especially under variable image quality conditions. SAM is simple and relatively robust to illumination effects but can become unstable when spectra are noisy or highly mixed, leading to ambiguous classifications in spectrally similar materials. Abundance-based mapping methods relying on peak abundance values are sensitive to endmember selection and may produce false positives when noise or residual atmospheric effects generate spurious maxima. DAFA/TT improves robustness through local subspace modelling, but results depend on window size, noise levels, and preprocessing choices, affecting detection consistency. Non-negative Matrix Factorization provides physically interpretable endmembers and abundance maps and can better represent mixed systems, but it is sensitive to initialization, constraints, and convergence issues, which may lead to different solutions under different preprocessing pipelines.
Consequently, definitive validation remains difficult due to the lack of Martian samples and in situ ground-truth analyses in Oxia Planum.
In this study, five CRISM images (frt0000810d_07_if166j_ter3, frt00009a16_07_if166s_trr3, frt0000810d_07_if166j_ter3, frt00009a16_07_if166j_mtr3, and frt00009a16_07_if166j_ter3) were analyzed after atmospheric and photometric correction. Different preprocessing strategies, including ratioing against the lowest-albedo spectrum within each region, Savitzky–Golay smoothing, first derivatives, and Standard Normal Variate (SNV) normalization, were applied to evaluate their effect on noise reduction and spectral feature enhancement under different data quality conditions.
To improve the robustness of mineralogical detections, supervised DAFA/TT and unsupervised MCR-ALS (Multivariate Curve Resolution–Alternating Least Squares) with non-negativity constraints were compared under different preprocessing strategies and image qualities, together with Spectral Angle Mapper (SAM) and abundance-based mapping approaches. Convergent detections across methods were used as an indicator of stability and reduced likelihood of false positives within the analyzed ROIs [5].
Data quality is the primary limiting factor in the interpretation of the results. DAFA/TT yielded positive detections compatible with serpentine and carbonate phases; however, MCR-ALS results showed significant ambiguity, preventing an unequivocal confirmation of these mineral phases. Pixel-by-pixel spectral analysis indicates that the investigated regions are characterized by complex mineralogical mixtures combined with residual spectral noise. These mixtures appear dominated by hydrated silica, as indicated by absorption features around 1.9 µm, consistent with previous studies [3], although contributions from Al–Fe phyllosilicates (~2.3 µm), carbonates (~2.3 and 2.5 µm), and sulfates (~1.7 µm) may also be present.
The results highlight several key limitations in mineralogical discrimination: (i) absence of pure mineral phases within ROIs; (ii) limited spatial resolution (~18 m/pixel), leading to subpixel mixing; (iii) residual spectral noise, which can exceed diagnostic absorption features; (iv) lack of realistic mineral mixtures in spectral libraries used for semi-supervised models; (v) intrinsic rotational ambiguity in MCR-ALS even under non-negativity constraints [7]; and (vi) strong dependence on image quality and dataset selection. Additionally, preprocessing choices significantly influence mineral identification and can affect the occurrence of false positives across methods.
Overall, the applied methods show complementary strengths but also distinct limitations. Rather than providing a single definitive solution, they offer complementary and sometimes inconsistent perspectives on the same data. In this context, cross-disciplinary chemometric strategies that combine and critically compare multiple approaches, instead of relying on a single method, improve interpretability and enhance the robustness of mineralogical conclusions derived from hyperspectral data.
Keywords: Remote sensing, Chemometrics, Spectral Unmixing Models, DAFA/TT, Mineralogical Identification
Acknowledgements: Work supported through the PAMMAT project (Grant No. PID2022-142750OB-I00), funded by the Spanish Agency for Research (through the Spanish Ministry of Science and Innovation, MCIN, and the European Regional Development Fund, FEDER).
References
[1] Murchie, S., Arvidson, R., Bedini, P., Beisser, K., Bibring, J. P., Bishop, J., ... & Wolff, M. (2007). Compact reconnaissance imaging spectrometer for Mars (CRISM) on Mars reconnaissance orbiter (MRO). Journal of Geophysical Research: Planets, 112(E5).
[2] Quantin-Nataf, C., Carter, J., Mandon, L., Thollot, P., Balme, M., Volat, M., ... & Broyer, J. (2021). Oxia Planum: The landing site for the ExoMars “Rosalind Franklin” rover mission: Geological context and prelanding interpretation. Astrobiology, 21(3), 345-366.
[3] McNeil, J. D., Grindrod, P., Tornabene, L. L., Fawdon, P., & Rangarajan, V. G. (2025). Hydrated Silica in Oxia Planum, Mars. Journal of Geophysical Research: Planets, 130(9), e2025JE008989.
[4] Lin, H., Tarnas, J. D., Mustard, J. F., Zhang, X., Wei, Y., Wan, W., ... & Kellner, J. R. (2021). Dynamic aperture factor analysis/target transformation (DAFA/TT) for Mg-serpentine and Mg-carbonate mapping on Mars with CRISM near-infrared data. Icarus, 355, 114168.
[5] Yuhas, R. H., Goetz, A. F., & Boardman, J. W. (1992, June). Discrimination among semi-arid landscape endmembers using the spectral angle mapper (SAM) algorithm. In JPL, summaries of the third annual JPL airborne geoscience workshop. volume 1: AVIRIS workshop.
[6] Clark, R. N., Swayze, G. A., Livo, K. E., Kokaly, R. F., Sutley, S. J., Dalton, J. B., ... & Gent, C. A. (2003). Imaging spectroscopy: Earth and planetary remote sensing with the USGS Tetracorder and expert systems. Journal of Geophysical Research: Planets, 108(E12).
[7] De Juan, A., & Tauler, R. (2006). Multivariate curve resolution (MCR) from 2000: progress in concepts and applications. Critical reviews in analytical chemistry, 36(3-4), 163-176.
How to cite: Alberquilla, F., Gorla, G., Martínez-Arkarazo, I., Aramendia, J., Coloma, L., Arana, G., and Madariaga, J. M.: Exploring Alternative Data-Analysis Strategies for Mineralogical Identification in Hyperspectral Images of Oxia Planum, Europlanet Science Congress 2026, The Hague, The Netherlands, 7–11 Sep 2026, EPSC2026-1313, https://doi.org/10.5194/epsc2026-1313, 2026.
The ExoMars Rosalind Franklin Rover, set to launch in 2028, is equipped with a payload of instruments designed to facilitate the search for signs of ancient microbial life at the Martian surface and sub-surface to a depth of 2 m [1]. The landing site, Oxia Planum, has been selected based on engineering and science requirements and its unique geological setting, which consists of clay-rich deposits capped by a unit that may have shielded potential biosignatures from degradation due to cosmic ray bombardment and oxidation at the Martian surface. The site exhibits remote-sensing evidence for periodically available liquid water in the Noachian era (i.e. a high likelihood of habitability) and a phyllosilicate-bearing clay unit which could retain organic matter within its structure (i.e. high biosignature preservation potential), making it a compelling location for the detection of potential Martian biosignatures [2].
The Panoramic Camera (PanCam) instrument on board Rosalind Franklin is equipped with two wide-angle cameras (WACs) and a high-resolution camera (HRC) designed to perform geological characterisation of the landing site and aid in target selection for further analysis. The WACs provide stereographic multispectral images of science targets with 11 geological filters, encompassing a spectral range of 440–1000 nm [3], and will be used in tandem with Enfys, a linear variable filter spectrometer with spectral range of 0.9–2.5 µm, to perform geochemical analysis on outcrops to determine their suitability as drill target locations [4]. The Close-Up Imager (CLUPI) instrument [5] provides complementary high-resolution imagery of science targets, revealing texture, colour and rock structure to aid in their geological characterisation. Together, these instruments are vital for detecting the presence of any potential biosignatures and ensuring that the limited sub-surface samples collected during the mission are of high scientific quality.
Rover resources during the mission are limited, and plans must have some level of reactivity on a sol-to-sol basis to account for our evolving understanding of the landing site. To facilitate cross-instrumental analysis between HRC, the WACs, CLUPI and Enfys-representative spectrometer data, a library of mission-representative data products of Oxia Planum analogues will be collected. This library, obtained using nominal operational recommendations under a controlled environment, simulates a single rover operational cycle as would be performed during the mission, highlighting the optimal observational conditions for geological features of interest across a range of scales. Operational recommendations for the instruments will be derived from this database, highlighting areas of instrument overlap (both scientific and geometric) or particularly complementary data collection procedures (such as assessing the gain in data type and diversity that contributes to geological interpretation between WAC and HRC observations on a single target).
10 samples—including clay-rich, biosignature-bearing samples, samples containing hydrated silica, samples displaying ‘reduction spots’, and potential target contaminants e.g. dust simulants—have been curated for data collection across the PanCam and CLUPI instruments. These samples have been selected based on prior analysis of CRISM and OMEGA data at Oxia Planum, amongst others, in numerous studies [2] [6] [7], with some samples selected due to similarities to small-scale features that would not be discernible at remote sensing scales (e.g. samples selected based on the potential detection of redox-driven mineral associations in Jezero crater [8]). Samples have been analysed using the PanCam training model (TM), with future planned analysis using the CLUPI enhanced engineering model (EM+), producing a reference library of mission-representative data products across varying operationalparameters (e.g. observation distance and angle, illumination conditions, and exposure time).
This study acts as a cross-instrumental, data driven approach to quantifying instrument contribution to overall data downlink on a given target to optimise data return and inform future operations cycles, and is complementary to ongoing work on cross-instrumental geological characterisation across the ExoMars SOWG.
[1] Vago J. L. et al. (2017) Astrobiology, Vol. 17, No. 6–7 [2] Quantin-Nataf C. et al. (2021) Astrobiology, Vol. 21, No. 3 [3] Coates A. J. et al. (2017) Astrobiology, Vol. 17, No. 6–7 [4] Boyd, A. M., et al. (2025) Next-Generation Spectroscopic Technologies XVII. Vol. 13449 pp. 26-42 [5] Josset J. L. et al. (2017) Astrobiology, Vol. 17, No. 6-7 [6] McNeil, J. D., et al. (2025) Journal of Geophysical Research: Planets, 130, No. 9 [7] Harris, E., et al. (2024) Journal of Geophysical Research: Planets, 129, No. 11 [8] Hurowitz, J. A., et al. (2025) Nature 645.8080, pp. 332-340.
How to cite: Raynor, H., Warrilow, R., Preston, L., Coates, A., Josset, J.-L., Bontognali, T., Rüsch, O., Foucher, F., and Hickman-Lewis, K.: Geological Characterisation of Oxia Planum Analogues using ExoMars Rosalind Franklin Instrument Emulators, Europlanet Science Congress 2026, The Hague, The Netherlands, 7–11 Sep 2026, EPSC2026-568, https://doi.org/10.5194/epsc2026-568, 2026.
Oxia Planum, the selected landing site for ESA’s ExoMars Rosalind Franklin Mission (RFM), is a window to deposits from the period of martian history most conducive to biosignature formation and preservation where the RFM aims to identify signs of life and characterize the geochemical environment in the subsurface as a function of depth. In preparation for this mission ESA, a program of high resolution morphostratigraphic mapping and analysis has been conducted to provide context for in-situ sample analysis and to serve as an input into strategic planning for rover operations.
We present work that combines high-resolution mapping of the ~50 km landing zone (Fawdon et., al 2024) with regional (~500 km) remote sensing observation using HiRISE (McEwen et al., 2007) and CaSSIS (Thomas et al., 2017) data to interpret stratigraphy and propose our best working explanations for the geological history recorded and paleoenvironmental scenarios thus identifying key hypotheses for the mission to test and discus how future RFM observations will impact these questions and our wider understanding of Mars.
Our investigations suggest: The oldest units, the phyllosilicate-rich Lower Bedrock Group, represent altered basement or transported material from western Arabia Terra. The phyllosilicates could be both authigenic and detrital clays in different areas and in the wettest scenarios related to a northern ocean. After infilled impact structures mark an erosional phase.
The Upper Bedrock Group is lighter-toned and unconformable, likely formed through rapid deposition (e.g., volcaniclastic?) with reworking in the upper part of the group by aggrading fluvial systems.
Above this lies a remnant regional layer (McNeil et al., 2022), preserved as mound tops, though its origin and erosional processes remain uncertain. A second erosional phase reactivated fluvial networks, forming U-shaped channels and depositing an overlying Dark Material, associated with inverted sediment fans and hydrated silica horizons east of the landing site. The final, wind-dominated erosional phase, continuing today, produced inverted crater fills, reduced mound size, and exposed the Lower Bedrock Group.
These results provide essential context about the geological evolution of ancient Mars for RFM investigations into: Formation of clay-bearing terrain during the Noachian and possible northern ocean; Volcanic origins of regional layered terrains; Evolution of martian fluvial systems on intercrater plains; a Possible role for hydrothermal groundwater activity forming silica deposits and in preserving the enigmatic mounds. This work is a framework that will guide interpretation of RFM mission result providing context for the mission’s astrobiological goals and advance understanding of early martian environments.
How to cite: Fawdon, P. and Orgel, C. and the Oxia Planum high-resolution mapping analysis team: The geological history of Oxia Planum, landing site of the ExoMars Rosalind Franklin rover, Europlanet Science Congress 2026, The Hague, The Netherlands, 7–11 Sep 2026, EPSC2026-675, https://doi.org/10.5194/epsc2026-675, 2026.
Introduction: ExoMars Rosalind Franklin rover mission will land at Oxia Planum (OP) on Mars. OP is a 3.9Gyr old phyllosilicate-bearing plain located between Mawrth Vallis and Ares Vallis [1]. The Fe,Mg-rich phyllosilicate surfaces detected at Oxia Planum are some of the largest continuous exposures of this type on Mars. Yet understanding of the processes that led to its formation remain elusive.
Orbital NIR spectral features of the phyllosilicates at Oxia suggest Fe-rich vermiculite and/or saponite [3]. Survey of Fe-rich terrestrial vermiculite-bearing rocks [4,5] showed that the best spectral analogy is shown by the basaltic rocks from Granby, Massachusetts, USA. The Granby formation is represented by basaltic flows, dikes and tuffs, all of which altered. Amygdales in vesicular basalts are filled with diverse clay minerals [6]. Among them are micaceous minerals, Al-rich clays and Fe/Mg-rich clays [7]. There formation is investigated here.
Method: EQ3/6 geochemical models are performed using special reactants and solid solutions of olivine, pyroxene, and plagioclase, representing the average Granby tuff composition. The database was enriched with new data on diverse clays, and different scenarios of surface/subsurface alteration pathways are tested.
Relevance for Oxia Planum: Results from these models will be presented in terms of final mineral assemblages and compared with what is known about OP clays. Different scenarios presented in Mandon et al, 2021 will then be challenged regarding the mineral assemblages obtained in our models. Our results demonstrate the value of using analogues studies to decipher past water-rock interactions. By combining mineralogical and chemical analyses on analogues to geochemical models we can obtain a more comprehensive understanding of Mars’s hydrated surface.
Acknowledgments: This project was supported by the EU Horizon 2020 Space program call H2020-COMPET-2015-Grant Agreement no 687302. The study got support from the National Planetology Program (PNP) of the INSU-CNRS and from the CNES Research Proposal Call (APR).
References: [1] P. Fawdon et al., (2024) Journal of Maps 20(1). [2] J. Vago et al., (2017) Astrobiology 17:6-7. [3] L. Mandon et al, (2021) Astrobiology 21: 464-480. [4] A.M. Krzesińska et al, (2021) Astrobiology 21: 997-1016. [5] H. Dypvik et al, (2021) Planetary and Space Science, 208. [6] R. H. April and D. M. Keller (1992). Clays and Clay Minerals 40: 22-31. [7] Bultel, B., Krzesinska, A., Veneranda, M., Loizeau, D., & Werner, S. (2025, September). EPSC-DPS Joint Meeting 2025 (EPSC-DPS2025 (pp. EPSC-DPS2025).
How to cite: Bultel, B., Krzesinska, A., Veneranda, M., Loizeau, D., and Werner, S.: Geochemical modeling on Granby Tuffs clays to decipher alteration pathway at Oxia Planum, Mars, Europlanet Science Congress 2026, The Hague, The Netherlands, 7–11 Sep 2026, EPSC2026-842, https://doi.org/10.5194/epsc2026-842, 2026.
The early geological history of Mars is comparable to that of Earth, with a probable past presence of liquid water, CHNOPS elements, and energy sources, all of which are essential for a potential emergence of life. The absence of plate tectonics and limited erosion, which expose ancient terrains, make Mars a prime target for the search for traces of life and the study of the habitability of Earth like planets [1].
The Rosalind Franklin rover (ExoMars 2028 mission) will be sent to Mars in 2028. As it is equipped with a drill capable of digging up to 2 meters deep, it will be able to collect and analyze samples relatively protected from the harsh conditions of the surface (particularly radiations and perchlorates). The main objective of this mission is to search for biosignatures such as specific organic compounds (amino acids, carboxylic acids…) using an appropriated instrumental payload [2].
In particular, the Mars Organic Molecule Analyzer (MOMA) was designed to separate, detect and identify organic molecules. MOMA has two operational modes based on laser desorption or gas chromatography (GC), both coupled with mass spectrometry (MS) [3].
The organic molecules in the samples collected by the rover must be volatilized before being separated by GC and identified by MS. To do so, the samples can be either pyrolyzed or chemically derivatized. Derivatization agents (MTBSTFA, DMF-DMA, TMAH) are aboard the rover and can be used to increase the volatility of polar molecules while avoiding pyrolysis and potential degradation due to rising temperature.
Using a laboratory GC-MS setup, coupled with a pyrolizer, we perform the derivatization-GC-MS analysis of various solid analog samples. This setup reproduces the MOMA hardware constraints as closely as possible, particularly in terms of available time and temperature but also by performing online derivatization with a sample-to-agent ratio similar to that of the MOMA instrument. We studied both natural (from the Arctic, Mauritania…) and artificial samples from a set of samples selected by the ExoMars scientific team in order to test the capacity and complementarity of the rover's payload in detection of organic matter.
After optimizing the analytical sequence, we can detect molecules with strong exobiological potential (such as carboxylic acids, amino acids or nucleobases) in most of the samples.
Although our MOMA-like derivatization-GC-MS setup does not detect as many interesting molecules as other more sensitive laboratory instruments, we aim to explain this difference, determine its performance (limits of detection and quantification) and optimize its analytical parameters.
[1] Cockell, Trajectories of Martian Habitability, Astrobiology, 2014, vol 14, num 2
[2] Goesmann et al., The Mars Organic Molecule Analyzer (MOMA) Instrument: Characterization of Organic Material in Martian Sediments, Astrobiology, 2017, vol 17, num 6 & 7
[3] Vago et al., Habitability on Early Mars and the Search for Biosignatures with the ExoMars Rover, Astrobiology, 2017, vol 17, num 6 & 7
How to cite: Couderc, O., Bouhier, B., Azémard, C., Cottin, H., Govekar, T., Szopa, C., and Stalport, F.: Optimization of organic matter detection using MOMA-like procedures, Europlanet Science Congress 2026, The Hague, The Netherlands, 7–11 Sep 2026, EPSC2026-857, https://doi.org/10.5194/epsc2026-857, 2026.
The ExoMars 2028 Mission is a rover mission heading for Oxia Planum on Mars. The ground penetrating radar WISDOM (Water Ice Subsurface Deposit On Mars) will probe at least to three meters depth to provide insight into the shallow subsurface and to support finding suitable drill sites. To determine accurately the drill’s target depth, where the chance to find bio-signatures is higher compared to the surface, the knowledge of the permittivity is essential. Furthermore, it helps to determine the stratification and the respective thickness properties of the soil layers over a larger scale, i. e., when radar data is taken over a long travel distance.
To achieve an overview of the expected permittivity value range, several soil samples will be analyzed over the frequency range of WISDOM (0.5 GHz to 3.0 GHz). These samples were taken during former field tests (such as SAFER, ExoFit) as well as artificial Martian soil samples (e. g., JSC-1). Moreover, members of the Rover Science Operation Working Group provided reference samples from earth that serve as a reference for the landing site “Oxia Planum” according to what is known from remote sensing data.
For that analysis, a device employing a coaxial probe is used, which allow the measurement of the soil samples’ permittivity. The challenge for such measurement lie in the preparation of the samples to achieve a smooth contact area that minimizes the occurrences of air gaps. Depending on the samples’ constitution, either a flat, ground bulk material or a fine-grained powder will be used. For the latter, a drying treatment is applied to reduce the water content. Particularly for the samples in powder form, the pressure with which the coaxial probe is applied may have a non-negligible influence on the result.
In this work, we will present the results of the permittivity measurements with a focus on the WISDOM frequency range.
How to cite: Benedix, W.-S., Hegler, S., Plettemeier, D., and Ciarletti, V.: Permittivity Measurements for Oxia Planum Reference Samples, Europlanet Science Congress 2026, The Hague, The Netherlands, 7–11 Sep 2026, EPSC2026-890, https://doi.org/10.5194/epsc2026-890, 2026.
Analysing the surface expressions of Mars’ aqueous history is essential for reconstructing the environmental evolution of early Mars [1–3]. Oxia Planum, the landing site for ESA’s Rosalind Franklin rover [4,5], preserves extensive geomorphological and mineralogical evidence of sustained aqueous activity, including valley networks, sedimentary deposits, and widespread clay-bearing terrains indicative of prolonged water–rock interaction and environmental conditions potentially favourable for past habitability [4,6,7]. While the Oxia Planum landing ellipse has been extensively characterised, the surrounding catchment region remains comparatively underexplored at the regional scale, despite likely acting as a major sediment source and hydrological conduit delivering detrital and aqueously altered materials into the basin [6,8]. In this work, we investigate the mineralogical variability of the catchment using integrated CRISM, CaSSIS, and HiRISE datasets.

Figure 1. Targeted HiRISE observation (ESP_092719_1970) for this study showing an IRB colour composite of a potential chloride-bearing locality within the Oxia Planum catchment region.
CRISM observations reveal widespread low-calcium pyroxene-bearing terrains throughout the Coogoon Valles catchment, suggesting preservation of an LCP-rich mafic substrate across much of the regional crust, while more localised HCP-bearing materials indicate lithological variability within the crust. Distinct clay-bearing assemblages are additionally identified within altered sedimentary and channel-associated terrains from ratioed spectra, including extensive Fe/Mg-smectite-bearing units extending into the eastern catchment, and possible kaolinite-bearing signatures associated with crater rim terrains, potentially indicating localised alteration environments. These assemblages suggest spatially variable alteration of a predominantly mafic crustal substrate throughout the catchment system.
Targeted CaSSIS observations acquired for this investigation examine several bright-toned channel-associated deposits potentially consistent with chloride-bearing terrains [9] that exhibit distinct colour variability in false-colour NPB composites, colour band ratio composites, and decorrelation stretched imagery. Targeted HiRISE observations further reveal surface textures consistent with altered or evaporitic materials, alongside IRB colour characteristics comparable to previously identified chloride signatures (Figure 1) [10].
These observations provide new constraints on the mineralogical and hydrological evolution of the Oxia Planum catchment system and highlight the importance of regional-scale orbital investigations for reconstructing aqueous and sedimentary processes beyond the landing ellipse, providing broader geological context for assessing the habitability potential of the wider Oxia Planum system.
[1] Bibring et al., 2006, Science [2] Carr and Head, 2010, Earth and Planetary Science Letters [3] Carter et al., 2015, Icarus [4] Quantin-Nataf et al., 2021, Astrobiology [5] Vago et al., 2017, Astrobiology [6] Mandon et al., 2021, Icarus [7] Brossier et al., 2024, Journal of Geophysical Research: Planets [8] Fawdon et al., 2022, Journal of Geophysical Research: Planets [9] Osterloo et al., 2008, Science [10] Bickel et al., 2024, Scientific Data.
How to cite: Warrilow, R., Tornabene, L. L., Preston, L. J., and Coates, A.: Spectral characterisation of the Oxia Planum basin catchment area with CRISM, CaSSIS, and HiRISE., Europlanet Science Congress 2026, The Hague, The Netherlands, 7–11 Sep 2026, EPSC2026-1193, https://doi.org/10.5194/epsc2026-1193, 2026.
Direct link to the application: https://maps.planet.fu-berlin.de/jezero
Introduction
The Jezero Hiking Map is an interactive web map with embedded Points of Interest (POIs) designed to bring the Martian landscape explored by NASA's Perseverance rover to researchers and the public. The system combines precise geographic mapping with immersive visualization capabilities to create a virtual exploration experience. One of the key POI layers consists of Mastcam-Z 360° panoramas that can be viewed either in a web browser or using a virtual reality (VR) device. These panoramas, captured by the rover's stereo camera system, provide unprecedented visual detail of the Martian surface. The interactive experience allows users to dynamically explore the panoramas, including pixel-level zooming capabilities that enable examination of subtle geological features and textures. When using a VR device, the panoramas are displayed in stereo, creating an enhanced sense of depth and immersion that closely mimics the experience of standing on the Martian surface. By integrating these panoramas with the map, they are spatially anchored and provide a clear geographic context, allowing users to understand both the specific details visible in each panorama and their relationship to the broader Jezero Crater landscape. This multi-scale approach bridges the gap between macro-level geographic understanding and micro-level feature examination, creating a powerful tool for both scientific analysis and public engagement.
Technical Foundation
The Jezero Virtual Hiking Map employs a hybrid architecture that combines OpenLayers for the base mapping functionality with the krpano panorama viewer for immersive 360° experiences. This integration creates a seamless workflow where OpenLayers provides the primary web map interface, handling the base map rendering of Jezero Crater topography, management of multiple data layers including geological and topographical information, navigation controls and spatial reference system management, as well as POI placement and visualization. The krpano library is used to render and interact with the high-resolution Mastcam-Z panoramas when users select a panorama POI from the map. This specialized panorama viewer offers support for extremely high-resolution panoramic images, multi-resolution loading for optimal performance, smooth navigation and pixel-level zoom capabilities, and stereoscopic rendering for VR devices.
Data Processing and Integration
Each panorama POI on the OpenLayers map represents a specific location where the Perseverance rover captured Mastcam-Z imagery. When a user selects one of these POIs, the application loads the corresponding krpano scene configuration, initializes the panorama viewer in a dedicated viewport, positions the initial view direction to maintain geographic context, and provides controls for navigation back to the main map. This approach allows for efficient data management, as the high-resolution panorama data is only loaded when requested, while the OpenLayers map maintains a lightweight overview of all available panorama locations. The tool provides direct link access to the individual panoramas. The REST-based URL format uses "360" for the collection, followed by the panorama ID matching the official Mastcam-Z site. Example: https://maps.planet.fu-berlin.de/jezero/360/52 (Vingeanne mosaic).
Future Development
As the Perseverance mission continues, several potential enhancements could expand the capabilities and utility of the Jezero Virtual Hiking Map. Planned enhancements include the integration of both enhanced color and natural color panoramas, allowing users to toggle between scientifically-calibrated color renderings and processed views that optimize visual interpretation of geological features. The incorporation of Mastcam-Z strategic mosaics would complement the existing 360° panoramas by providing high-resolution stereo imagery of targeted areas of interest, available in both enhanced and natural color, though covering smaller fields of view focused on specific geological features. Additionally, 3D digital outcrop models derived from stereo imaging and structure-from-motion techniques could enable detailed morphological analysis of rock formations and sedimentary structures. Interactive measurement tools would allow researchers to determine distances, angles, and dimensions directly within the panoramic views, facilitating quantitative analysis of geological features without requiring specialized software. These additions would further bridge the gap between qualitative visual exploration and rigorous scientific measurement, making the platform an increasingly powerful resource for both research and education as our understanding of the Martian surface continues to advance.
Acknowledgements
This work is funded by the Federal Ministry of Research, Technology and Space (BMFTR) through the German Space Agency at DLR on the basis of a resolution of the German Bundestag (Funding code: 50 OO 2601).
How to cite: Walter, S., Jaumann, R., Munteanu, R., Bell, J., Joseph, J., Abushunnar, R., Patermann, L., Coelho, T., and Postberg, F.: Jezero Virtual Hiking Map, Europlanet Science Congress 2026, The Hague, The Netherlands, 7–11 Sep 2026, EPSC2026-1006, https://doi.org/10.5194/epsc2026-1006, 2026.
Introduction
High-resolution Digital Terrain Models (DTMs) derived from HiRISE stereo observations are fundamental for the geomorphological analysis of the Martian surface, enabling meter-scale investigation of slopes, sedimentary bodies, aeolian landforms, impact-related features and candidate exploration terrains [1]. Open-source workflows based on ISIS and the NASA Ames Stereo Pipeline (ASP) have made HiRISE DTM generation broadly accessible to the planetary science community [2,3]. Since 2023, however, the intermittent failure of the RED4 CCD has produced a central data gap in many recent HiRISE observations. Because RED4 lies near the center of the focal plane (Figure 1), its loss disrupts CCD mosaicking, tone balancing and stereo processing more severely than edge-CCD losses, often causing standard pipelines to fail at the mosaicking or stereo-preparation stage. The HiRISE team has recently introduced a mitigation strategy [4] in which the overlapping IR10 CCD is radiometrically matched to the surrounding RED data and inserted in place of the missing RED4 as a synthetic component, named SYN4. Previous HiRISE stereo work has shown that these DTMs support ultrahigh-resolution topographic mapping and analyses of active Martian surface processes [5,6], while the September 2024 HiRISE/PDS release explicitly notes both the RED4 failure and the planned use of IR10 data to fill the gap for selected products [7]. While effective, this approach has so far been implemented within selected internal HiRISE pipelines and is not yet integrated into the openly available ASP/ISIS chain on which most external users rely.

Figure 1: HiRISE focal plane detector geometry and location of the RED4 gap. Relationship between RED4, IR10 and synthetic SYN4 component.
A RED4-aware ASP workflow
We present an adaptive HiRISE stereo processing workflow that integrates the SYN4/IR10 concept into a fully open-source ASP/ISIS chain. The workflow follows the standard sequence of image preparation, bundle adjustment, stereo correlation, point-cloud generation, DEM extraction and co-registration to reference topography, but introduces an automatic preprocessing step that checks the availability of RED4 for each input observation. When RED4 is missing, the workflow activates an IR10-based fallback prior to CCD mosaicking: IR10 is radiometrically matched to the adjacent RED CCDs and ingested as a SYN4 substitute, restoring the continuity of the RED mosaic before stereo reconstruction proceeds. This preserves the usability of stereo pairs that would otherwise fail at the mosaicking stage and keeps the rest of the chain unchanged, ensuring full reproducibility.
Test cases and validation
The workflow was tested on two HiRISE stereo pairs acquired in 2025 in Arabia Terra: ESP_088933_2200 / ESP_089012_2200 (convergence angle 28.0°) and ESP_089500_2200 / ESP_089645_2200 (convergence angle 12.4°). The two pairs were selected to evaluate the workflow under contrasting stereo geometries, an ideal high-convergence case and a marginal low-convergence case below the nominal HiRISE threshold. Both pairs were processed through the full pipeline, producing continuous DTMs across the RED4 gap with no visible seams or correlation drop-outs along the SYN4 strips (Figure 2, left). Vertical consistency was assessed against an independent HRSC reference DTM, chosen because its different instruments, mission and processing chain provide a fully external benchmark. A topographic profile crossing the SYN4 strip shows close agreement between the HiRISE and HRSC datasets along the entire ~9 km transect, with no detectable offset or discontinuity at the SYN4 boundaries (Figure 2, right). The agreement holds for both pairs, indicating that the IR10-based reconstruction does not introduce systematic vertical artefacts within the gap region, even in the marginal convergence-angle case.

Figure 2: Validation of the RED4-aware HiRISE workflow in Arabia Terra (~39.9°N, 26.5°E). Left: HiRISE DTMs generated from the two test stereo pairs (ESP_089500_2200/ESP_089645_2200 and ESP_088933_2200/ESP_089012_2200); red rectangles outline the RED4 gap, reconstructed through the IR10/SYN4 substitution. The black line indicates the NE–SW topographic transect. Right: ~9 km topographic profile across the SYN4 strip, comparing the HiRISE DTM (red) with the independent HRSC reference DTM (blue). The yellow box marks the most critical portion of the transect across the reconstructed gap; this sector is shown in detail in the upper inset, highlighting the continuity of the HiRISE topography and its agreement with the HRSC reference across the SYN4 boundaries.
Conclusion
By integrating the SYN4/IR10 concept into an open-source ASP-based workflow, this work provides a practical and reproducible solution for recovering scientific value from RED4-affected HiRISE stereo observations. The independent HRSC validation confirms that the reconstructed topography is consistent with external reference data across the gap region.
References: [1] McEwen, A.S., et al., 2007. Journal of Geophysical Research: Planets, 112, E05S02. doi:10.1029/2005JE002605. [2] Hepburn, A.J., Holt, T., Hubbard, B. and Ng, F., 2019. Geoscientific Instrumentation, Methods and Data Systems, 8, 293–313. doi:10.5194/gi-8-293-2019. [3] Kirk, R.L., et al., 2008. Journal of Geophysical Research: Planets, 113, E00A24. doi:10.1029/2007JE003000. [4] Beyer, R.A., Alexandrov, O. and McMichael, S., 2018. Earth and Space Science, 5, 537–548. doi:10.1029/2018EA000409. [5] Sutton, S.S., et al., 2022. Remote Sensing, 14, 2403. doi:10.3390/rs14102403. [6] Sutton, S.S., et al., 2025. 56th Lunar and Planetary Science Conference, Abstract #2463. [7] HiRISE Operations Center, 2024. PDS Release: September 2024 Images. University of Arizona HiRISE.
How to cite: Mancini, F., Pondrelli, M., Pacifici, A., Aboudan, A., Salese, F., and Ori, G. G.: Mitigating the HiRISE RED4 CCD data gap in stereo DTM production: an adaptive workflow for high-resolution Martian DTM generation, Europlanet Science Congress 2026, The Hague, The Netherlands, 7–11 Sep 2026, EPSC2026-1270, https://doi.org/10.5194/epsc2026-1270, 2026.
Introduction
The Colour and Stereo Surface Imaging System (CaSSIS [1]) onboard ESA’s Trace Gas Orbiter (TGO) is a multispectral camera that collects images of the surface at 4–5 m/pixel, in blue (BLU, ~480 nm), panchromatic (PAN, ~677 nm), red (RED, ~836 nm) and near-infrared (NIR, ~939 nm) filters across Visible/Near-Infrared wavelengths. CaSSIS has been operational since 2016, and in that time has collated an image database [2] with ~4.4% unique coverage of the surface in all four bands. Although not a spectrometer, CaSSIS has been shown to be capable of differentiating between ferrous and ferric materials and has become an invaluable mapping and context tool in Mars planetary science. CaSSIS and High Resolution Imaging Science Experiment (HiRISE [3]) operational targeting currently relies primarily on panchromatic Context Camera (CTX) or Thermal Emission Imaging System (THEMIS) basemaps, leaving the colour and compositional character of the surface unknown prior to acquisition.
The Compact Reconnaissance Imaging Spectrometer for Mars (CRISM [4]) onboard the Mars Reconnaissance Orbiter has provided near-global visible-to-near-infrared (VNIR) coverage through its mapping-mode Visible/Near-Infrared Reduced Data Records (VRDRs): mosaicked 5°×5° tiles spanning >99% of the surface at ~90 m/pixel across 92 spectral channels [5-7]. By resampling each VRDR pixel spectrum with the CaSSIS filter response functions, we have produced the CaSSIS Resampled Data Record (CaRDR): a simulated four-band CaSSIS-style view of the martian surface at ~90 m/pixel with near-global coverage (Figure 1), providing instrument planners with foreknowledge of surface colour prior to high-resolution image acquisition, and unlocking new global-regional compositional investigative opportunities [8].

Figure 1: a) The Global CaRDR Dataset in NIR-PAN-BLU, simulating CaSSIS colours at 90 m/pixel. b) cbtnpb_t1249 (NPB, stretched) in Nili Fossae, showing colorful rugged terrains with diverse mineralogy. c) cbtnpb_t0792 (NPB, stretched) in NW Noachis Terra, showing colourful plains south of Coprates Chasma. Footprints of HiRISE colour (red) and CaSSIS (yellow) are shown to highlight lack of high-resolution colour images in these areas.
Methods
Each of the 1764 VRDR 5°×5° Lambert Albedo tiles were resampled to produce a corresponding CaRDR tile. For each spatial pixel and each CaSSIS channel, the resampled CaRDR value is the normalised dot product of the per-pixel VRDR spectrum with the CaSSIS spectral response function interpolated to the CRISM VNIR spectral domain.
Results
Output CaRDR tiles are 32-bit floating-point four-band GeoTIFFs with ENVI-compatible headers, inheriting the coordinate reference system of the source VRDR tile. For each tile we also compute a Colour Band Ratio Composite (CBRC) spectral parameter cube containing the ratios RED/PAN (RPR), PAN/BLU (PBR), PAN/NIR (PNR), an atmospheric ice index (ICE-ATM), and a surface water ice index (ICE-H₂O), following [9]. A group of 8-bit unsigned integer browse products is provided for each tile: various three-band colour composites available from CaSSIS (NPB, NRB, NRP, RPB), a PAN browse, a synthetic true-colour product, and two CBRC products (CBRC1: RPR-PBR-PNR; CBRC2: RPR-PBR-ICE-ATM). The complete dataset has a total uncompressed volume of ~0.81 TB.
Comparing the t1250 CaRDR tile to a co-registered, Lambert Albedo-corrected CaSSIS image (MY37_024813_159_0) over the spectrally diverse Nili Fossae region demonstrates that four-band surface colour is well reproduced at the hectometre scale. CaRDR-pixel to downsampled CaSSIS-pixel comparison yields a mean signed percentage error of −0.7% across all bands, with per-band means of −8.9% (BLU), +8.1% (PAN), −0.6% (RED), and −1.7% (NIR). Error distributions are approximately Gaussian. Qualitative comparison with the standard VRDR RGB browse product (R: 600nm, G: 530nm, B: 440 nm) confirms that CaRDR NPB composites reveal improved local contrast in bedrock exposures and sun-facing slopes, deeper blue tints in ferrous-bearing units, and smoother apparent inter-strip residuals as a result of the effective ~23-channel averaging inherent in the resampling operation.
New target identification and improvements to instrument operational efficiencies
The CaRDR dataset reveals striking colour diversity across vast areas of the martian surface that have received no prior high-resolution colour coverage from CaSSIS or HiRISE. These include, but are not limited to: rugged, mineralogically diverse regions surrounding Nili Fossae (Figure 1b), colourful plains south of Coprates Chasma containing potential chloride deposits (Figure 1c) [10], and ejecta deposits north of Hellas Planitia exhibiting red-toned outcrops of potentially shock-metamorphosed plagioclase-bearing material [11]. The CaRDR dataset identifies these regions amongst others, as compelling new high-priority targets for CaSSIS, HiRISE, and next-generation orbital imagers.
Additionally, by providing instrument planners with foreknowledge of the approximate CaSSIS-band colour and spectral character of surfaces at the hectometre scale, CaRDRs enable colour-informed footprint placement prior to acquisition of high-resolution CaSSIS or HiRISE images. The dataset will help instrument operational efficiency by helping image planners adjust footprints onto the most spectrally interesting sub-regions of a target, reducing the need for repeat observations.
Conclusions
The CaRDR dataset covers >99% of the martian surface at ~90 m/pixel with a total volume of ~0.81 TB across 1,764 tiles. Lambert Albedo values are reproducible to within ~10% of true CaSSIS observations. The dataset [8] is publicly available at the Natural History Museum Data Portal, and the resampling pipeline is available at github.com/rbstabbins/vrdr_resampler. The CaRDR dataset provides a global spectral baseline against which all future high-resolution colour observations can be contextualised.
References
[1] Thomas et al., Space Sci. Rev., 212, 1897, 2017. [2] Thomas, ESA PSA, doi:10.5270/esa-da0ic0t, 2021. [3] McEwen et al., J. Geophys. Res., 112, E05S02, 2007. [4] Murchie et al., J. Geophys. Res., 112, E05S03, 2007. [5] Murchie et al., NASA PDS, doi:10.17189/QGXH-3R49, 2025. [6] Seelos et al., Icarus, 419, 115612, 2024. [7] Murchie et al., EPSC-DPS2025-136, 2025. [8] McNeil & Stabbins, NHM Data Portal, doi:10.5519/TBYP7PU2, 2026. [9] Tornabene et al., Space Sci. Rev., 214, 18, 2018. [10] Bickel et al., Sci. Data, 11, 845, 2024. [11] McNeil et al., EPSC-DPS2025-617, 2025.
How to cite: McNeil, J. and Stabbins, R.: CaSSIS Goes Global: a Multispectral Colour View of Mars From CRISM-CaSSIS Resampling, Europlanet Science Congress 2026, The Hague, The Netherlands, 7–11 Sep 2026, EPSC2026-443, https://doi.org/10.5194/epsc2026-443, 2026.
Radio occultation is a well-established technique for deriving vertical profiles of atmospheric temperature, pressure, and density, as well as electron density in the ionosphere, from the bending of radio signals as they propagate through a planetary atmosphere [1]. The ExoMars Trace Gas Orbiter (TGO) provides a largely unexplored dataset of radio occultation measurements using the TGO–Earth X-band link, which is particularly well suited for probing the neutral atmosphere. A previous study [2] assessed the availability of these occultation events, demonstrating a high number of potential observations due to TGO’s low-altitude, near-circular orbit.
Building on this work, an end-to-end processing pipeline for TGO–Earth radio occultation data has been developed and applied to first occultation events. The retrieval includes Doppler residuals, bending angle derivation, and Abel inversion to obtain refractivity profiles, from which vertical profiles of neutral atmospheric density and temperature, as well as ionospheric electron density, are derived.
The successful implementation of the processing pipeline and the first retrievals represent preliminary results derived from this dataset and indicate the feasibility of deriving both neutral and ionospheric profiles from TGO–Earth radio occultation measurements. Further assessment and validation of the retrieved profiles are ongoing.
References:
[1] Pätzold, M., Häusler, B., Tyler, G. L., et al. 2016, Planet. Space Sci., 127, 44, "Mars Express 10 years at Mars: Observations by the Mars Express Radio Science Experiment (MaRS)"
[2] Benthaus, M., Wilson, C., and Peter, K.: TGO-Earth radio occultation: a new data source for Mars neutral atmosphere profiling, EPSC-DPS Joint Meeting 2025, Helsinki, Finland, 7–12 Sep 2025, EPSC-DPS2025-1408, https://doi.org/10.5194/epsc-dps2025-1408, 2025.
How to cite: Benthaus, M., Wilson, C., Karatekin, O., and Krishnan, A.: TGO-Earth radio occultation: first atmospheric profiles, Europlanet Science Congress 2026, The Hague, The Netherlands, 7–11 Sep 2026, EPSC2026-209, https://doi.org/10.5194/epsc2026-209, 2026.
MMX InfraRed Spectrometer (MIRS) is the push-broom imaging spectrometer [1] aboard the Martian Moons eXploration (MMX) mission [2] by JAXA, operating between 0.9 and 3.6 µm with a spectral resolution of around 22 nm below 3.2 µm. The mission will be launched in autumn 2026 to the Martian system, with an arrival planned for 2027. The main objective of the mission is to study the two Martian moons, Phobos and Deimos, and to collect samples from Phobos to bring back to Earth in 2031. Another major aim of the mission [3] and the MIRS instrument [1] is to answer key science questions on the transport processes of dust and water in the Martian atmosphere [3], such as: how do local and regional dust storms form, grow and evolve? What is the diurnal behaviour of water ice clouds (formation, transport, dynamics)?
The MMX probe will be injected into a quasi-circular equatorial orbit around Mars at an altitude of about 6000 km. From this particular orbit, four different observation modes of MIRS are expected for Mars observations: nominal mode maximising the longitudinal overlap, global mapping mode covering all the illuminated Martian disk up to medium-high latitudes (+/- 60°), region of interest mode providing temporal resolution (down to 15 minutes) above a limited area, and the limb mode. Each mode will be useful to study the spatial and temporal variations of aerosols (atmospheric dust, water and CO2 ices), and their fine diurnal variations. Indeed, the particular orbit of MMX (the second probe after the Emirates Mars Mission to be in equatorial orbit near Mars) will give us access to observations at very different local times with high spatial resolution, which will certainly provide some answers to the question addressed above.
The objective is to develop a pipeline that will invert flight data to extract aerosol properties (e.g., optical depths, particle sizes) as fast as the data is downloaded. To do so, different existing retrieval methods will be implemented, such as the dust optical depth retrievals at 2 µm [4] and 2.77 µm [5]. These recently developed methods are based on CO2 absorption band variations due to atmospheric dust, allowing to retrieve automatically dust optical depth on near-IR nadir observations. We are also developing a more usual method based on the spectral continuum variations induced by the aerosols, for which we are building a look-up table based on simulated spectra. We will present an update on these aerosol inversion methods and also on the Mars observation strategy.
Acknowledgments:
We thank the MMX JAXA teams for their efforts and CNES for the financial support and collaboration to build the MIRS instrument.
References:
[1] Barucci M. A. et al. (2021) Earth, Plan. and Space, 73, 211. [2] Kuramoto K. et al. (2022) Earth, Plan. and Space, 74, 12. [3] Ogohara K. et al. (2021) Earth, Plan. and Space, 74, 1. [4] Leseigneur Y. and Vincendon M. (2023) Icarus, 392, 115366. [5] Kazama A. et al. (2025) JGR: Planets, 130, E2025JE008987.
How to cite: Leseigneur, Y., Gautier, T., Le Bail, G., Lasue, J., Bertrand, T., Sawyer, E., Théret, N., Kazama, A., Aoki, S., Spiga, A., Stcherbinine, A., Doressoundiram, A., Nakagawa, H., and Barucci, A.: Chasing the Martian Aerosols with the Upcoming MIRS/MMX instrument, Europlanet Science Congress 2026, The Hague, The Netherlands, 7–11 Sep 2026, EPSC2026-1028, https://doi.org/10.5194/epsc2026-1028, 2026.
The ESA ExoMars mission will land at Oxia Planum to search for signs of life on Mars [1, 2]. In this study, we analyze aeolian linear features in the landing ellipse using CTX (6 m/pixel), CaSSIS (5 m/pixel), and HiRISE (25 cm/pixel) imagery.
We identified bright wind streaks oriented towards the SSW (mean azimuth 189°), consistent with formative winds blowing from the N-NNE. Their orientation reveals slight variations, allowing us to distinguish distinct sub-populations that appear controlled by the local topography.
In contrast, dark-toned stripes form a 'streaky' pattern with a main NE-SW trend. In the western sector, they consist of elongated dark patches covering the bright, clay-enriched unit (the mission’s main target [2]). Crucially, the presence of small scarps suggests a degree of material consolidation or cementation. These stripes are preferentially preserved in the lee of impact craters (~600 m diameter), suggesting formative winds from the NE, thus differing substantially from the orientation of the nearby bright streaks.
In the SW sector, SSE-oriented dark stripes are associated with a ~2 km diameter impact crater. Both CaSSIS and HiRISE data confirm that these features consist of a dark ejecta blanket preferentially preserved along the crater's southern rim, directly overlying the bright clay-enriched bedrock. Their orientation is slightly divergent but comparable to the bright wind streaks in this area, suggesting control by the current regional wind regime.
We propose that these findings indicate a new class of Martian aeolian feature. Unlike typically described wind streaks, the features presented here appear composed of consolidated material. Specifically, the dark ejecta stripes can be interpreted as 'aeolian preservation streaks'. This feature arises from the differential erosion of a consolidated unit (e.g., crater ejecta blanket) by winds from the N-NNW; the crater rim creates a wind shadow that preserves the ejecta downwind while the surrounding area is removed, exposing the underlying Noachian bedrock.
The orientation of these preservation streaks suggests that a N-NNW wind regime has been dominant in shaping the landscape over geological timescales. Even the dark stripes in the western sector, particularly where clustered behind topographic obstacles, may share this origin. Although their degree of consolidation remains to be definitively determined, their divergence from bright streaks suggests either a different formation timeline or strong local topographic control. These hypotheses regarding consolidated aeolian features and paleo-wind regimes will require crucial in-situ validation by the ESA Rosalind Franklin rover.
[1] Vago J. et al. (2017). Astrobiology, 17. [2] Quantin et al. (2021), Astrobiology, 21.
How to cite: Silvestro, S., Vaz, D. A., Grasso, F. M., Tirsch, D., Favaro, E. A., Salese, F., Popa, C. I., Franzese, G., Mongelluzzo, G., Porto, C., Pajola, M., and Esposito, F.: Consolidated Aeolian Streaks in Oxia Planum: Evidence for Differential Erosion and Topographic Shielding, Europlanet Science Congress 2026, The Hague, The Netherlands, 7–11 Sep 2026, EPSC2026-1223, https://doi.org/10.5194/epsc2026-1223, 2026.
The flux rate and size distribution of particles, dust or sand, lifted from the Martian surface is of great interest to understand surface modification, the dust cycle and for spacecraft safety [see e.g. 1-6 and references within]. Although several estimations of the fluid threshold required to lift particles of a certain size on Mars have been made [e.g. 3,4], there is still extremely limited data available. Furthermore, large particle movements have often been associated with the passage of dust devils, invoking a possible suction effect [2,3,4,6,7]. These processes are important to improve our understanding of the surface-atmosphere coupling and wider feedbacks with the atmospheric dynamics of Mars, including the development of dust storms [1].
The Mars Environment Dynamics Analyser (MEDA) wind sensor provides an example of how lofted particles pose a threat to surface hardware. Over the mission, the wind sensor has suffered damage to the wires connecting the sensor dice from particle impacts [6]. For such damage to occur, the impacting particles must have been a certain size and kinetic energy. As a result, these damage causing events can be used advantageously to infer the rate at which large particles are lifted from the surface and learn about the environmental conditions required to do so.
Here, we present a series of probabilistic models for MEDA hardware failure events. The first model applies a reliability engineering approach to produce a first order understanding of failure rates. This enables predictive use. Following this, we propose a second model based on the distribution of changes in optical depth recorded by the rover, which acts as a proxy for variations in atmospheric dust content and allows analysis of seasonality.
These models enable the exploration of large particle fluxes, fluid thresholds and planetary boundary layer behaviours. In turn, this may help inform future missions or improve the parameterisations used in Mars weather models.
References
[1] Newman, Claire E., et al. "Toward more realistic simulation and prediction of dust storms on Mars." (2020).
[2] Newman, Claire E., et al. "The dynamic atmospheric and aeolian environment of Jezero crater, Mars." Science Advances 8.21 (2022): eabn3783.
[3] Baker, M., et al. "Vortex‐dominated aeolian activity at InSight's landing site, Part 2: Local meteorology, transport dynamics, and model analysis." Journal of Geophysical Research: Planets 126.4 (2021): e2020JE006514.
[4] Charalambous, Constantinos, et al. "Vortex‐dominated aeolian activity at InSight's landing site, Part 1: Multi‐instrument observations, analysis, and implications." Journal of Geophysical Research: Planets 126.6 (2021): e2020JE006757.
[5] Lorenz, Ralph D., et al. "Lander and rover histories of dust accumulation on and removal from solar arrays on Mars." Planetary and space science 207 (2021): 105337.
[6] Hueso, Ricardo, et al. "Convective vortices and dust devils detected and characterized by Mars 2020." Journal of Geophysical Research: Planets 128.2 (2023): e2022JE007516.
[7] Murdoch, Naomi, et al. "The sound of a Martian dust devil." Nature Communications 13.1 (2022): 7505.
How to cite: Stott, A., Marin, M., Navarro, S., Hueso, R., Martinez, G., Peinado, V., Lemmon, M., Newman, C., Munguira, A., Lorenz, R., McDonald, G., Sanchez-Lavega, A., and Manfredi Rodriguez, J. A.: Life on the edge of a Martian storm track: extracting information on aeolian processes at Jezero from MEDA hardware failures on Mars 2020, Europlanet Science Congress 2026, The Hague, The Netherlands, 7–11 Sep 2026, EPSC2026-588, https://doi.org/10.5194/epsc2026-588, 2026.
Near-surface water vapour exchange is a small but important part of the Martian water cycle. As temperatures drop at night, water vapour is adsorbed into the regolith, and as the surface warms in the morning, water is released back into the atmosphere. Evidence for this process has been seen since Viking and it has been studied for decades (e.g., Fanale and Cannon, 1971, 1974; Zent et al., 1993; Jakosky et al., 1997; Rivera-Valentín et al., 2020), but we still do not fully know what controls the strength of this exchange, especially at the local scale. Recent studies have shown that present-day conditions at Jezero crater can permit salt hydration and occasional frost formation. Modeling efforts show that estimated diurnal atmosphere–surface water exchange can range from 0.5 to 10 g/m². At night, when temperatures drop below 190 K, surface water activity can exceed 0.5, the lower limit often discussed for cell reproduction, while during the day, when temperatures are above 245 K, water activity remains below 0.02 (Zorzano et al., 2024). One-dimensional models, such as the Single Column Model (SCM), have been used to study this exchange and compare it with lander and rover observations (e.g., Savijärvi et al., 2016, 2019, 2021, 2024a, 2024b; Polkko et al., 2025). However, a comprehensive sensitivity analysis of the SCM to identify the dominant factors governing regolith–atmosphere water vapour exchange remains unexplored.
Here, we use the SCM to carry out a sensitivity study of near-surface water vapour exchange at Jezero crater. Jezero is a useful case study because Perseverance is measuring the near-surface environment directly using the Mars Environmental Dynamics Analyzer (MEDA), which includes pressure, air temperature, relative humidity, thermal infrared radiation, radiation and dust, and wind measurements (Rodriguez-Manfredi et al., 2021). We vary key atmospheric, surface, and regolith parameters, including thermal inertia, porosity, initial soil temperature, surface pressure, and initial water content, and examine how these affect temperature, relative humidity, vapour mixing ratio, and regolith water content. We also compare the model results with MEDA observations as Perseverance drives over diverse terrains within the crater.
Our results show that some parameters affect water exchange mainly by changing the diurnal temperature cycle. However, matching the observed temperature cycle is not enough to fully constrain the exchange. Parameters such as thermal inertia, albedo, pressure, and dust mainly influence water exchange by changing the thermal and atmospheric environment, while regolith properties, such as porosity and initial water content, more directly control how much water can be stored and released, often without strongly affecting temperature. Overall, this work identifies the key controls on the daily water cycle at Jezero and shows what additional constraints are needed to better understand regolith–atmosphere exchange on Mars.
References
Jakosky, B.M., & Phillips, R.J. (2001). Mars' volatile and climate history. Nature, 412(6843), 237–244.
Fanale, F.P., & Cannon, W.A. (1971). Exchange of adsorbed water between the regolith and atmosphere of Mars. Nature, 230(5293), 502–504.
Fanale, F.P., & Cannon, W.A. (1974). Mars: Adsorption of water vapour by powdery mineral surfaces. Journal of Geophysical Research, 79(23), 3397–3402.
Martínez, G.M., & Renno, N.O. (2013). Water and brines on Mars: Current evidence and implications for MSL. Space Science Reviews, 175, 29–51.
Polkko, et al. (2025), Annual Evolution of Water Vapor at Jezero Crater Based on Observations and Modeling Journal of Geophysical Research: Planets, 130, e2025JE009124
Rodríguez-Manfredi, J.A., et al. (2021). The Mars Environmental Dynamics Analyzer, MEDA: A suite of environmental sensors for the Mars 2020 mission. Space Science Reviews, 217(3), 48.
Rivera-Valentín, E.G., et al. (2020). The role of the regolith in the adsorption and desorption of water on Mars. Nature Astronomy, 4(8), 756–761.
Savijärvi, H., et al. (2016). The diurnal water cycle at Curiosity: Role of exchange with the regolith. Icarus, 265, 63-69
Savijärvi, H., et al. (2019). Water vapor mixing ratios and air temperatures for three martian years from Curiosity. Icarus, 326, 170-175
Savijärvi, H., et al. (2021). Water vapor adsorption on Mars. Icarus 357, 114270
Savijärvi, H., et al. (2024a). Moisture cycles in Jezero Crater, Mars. Icarus, 423, 116283.
Savijärvi, H., et al. (2024b). Wintertime column modeling in Jezero crater, Mars: Period of near-fog and a dust event. Icarus 421, 116-242
Zent, A.P., et al. (1993). A coupled subsurface-boundary layer model of water on Mars. Journal of Geophysical Research: Planets, 98(E2), 3319–3337.
Zorzano, M.-P., et al. (2024). Near-surface water vapour exchange at Jezero Crater: Implications for regolith hydration under current Martian conditions. Geophysical Research Letters, 51(3), e2023GL104567
How to cite: Patel, P., Tamppari, L., de la Torre Juarez, M., Martinez, G., McConnochie, T., Polkko, J., and Savijarvi, H.: Regolith-Atmosphere Water Exchange at Jezero Crater, Europlanet Science Congress 2026, The Hague, The Netherlands, 7–11 Sep 2026, EPSC2026-719, https://doi.org/10.5194/epsc2026-719, 2026.
The Mars 2020 Perseverance rover landed at Jezero crater, Mars, on February 18, 2021. Since then, it has driven about 44 km through different terrains, including the Jezero crater’s floor and delta. The rover has also climbed about 750 m to escape from the crater. The MEDA meteorological instrument on Perseverance [1-2] allows investigating the planetary boundary layer (PBL) at different sites. This work focuses on the daytime PBL, or convective boundary layer (CBL). Characterizing the daytime convective turbulence is relevant, for example, to constrain dust lifting processes, improve models, and operate aerial vehicles. Since local environmental conditions greatly influence the development of the CBL [e.g. 3], we investigate potential variations in the CBL during three Martian Years of meteorological records at different sites.
The CBL depth is a relevant proxy of the intensity of the convective turbulence, as previous works have shown [4-5]. Thermal profiles retrieved from orbit have constrained the CBL depth at different locations on Mars [6-7]. From Mars’ surface, using the periodicity of the daytime pressure oscillations, related to convective cells, have been suggested to estimate the CBL depth [5, 8]. Similarly, we assess the CBL depth at Jezero through spectral and time-frequency analyses of daytime pressure data. We compare our results with atmospheric simulations and orbital observations, and comment on potential changes in seasonal and interannual timescales.
Other relevant magnitudes to investigate the intensity of the convective turbulence include temperature fluctuations and thermal gradients [9-10], wind speed and its fluctuations [11-12], and convective vortices [13]. We investigate the convective turbulence during three Martian Years of MEDA observations, with special attention to variations in CBL processes related to changes in Perseverance’s elevation. We include recently derived wind data up to mission sol 1738. These data are essential for estimating CBL depths and characterizing convective turbulence at different local times. Overall, MEDA allows us to characterize multiple CBL processes at Jezero, as well as to assess the best local time to fly aerial vehicles.
References
[1] Rodriguez-Manfredi, J. A., et al. (2021). The Mars Environmental Dynamics Analyzer, MEDA. A suite of environmental sensors for the Mars 2020 mission. Space science reviews, 217(3), 1-86. DOI: 10.1007/s11214-021-00816-9.
[2] Rodriguez-Manfredi, J. A., et al. (2023). The diverse meteorology of Jezero crater over the first 250 sols of Perseverance on Mars. Nature Geoscience, 16. DOI: 10.1038/s41561-022-01084-0.
[3] Munguira et al. (2026). Surface Layer Turbulence Scaling Parameters at Jezero Crater, Mars. Submitted to Icarus and as a contribution to this conference.
[4] Spiga, A, et al. (2010). Structure and dynamics of the convective boundary layer on Mars as inferred from large-eddy simulations and remotesensing measurements. Quarterly Journal Royal Meteorological Society, 136(647). DOI: 10.1002/qj.563.
[5] Spiga, A, et al. (2021). A study of daytime convective vortices and turbulence in the martian planetary boundary layer based on half-a-year of InSight atmospheric measurements and large-eddy simulations. Journal of Geophysical Research: Planets, 126(1). DOI: 10.1029/2020JE006511.
[6] Hinson, D. P., et al. (2008). The depth of the convective boundary layer on Mars. Icarus, 198(1). DOI: 10.1016/j.icarus.2008.07.003.
[7] Hinson, D. P., et al. (2019). The martian daytime convective boundary layer: Results from radio occultation measurements and a mesoscale model. Icarus, 326. DOI: 10.1016/j.icarus.2019.02.028.
[8] Stott, A. E. et al. (2025). WindSightNet: The inter-annual variability of martian winds retrieved from InSight's seismic data with machine learning. Journal of Geophysical Research: Planets, 130, e2024JE008695. DOI: 10.1029/2024JE008695
[9] Munguira, A, et al. (2023). Near surface atmospheric temperatures at Jezero from Mars 2020 MEDA measurements. Journal of Geophysical Research: Planets, 128(3). DOI: 10.1029/2022JE007559.
[10] Munguira, A, et al. (2024). One Martian Year of near-surface temperatures at Jezero from MEDA measurements on Mars2020/perseverance. Journal of Geophysical Research: Planets, 129(7). DOI: 10.1029/2024JE008385.
[11] Newman, C. E. et al. (2022). The dynamic atmospheric and aeolian environment of Jezero crater, Mars. Science Advances, 8(21). DOI: 10.1126/sciadv.abn3783.
[12] Stott, A. E., et al. (2023). Wind and turbulence observations with the Mars microphone on perseverance. Journal of Geophysical Research: Planets, 128, e2022JE007547. DOI: 10.1029/2022JE007547
[13] Hueso, R, et al. (2023). Convective vortices and dust devils detected and characterized by Mars 2020. Journal of Geophysical Research: Planets, 128(2). DOI: 10.1029/2022JE007516.
Acknowledgements
We acknowledge the operations and hardware teams from the Mars 2020 project. This project is carried out as part of the NASA Mars exploration program in the US. A.M. is a postdoctoral researcher funded by Programa Posdoctoral de Perfeccionamiento de Personal Doctor del Gobierno Vasco. C.P. acknowledges the support of the French Agence Nationale de la Recherche (ANR). A.M., R.H., A.S.L. and A.S. are supported by grant PID2023-149055NB-C31 funded by MICIU/AEI/10.13039/501100011033/ and FEDER, UE. GM acknowledges funding from grant PID2024-161247OB-C31 funded by MICIU/AEI/ 10.13039/501100011033 and by ERDF/EU.
How to cite: Munguira, A., Palerm, C., Chide, B., Hueso, R., Sánchez-Lavega, A., Stott, A. E., Navarro, S., Lorenzo-Corvo, C., Toledo, D., Newman, C., Pla-García, J., Martínez, G. M., Rodríguez-Manfredi, J. A., Forni, O., Maurice, S., and Bertrand, T.: Convective Boundary Layer at Jezero Crater, Mars, during Three Martian Years, Europlanet Science Congress 2026, The Hague, The Netherlands, 7–11 Sep 2026, EPSC2026-243, https://doi.org/10.5194/epsc2026-243, 2026.
Understanding the near-surface meteorology of Mars is essential for interpreting atmospheric processes, supporting robotic operations, and preparing future human exploration. The Mars 2020 Perseverance rover has provided an unprecedented meteorological record at Jezero crater through the Mars Environmental Dynamics Analyzer (MEDA) [1]. Prior to landing, mesoscale and global modeling studies provided predictions of the atmospheric behavior expected at the landing site, establishing a baseline for post-landing validation [2, 3]. This study represents a major step forward from that initial validation effort, moving beyond model–data comparison toward a physically consistent interpretation of the meteorological system at Jezero crater.
We present an updated and expanded comparison between MEDA observations and high-resolution Mars Regional Atmospheric Modeling System (MRAMS) simulations, incorporating full diurnal-cycle simulations every 30° of solar longitude (Ls) across two complete Martian years. This represents one of the highest temporal-frequency mesoscale modeling datasets ever produced at high resolution on Mars, with the innermost grid reaching approximately 330 m horizontal spacing. In addition to crater-scale analysis, we adopt a multiscale framework that explicitly connects the regional circulation of the Isidis basin with local processes inside Jezero crater. This approach allows us to investigate how large-scale forcing, crater topography, slope flows, and surface-atmosphere interactions jointly control the observed meteorological cycles at the rover location.
We compare MRAMS results with MEDA observations of pressure, air temperature, ground temperature, and horizontal winds. Among these variables, pressure emerges as a particularly robust validation metric. The model reproduces the shape, amplitude, and seasonal evolution of the diurnal pressure cycle with good fidelity after applying normalization techniques to account for large-scale biases. This strong agreement demonstrates that MRAMS captures the essential dynamical response of the atmosphere at both regional and crater scales, providing a solid foundation for interpreting more complex variables.
Air and ground temperature comparisons show that MRAMS successfully reproduces the general structure of the diurnal thermal cycle, including daytime heating and nighttime cooling, but discrepancies remain in amplitude and timing. These differences highlight the importance of local surface properties, including thermal inertia, albedo, and small-scale heterogeneity, which are not fully resolved in the orbital datasets used to initialize the model. Jezero crater exhibits significant geological diversity along the rover traverse, and the inability to resolve these variations likely contributes to the observed mismatches. Therefore, temperature acts as a key diagnostic of surface-atmosphere coupling and emphasizes the need for improved characterization of surface properties in mesoscale simulations.
The comparison of winds between MRAMS and MEDA reveals that the model captures many of the dominant atmospheric regimes observed at Jezero, including the strong diurnal organization of flows associated with slope winds, crater circulations, and regional forcing. In this study, the wind analysis is restricted to horizontal wind measurements from sols 15 to 313 (Ls ∼ 152°), as several wind sensor boards were damaged by wind-driven grain impacts around sols 313–315. Within this period, both model and observations show very low wind speeds immediately after sunset, following the collapse of daytime convective turbulence, followed by a nocturnal increase associated with the development of downslope and drainage flows driven by crater topography.
Despite this overall agreement, systematic discrepancies remain and constitute one of the most important scientific outcomes of this study. MRAMS tends to overestimate nocturnal wind speeds, particularly between approximately 01:00 local time and dawn. This behavior suggests that modeled downslope flows originating from the crater rim and surrounding terrain may penetrate too efficiently into the crater interior, or that the model overestimates momentum mixing under stable boundary-layer conditions. Differences in wind direction and in the timing of regime transitions further point to limitations in the representation of local slopes, surface roughness, unresolved obstacles, or the interaction between crater-scale and regional circulations. Importantly, these discrepancies are not treated as simple model errors but as key diagnostics of the underlying physics, providing insight into where improvements are needed in boundary-layer parameterizations, surface properties, and model resolution.
Taken together, pressure, temperature, and wind comparisons reveal a complementary picture in which each variable constrains different aspects of the system: pressure validates the large-scale and dynamical framework, temperature diagnoses surface-atmosphere thermal coupling and heterogeneity, and winds provide the most demanding test of the model’s ability to reproduce local and regional circulations. This multi-variable, multi-scale approach demonstrates that high-resolution mesoscale modeling can be used not only as a predictive tool but as a diagnostic framework for understanding Martian boundary-layer processes in complex terrain.
Overall, this study shows that the meteorology of Jezero crater is controlled by a complex interplay between regional circulation (particularly the influence of the Isidis basin), crater-scale topography, surface thermal contrasts, and boundary-layer evolution. The combination of MEDA observations and MRAMS simulations enables a physically consistent interpretation of these processes. While the agreement between model and observations supports the use of MRAMS to extend point measurements into a broader spatial context, the remaining discrepancies highlight key areas for future improvement. These results contribute to a deeper understanding of Martian near-surface meteorology and provide valuable insights for future mission planning, landing site characterization, and atmospheric modeling efforts on Mars.
References:
[1] Rodriguez-Manfredi, J. A., De la Torre Juárez, M., Alonso, A., Apéstigue, V., Arruego, I., Atienza, T., ... & MEDA team. (2021). The Mars Environmental Dynamics Analyzer, MEDA. A suite of environmental sensors for the Mars 2020 mission. Space science reviews, 217, 1-86.
[2] Pla-García, J., Rafkin, S. C., Martinez, G. M., Vicente-Retortillo, Á., Newman, C. E., Savijärvi, H., ... & Harri, A. M. (2020). Meteorological predictions for Mars 2020 Perseverance Rover landing site at Jezero crater. Space science reviews, 216(8), 148.
[3] Newman, C. E., de la Torre Juárez, M., Pla-García, J., Wilson, R. J., Lewis, S. R., Neary, L., ... & Rodriguez-Manfredi, J. A. (2021). Multi-model meteorological and aeolian predictions for Mars 2020 and the Jezero crater region. Space Science Reviews, 217, 1-68.
How to cite: Pla-Garcia, J., Newman, C., Martínez, G., and Rodríguez-Manfredi, J. A.: The meteo of Jezero crater as determined from MEDA observations and modeling: from validation to physical interpretation, Europlanet Science Congress 2026, The Hague, The Netherlands, 7–11 Sep 2026, EPSC2026-381, https://doi.org/10.5194/epsc2026-381, 2026.
Introduction
The surface albedo and thermal inertia are key parameters to understand the climate and geology of Mars. Albedo controls the amount of solar energy that is absorbed by the surface, playing an important role in the Surface Energy Budget (SEB), which on Mars is controlled by the radiative terms [1]. The SEB and the surface thermal inertia determine the temporal evolution of the ground temperature, which in turn drives the near-surface atmospheric processes. In addition, surface albedo and thermal inertia allow the geological characterization of the terrain, as they depend on rock abundance, particle size or porosity.
The MEDA instrument [2] onboard the Perseverance rover of the Mars 2020 mission includes the Radiation and Dust Sensor (RDS) [3] and the Thermal InfraRed Sensor (TIRS) [4], among other sensors, which allow the direct determination of these parameters.
Methodology and Calibration Improvements
Surface albedo is obtained from downward and upward shortwave fluxes, which are obtained respectively from the RDS TOP-7 and TIRS-IR3 channels. The retrieval of the thermal inertia uses also the surface brightness temperature measured by the TIRS-IR5 and the surface energy budget, in which the downward and upward longwave fluxes are obtained respectively from the TIRS-IR1 and TIRS-IR4 channels.
This work expands and improves the results presented in [1] covering the first 350 sols of the mission. In order to accurately perform longer-term analyses, such as this one, it becomes necessary to correct RDS and TIRS measurements for the effect of dust accumulation. This is done by means of a Dust Correction Factor (DCF). In this work we use recent correction factors for dust deposition on the RDS [5] and TIRS [6] channels, which improve the accuracy of the radiative terms, which in turn allow for a refinement in the calculation of the surface albedo and thermal inertia.
Figure 1 shows the DCF on the RDS TOP-7 channel. The temporal evolution shows two periods of strong net dust accumulation, between sols 400-600 and 1000-1200, covering slightly more than the first half of the perihelion season. During the remaining periods, dust accumulation experiences little variability. Finally, net dust removal occurs at the end of the analyzed period.

Figure 1. Dust Correction Factor for the RDS TOP-7 channel.
Figure 2 shows the DCF on the TIRS channels. Dust accumulation is small for the last three channels because they are looking downwards. The behavior of IR1 and IR2 is similar to that of the RDS TOP-7, but with a smaller effect of dust accumulation, particularly on the IR1 channel.

Figure 2. Dust Correction Factor for the TIRS channels.
Results
Figure 3 shows the surface albedo during the first 1,600 sols of the mission. Surface albedo strongly depends on illumination and viewing geometry, leading to a significant diurnal variation [1]. For this reason, we show the values at noon, which represent the diurnal minimum. The temporal evolution appears to show a seasonal cycle, with minimum values at around Ls = 180º and maximum values at around Ls = 270º. The values range from 0.10 to 0.23, and the surface albedo in MY 37 appears to be systematically larger than in MY 36.

Figure 3. Surface albedo at Noon for the first 1,600 sols. Vertical lines indicate Ls = 180º and Ls = 270º for MY 36 and 37.
Figure 4 shows the surface thermal inertia during the first 1,600 sols of the mission. Contrary to the albedo, the temporal evolution is now controlled by the portion of the terrain observed by TIRS, and a seasonal cycle is not clearly identified. The strong fluctuations can be attributed to the relatively small field of view of TIRS, which observes an area of approximately 3-4 m2, and therefore it is very sensitive to surface heterogeneities. Values range from below 200 to above 600 SI units, indicating a variety of terrain features.

Figure 4. Surface thermal inertia for the first 1,600 sols.
Discussion
These results can be compared to those obtained from satellite observations. In the case of thermal inertia, THEMIS retrievals [7] around the rover traverse are tipically between 200 and 400 SI units. The smaller range of values can be attributed to the different spatial resolutions of both instruments.
Mean values from OMEGA albedo observations [8] for the region where Perseverance is located are around 0.16, in very good agreement with MEDA retrievals. OMEGA observations (Figure 5) also show higher albedo values as the rover moved towards the West, in agreement with MEDA retrievals. Furthermore, the seasonal cycle observed from MEDA is consistent with that observed at Syrtis Major from MARCI observations for MY 28 to 33, with annual minima around Ls = 180º and maxima around Ls = 270º [9]. The increase in brightness is approximately coincident with the strong decreases of the RDS DCF, suggesting that it can be partially attributed to dust deposition.

Figure 5. OMEGA albedo values, with the rover traverse shown in black.
The presented results are important to validate numerical models and provide ground-truth for satellite observations of albedo and thermal inertia. In addition, these results include the area named Three Forks, where ten sample tubes have been deposited. Finally, they allow exploring the role of dust storms and dust lifting and deposition on these parameters throughout the mission.
Acknowledgements
This research is funded by the Spanish Ministry of Science, Innovation and Universities (MICIU)/State Agency of Research (AEI) project PID2024-161247OB-C31, funded by MICIU/AEI /10.13039/501100011033 / FEDER, UE
References
[1] Martínez, G. M. et al. (2023). Journal of Geophysical Research: Planets, 128, e2022JE007537. [2] Rodríguez-Manfredi, J. A. et al. (2021). Space Science Reviews, 217(3), 1–86. [3] Apéstigue, V. et al. (2022). Sensors, 22(8), 2907. [4] Sebastián, E. et al. (2020). Measurement, 164, 107968. [5] Vicente-Retortillo, A. et al. (2024). Geophysical Research Letters, 51, e2023GL107975. [6] Sebastián, E. et al. (2025). [7] Fergason R. L. et al. (2006), JGR 111, E12004. [8] Vincendon M. et al. (2015), Icarus 251, 145-163. [9] Wellington, D. F., and Bell III, J. F. (2020). Icarus, 349, 113766.
How to cite: Vicente-Retortillo, A., Martínez, G., Sebastián, E., Lemmon, M., Rodríguez-Veloso, R., Toledo, D., Apéstigue, V., Arruego, I., and Rodríguez-Manfredi, J. A.: Albedo and Thermal Inertia at Jezero Crater from MEDA over the First 1600 Sols: Extended Analysis and Calibration Improvements, Europlanet Science Congress 2026, The Hague, The Netherlands, 7–11 Sep 2026, EPSC2026-1140, https://doi.org/10.5194/epsc2026-1140, 2026.
Introduction and Methods
We characterized the seasonal variations of water ice clouds and dust in the Tharsis region during the dusty season using observations from the Planetary Fourier Spectrometer (PFS) aboard the Mars Express (MEx) mission, the Mars Climate Sounder (MCS) and images from Mars Color Imager (MARCI) aboard the Mars Reconnaissance Orbiter (MRO) spacecraft. We selected four Martian years (MYs): 28, 31, 34 and 35 for our investigation of years with and without global dust storms (GDSs). We analyzed thermal fields with total dust and water ice optical depths obtained from the PFS and MCS instruments, and we compared them with MARCI images during the dusty season. We defined quasi-simultaneous measurements with images as observations taken within a Ls difference of 5° and an LT of 3 hours for the Tharsis region. We investigated the altitudes of hygropause based on MARCI images and the thermal fields retrieved from PFS observations. We defined the hygropause as the layer in which the difference between condensation and atmospheric temperatures is approximately 0 ± 0.5 K.
Results
We identified three Ls intervals of cloud occurrence during all studied MYs: the first (180° – 210°), the second (240° – 270°) and the third (330° – 360°). The northeastern and east clouds of Olympus are observed in all Ls intervals. Clouds are found around Pavonis, as well as filament of clouds connected to Arsia during three seasons. During the first period, clouds appear on the eastern side of Ascraeus. Clouds as a southern filament, as well as clouds over the caldera of Ascraeus characterize the second period. In the third period, clouds are mostly visible over the caldera and the northeast side of Ascraeus. Clouds were observed over the southwestern region of Arsia, with some occurring as a northeastern filament to Pavonis during three periods.
Unlike clouds, dust occurs everywhere. Dust is suspended in the atmosphere close to the surface, especially in valleys around volcanoes. Decreases in dust content are observed above volcanoes in PFS observations and in MARCI images. MARCI images clearly show the features of volcanoes’ calderas. In MY 28, the GDS in the Tharsis region began around 20° of Ls later than the global onset, except for Arsia. For Arsia, the GDS began around 5° later than the global onset. This is probably associated with the fact that the GDS began as a series of dust storms mainly over Noachis Terra [1,2,3]. This delay was not observed at the onset of the GDS in MY 34. This is likely because the GDS began in the northern regions, such as Chryse Planitia [4].
During the decline of GDSs, we observed decreases in atmospheric dust content between PFS observations and MARCI images. PFS observations were usually taken at LT = 9 or at LT = 21, whereas MARCI images were always taken between LTs = 13 – 16. We observed a significant difference in atmospheric dust amounts between the afternoon and evening LTs.
Many MCS and PFS coincidence measurements show consistent results in thermal fields as well as in aerosol optical depths. In some cases, the lack of agreement between the two instruments was due to the differences in the days or locations of the measurements.
Conclusions
The clouds over the four Tharsis volcanoes evolve with the seasons and change location according to the wind direction. Trade winds could be responsible for the origin of clouds near volcanoes [5]. Indeed, the locations of these clouds - northeast for Olympus and Ascraeus and southwest for Arsia - align with the directions of the trade winds. During the third period, most of the clouds over Ascraeus and Pavonis likely originated from local mountain circulation. The clouds over Pavonis during the first period may also be due to local mountain circulation because of weak global winds. The upward winds along the slopes could explain the origin of these clouds. However, [6] suggested that the water vapor pumping mechanism by upslope winds during the dusty season is unlikely due to the high altitude of the hygropause and the low amount of water vapor in the lower atmosphere.
On the other hand, we demonstrated that minimal hygropause altitudes could be as low as 18 km and maximal ones as high as 50 km. Therefore, we cannot rule out the possibility of the mechanism proposed by [7] and [8], at least for Pavonis Mons during the first period. A second explanation for the origin of the clouds, especially for Pavonis Mons, could be the “fountain” model proposed by [9]. In this case, the sun heats the volcano slopes sufficiently to drive this mechanism. As a result, hot air rises by strong upward motions, reaching altitudes of around 30-40 km. This causes a cold pocket due to the adiabatic cooling of the uplifted air. Thus, water vapor transported from the surface by these motions could condense in regions of the cold pocket. The altitudes of the cold pockets are similar to the altitudes of the hygropause during the dusty season in the Tharsis region. [6] proposed another explanation in which gravity waves played a primary role by perturbing hygropause. They stated that gravity waves caused orographic cloud formations like AMEC during the perihelion season in the early morning.
Acknowledgments
This work was funded by an internal project ‘mini-grant’ received by PW from INAF. The PFS experiment was built at the Institute for Space Astrophysics and Planetology (IAPS) of the National Institute for Astrophysics (INAF) and is currently funded by the Italian Space Agency (ASI; agreement number 2026-6-HH.0).
References
[1] Smith et al., 2009, Icarus, 202, Issue 2, 444-452. [2] Montabone et al., 2015, Icarus, 251, pp. 65-95. [3] Fedorova et al., 2024, Icarus, 415, 116030. [4] Sanchez-Lavega et al., 2019, Geophysical Research Letters, 46, 6101–6108. [5] Fernando et al., 2024, Icarus, 417, 2024, 116117. [6] Hernández-Bernal et al., 2022, Journal of Geophysical Research: Planets, 127, e2022JE007352. [7] Michaels et al., 2006, Geophysical Research Letters, 33(16), L16201. [8] Rafkin et al., 2001, Icarus, 151(2), 228–256. [9] Wolkenberg et al., 2010, Icarus, 207, 110–123.
How to cite: Wolkenberg, P., Hernández – Bernal, J., and Giuranna, M.: Characterization of aerosols during the dusty season in the Tharsis region on Mars, Europlanet Science Congress 2026, The Hague, The Netherlands, 7–11 Sep 2026, EPSC2026-178, https://doi.org/10.5194/epsc2026-178, 2026.
Mars Express: One more extension to foster its legacy
P. Martin, C. Wilson and the Mars Express Science Ground Segment Team and Flight Control Team
Mars Express mission technical status
Close to being the oldest operational spacecraft orbiting Mars, Mars Express has reached a lifetime of well over 20 years [1, 2]. The spacecraft platform health continues to be very good, albeit with only three operational gyros, the minimum needed for spacecraft operations. Gyroless routine operations continue running very smoothly as have been since May 2018. Further improvements have been deployed in the current extension cycle (e.g., wheel off-loadings added to the Gyroless Mode functionality), resulting in a drop of the gyro duty cycle to 3.3% or lower. This figure is expected to drop further over time, giving an estimated mission lifetime well beyond 2030. The spacecraft technical lifetime is also limited by fuel availability and battery performance. Latest predictions confirm available fuel for operations until at least 2033, and battery performance compatible with operations until 2042.
The technical status of the payload of Mars Express is overall very good to excellent, with all instruments maintaining their full technical capability as needed to support the identified science objectives of the proposed further extension, except for the Planetary Fourier Spectrometer (PFS) which suffers from pendulum laser diode ageing causing intermittent data loss.
With VMC and the Melacom telecommunications package being used routinely for science data acquisition, the spacecraft now has onboard two more science instruments than at launch! The mission performance, measured in terms of executed science observations versus the observation plan remains steadily close to 100%. Ground segment operations and systems are running smoothly.
A further enhanced mission toward an additional extension
A number of mission elements have been enhanced through the last few years. The reprogrammed MARSIS instrument is now capable, via deployed new sounding mode, of longer and continuous high-sensitivity sounding passes. Also, operational and scientific collaboration with ExoMars TGO has been increased, in particular through MEX-TGO inter-spacecraft radio science occultations. Such new implementations demonstrate that innovation still takes place on this ageing mission.
Mars Express continuing operations in the 2027-2029 timeframe would allow covering a full range of observation types. Furthermore, dedicated campaign possibilities are MARSIS South Polar nightside sounding, HRSC mid-latitude dayside imaging, co-located radio occultation with MARSIS soundings, Earth radio occultation high-density sounding, Phobos campaigns with JAXA’s MMX, and solar wind campaigns with NASA’s ESCAPADE.
In more detail with respect to international collaboration opportunities, a further extension would allow: coordinated Phobos characterisation observations through MMX phase 3 (sampling) and Mars observations of MMX phase 4; Phobos – solar wind interaction via MEX/ASPERA & MMX/MSA multi-point measurements; Mars atmosphere co-located observations via MEX/MaRS radio occultation soundings which are targets of interest for MMX/MIRS hyperspectral observation sequences, to enable 4-D atmospheric characterisation; MMX-MEX measurement cross-calibration, cross-validation, and sample analyses. Following the well-established MEX/MAVEN scientific scheme, collaboration with ESCAPADE, whose payload is highly complementary to the Mars Express payload, would consist in multipoint measurements, key to plasma and ionospheric science, to disentangle spatial & temporal variations.
Fostering Mars Express science return and legacy
Mars Express continues to be ESA’s most productive mission in planetary science. Its long-duration observational record is unmatched for atmospheric & ionospheric science, and a further extension would sustain the planetary science community until EnVision, JUICE and ExoMars rover arrive in the early 2030s. In addition to optimising the returned science via the proposed extension, the Mars Express team plans further effort toward enhanced archiving activities, with the aim of leaving a usable data archive as a high priority for mission legacy. Following the example set by Rosetta in 2016, an enhanced archiving phase has been proposed for the 2027-2029 period in order to ensure all mission science teams are up to date with deliveries, adequately staffed to support a final PSA archive review including documentation revisions and reprocessing as necessary, and support higher-level data product deliveries. Focus is therefore being placed on ensuring this long-lived planetary mission has the optimised legacy it deserves.
[1] Martin et al., Extending Mars Express gyros for a scientific lifeline, EPSC abstract, 2024.
[2] Martin et al., Mars Express: From the launch pad to a 20-year success record at Mars
Space Science Review, Vol. 221, 2025.
How to cite: Martin, P. and Wilson, C.: Mars Express: One more extension to foster its legacy, Europlanet Science Congress 2026, The Hague, The Netherlands, 7–11 Sep 2026, EPSC2026-1142, https://doi.org/10.5194/epsc2026-1142, 2026.
Abstract:
The ESA’s Exomars2016 (TGO) spacecraft has no radio-science PI-ship. However, tracking data are regularly performed for the purpose of orbit navigation determination. As the TGO orbit is near-circular, 400 km altitude and 74 degrees inclination, it theoretically offers the opportunity to improve the determination of the seasonal variations of the second-degree zonal harmonics of Mars gravity field. These variations are indeed poorly resolved using tracking data of near-polar orbiters. Here, we attempt to improve these second-degree harmonics variations using the tracking data of TGO collected from ESOC.
Theoretical basis:
The orbital perturbations of Martian spacecraft due to the seasonal variations of low degree zonal harmonics are expected to be small. An amplitude of up to 70 cm is expected on polar orbiters like Mars Odyssey for the odd zonal harmonics and only 5 cm for the even zonal harmonics. Today, the best orbit accuracy is about 1 meter, which makes possible to retrieve the odd harmonics but not the even harmonics (e.g. Marty et al., 2009; Konopliv et al., 2006; 2016; Genova et al., 2016). For a TGO like orbit, the orbit perturbations from the seasonal low degree zonal harmonics are about 25 cm for both even and odd harmonics. Therefore, even harmonics could be detected with TGO tracking data if its orbit can be determined with an accuracy of 1 meter or better.
Therefore, we performed Precise Orbit Determination from tracking data and a as precise as possible model of the orbital motion of TGO using the GINS software (Marty et al., 2009).
Precise Orbit Determination (POD) process
Any spacecraft is tracked from the Earth using the radio-link established between the spacecraft and tracking stations on Earth (Holmes et al., 2008). These stations record the variations of the carrier frequency of this radio-link (i.e Doppler effect). However, these Doppler tracking data are not a direct measurement of the variations of the gravity of the planet, but measurements of the spacecraft orbital velocity perturbations projected on to the Earth-spacecraft line-of-sight (LOS) direction. These perturbations are induced by the gravity field (including its time variations) of the planet as well as non-gravitational forces like the atmospheric drag, the solar radiation pressure and the albedo and Infrared radiation from the planet. In addition, Wheel-Off loading maneuvers are regularly performed and generate orbit perturbations. A model of all the forces driven the orbit is performed in order to generate Doppler data to get the residual with the observed Doppler data collected at tracking stations. A least-squares fit of the force model to these Doppler residuals is then performed in order to estimate parameters of the force model including seasonal variations of the zonal harmonics, a scale factor of the non-gravitational forces and a delta-velocity at each WoL event. As the non-gravitational forces act on the faces of the spacecraft, it is represented as flat plates (for the bus, the solar arrays and the High Gain Antenna – HGA) with known optical properties as provided by ESOC. The epoch and a delta-velocity a priori estimate at each WoL are also provided. The POD process is repeated over successive data-arcs of a few days’ duration.
Results of POD process on TGO tracking data
TGO is tracked from the Earth 4 hours a day on average using the ESTRACK network (Holmes et al., 2008) using a coherent two-way link in X band. The WoL events are frequent, between 4 and 6 per day. Therefore, most of them are off the tracking passes and the a priori delta-velocity could not be tuned during the least-squares process. This is a limitation on the accuracy of the orbit as shown for Mars Express which shows similar poor tracking coverage (Rosenblatt et al., 2008). The orbit accuracy is estimated using the recovery method over pairs of successive data-arcs (e.g. Konopliv et al., 2006; Rosenblatt et al., 2008; Marty et al., 2009). We obtained 4 meters in the along and cross-track direction on average and about 40 cm in the radial direction (Figure2). This accuracy is worse than the accuracy on Martian polar spacecraft which is about 1-2 meters. The main source of error on TGO orbit comes probably from the frequent WoL events that are far away tracking passes. In addition to ESTRACK passes, DSN passes are daily performed adding 2 more hours of tracking each day. However, it could not compensate the lack of tracking around WoL events so that the orbit accuracy could not be improved. The current accuracy prevented us to retrieve the 25cm signal expected from the seasonal variations of both odd and even zonal harmonics.
Perspectives
The seasonal gravity variations solution could not be improved using TGO tracking data in spite of the theoretically promising opportunity. However, by-products of the POD provide a scale factor of the drag force, which can be interpreted as a scale factor of the atmosphere density model used in the force model. As the orbit altitude of TGO is 400 km, it thus provides an estimation of the density in the exosphere of Mars. Therefore, it can provide a monitoring of this density to study its interaction with the space environment around Mars. The Mars Odyssey (ODY) tracking data have also been used to perform such studies since this spacecraft also orbit Mars at 400 km altitude (e.g. Bruinsma et al., 2014). We plan to compare both ODY and TGO density estimation in order to assess whether the TGO estimates can also be used for exospheric studies.
References
Bruinsma S. et al. (2014), J. Geophys. Res. : Planets, 119, P, 210-218; Genova A. et al. (2016), Icarus 272, 228-245; Konopliv A.S. et al. (2006), Icarus 182, 23–50; Konopliv A.S. et al. (2016), Icarus 274, 253-260; Marty J.C., et al. (2009), Planet. and Space Sci., 57(3), pp. 350-363 ; Rosenblatt P., et al. (2008), Planet. and Space Sci., 56, pp. 1043-1053.
How to cite: Rosenblatt, P. and Marty, J.-C.: Attempt to improve Mars’ time variable gravity with ESA’s Exomars2016 (TGO) tracking data, Europlanet Science Congress 2026, The Hague, The Netherlands, 7–11 Sep 2026, EPSC2026-526, https://doi.org/10.5194/epsc2026-526, 2026.
Observing the temporal variations of a planet’s gravity field provides direct constraints on its internal composition and dynamics. A satellite mission concept called MaQuIS employs the successful mission technology of GRACE-FO and GRAIL and is dedicated to improving our knowledge of the Martian gravity field, thereby enabling studies on planetary dynamics, subsurface water reservoirs, and seasonal changes such as melting cycles.
In preparation for such a mission we are conducting end-to-end simulations. That involves the generation of synthetic tracking, inter‑satellite ranging, and accelerometer data for a range of orbital configurations and sensor designs, including quantum sensors. The synthetic observation data are used to recover simulated gravity field solutions in order to evaluate the mission’s scientific outcome. A key element of the latter is the orbit determination. It yields orbit residuals that express the misalignment of the observed trajectory with the a‑priori model predictions and serve as the observation vector for the gravity‑field inversion.
In this talk I will discuss the main pitfalls that arise when adapting Earth-well‑tested orbit‑fit algorithms to the Martian environment, in particular the difficulty of combining high-precision inter-satellite ranging data with less accurate radio Doppler tracking measurements.
How to cite: Bredlau, M.: Orbit Determination for Gravity-Field Recovery of a Martian Satellite Gravimetry Mission, Europlanet Science Congress 2026, The Hague, The Netherlands, 7–11 Sep 2026, EPSC2026-420, https://doi.org/10.5194/epsc2026-420, 2026.
Introduction: The International Mars Exploration Working Group (IMEWG) has assembled a sub-working group to identify and prioritize science and planetary protection (PP) goals that should be the target of Mars investigations during the transition period between the current robotic-only exploration and future synergistic missions by robots and humans.
The “Mars Science Scope Prior to the Arrival of Humans (MSSPAH)” sub-working group efforts will provide inputs to facilitate informed decision making by space agencies and the international Mars exploration community about future science missions.
The MSSPAH sub-working group started their work in February 2026 and the team is targeting completion in November 2026.
MSSPAH Organization: The working group comprises members competitively selected from applicants worldwide, as well as agency-nominated IMEWG members and ex-officio representatives from stakeholder organizations such as the Committee on Space Research (COSPAR), the International Space Exploration Coordination Group (ISECG), and NASA’s Exploration Systems Development Mission Directorate (ESDMD).
Workflow: The work is broadly divided into three different tasks:
- Scientific Priorities: Starting from the existing science/planetary protection (PP) objectives driving robotic exploration of Mars, identify Mars science priorities that could be affected by the arrival of humans.
- Knowledge gaps: Based on the existing documentation, identify planetary protection approaches and residual risks to humans or equipment, and evaluate which could be addressed by the prioritized science.
- Prioritization: Establish metrics to prioritize scientific and PP objectives and generate matrix of investigations vs metrics to identify priorities.
At the time of writing, the group was divided into three sub-groups (covering the areas of geology, life, and climate) and is finalizing task 1. The near-final findings of this group will be presented at this meeting.
How to cite: Thiessen, F., Vago, J., May, L., Carrier, B., and Haltigin, T.: Mars Science Scope Prior to the Arrival of Humans (MSSPAH), Europlanet Science Congress 2026, The Hague, The Netherlands, 7–11 Sep 2026, EPSC2026-436, https://doi.org/10.5194/epsc2026-436, 2026.
We consider the problem of using the current Martian resources for the reconstruction of the past Martian environment or/and Mars terraforming projects. The Martian environment billions of years ago, was similar to the goals of terraforming Mars. The main difference is oxygen, which occurs in large quantities in Earth's current atmosphere. However, billions of years ago, oxygen was almost non existent on both Mars and Earth. Of course, if any Martian organisms originated and survived, restoration would mean restoring for these organisms their lost environment.
The arguments for reconstruction are similar as those for terraforming: Mars (after reconstruction) may be humanity's last hope. Although a reconstructed Martian atmosphere would have too much CO2 and too little oxygen, its pressure will be enough to allow human to life with only an oxygen mask on the planet's surface.
Let us note that the terraforming is an attempt to find a place for humanity in the event of a catastrophe. There could be a number of reasons why terraforming would be necessary, e.g.:
1. Radical increasing of volcanic activity, including supervolcanos eruptions. The Permian–Triassic extinction killed 70% of terrestrial vertebrate species.
2. Global warming. Current forecasts predict a moderate temperature increase. The example of conditions on Venus indicates that worse scenarios are theoretically possible. With the special values of parameters, a temperature increase could occur that would practically make life on Earth impossible.
3. Unrestricted nuclear war. The use of large numbers of dirty (cobalt) bombs could result in severe contamination of vast areas of the Earth.
4. Others, e.g. dramatic environmental pollution, new deadly bacteria etc.
In previous papers [1, 2], we consider the main problem of some terraforming versions, i.e., the transport gigantic masses of volatiles from Kuiper Belt. This doesn't change the fact that exploiting Martian resources will also be beneficial. The Martian resources cannot be reliably determined at this time, but of course, if any terraforming program is implemented, these resources will be explored, identified, and exploited.
Currently, estimates are possible mainly for the polar caps. They contain large amount of CO2 and water. Releasing the CO2 contained there would increase the atmospheric pressure by approximately 30-60 kPa [3]. It means that any terraforming of Mars that include significant temperature increase (i.e. probably everyone), will result in the release of large mass of CO2 from the polar cups.
However, CO2 is a gas whose content in the final atmosphere should be small. Earth's atmosphere contains approximately 0.04%. For humans, concentrations below 500 ppm is harmless. Above 5%, it is toxic. Therefore, the amount of CO2 should be significantly reduced. Thanks to the development of genetic engineering, suitable organisms, e.g., appropriately modified plants or bacteria, can be created for this purpose. The release of oxygen from the CO2 may ensure oxygen content in the atmosphere. This means that terraforming Mars might not require large transport of oxygen.
To enable terrestrial organisms to live on Mars, they must be provided with basic elements known as the "CHNOPS" elements (Carbon, Hydrogen, Nitrogen, Oxygen, Phosphorus, Sulphur). Nitrogen is particularly important here, as it is a main component of the atmosphere. Some nitrates are found in the soil of Mars. However, the situation isn't as clear as with oxygen because we can't estimate how much nitrogen could be extracted from them. Remember, we want Mars's future atmosphere to be about 78% nitrogen that requires about 3.5E 10^18 kg. Probably we will have to transport at least part of this amount of nitrogen in the form of nitrates (e.g., NH3, HCN) to Mars.
However, our plan is not to create a desert planet, even if it has a breathable atmosphere. We want, at least at some places, to create permanent water reservoirs in equilibrium with the atmosphere, i.e., to restore a complete hydrological cycle. In its history, Mars has been drastically depleted of water resources.
Unfortunately, our current information does not allow to determine how much water we can extract from the Martian crust. It contains a significant amount of water in hydrated minerals. [4] estimate that there are 130–260 m global equivalent layer (GEL) of water. Even more optymistic are [5]. They found (based on the seismic data from InSight lander) significant low-velocity layer in Martian crust between depths of 5.4 and 8 km. They interpreted this zone as high-porosity, water-saturated layer. They estimated that the layer hold a liquid water volume of 520–780 m of GEL. However, [6] states that data from InSight do not require a water-saturated mid crust. To solve this problem, we would need a few more seismographs on Mars.
Note that with access to some energy, water can be extracted from some sources, e.g. from hydrated minerals, from polar permafrost, underground reservoirs etc. The energy cost could be probably lower than transport from KB. However water from these sources could be unstable. Instead to take part in the hydrological cycle it will escape into traps. This instability may give rise to the Sisyphean effect, i.e. effects of your work will fast vanish. The Sisyphean effect increases the value of water transported from the Kuiper Belt.
Acknowledgments:
The research was partially performed as part of the statutory activities of CBK PAN. No additional funding.
[1] L. Czechowski (2025).. LPSC 2025, 1858.pdf
[2] L. Czechowski (2026), LPSC 2026, 1457.pdf.
[3] R.M., Zubrin, and McKay, P. (1993) NASA Ames ResearchCenter (c.1993). .
[4] L. J. Wernicke, B. M. Jakosky (2021) . JGR planets. https://doi.org/10.1029/2019JE006351
[5] Weijia Sun, et al. (2025). National Science Review 12: nwaf166, 2025 https://doi.org/10.1093/nsr/nwaf166
[6] Jakosky, B. (2025). Letter Earth, Atmospheric, and Planetary Sciences. 122 (11) e2418978122 https://doi.org/10.1073/pnas.2418978122
How to cite: Czechowski, L.: Martian resources and restoration/terraforming of Martian environment , Europlanet Science Congress 2026, The Hague, The Netherlands, 7–11 Sep 2026, EPSC2026-753, https://doi.org/10.5194/epsc2026-753, 2026.
Please decide on your access
Please use the buttons below to download the supplementary material or to visit the external website where the presentation is linked. Regarding the external link, please note that Copernicus Meetings cannot accept any liability for the content and the website you will visit.
Forward to presentation link
You are going to open an external link to the presentation as indicated by the authors. Copernicus Meetings cannot accept any liability for the content and the website you will visit.
We are sorry, but presentations are only available for conference attendees. Please register for the conference first. Thank you.
You have already stored your personal programme. Please decide:
the present selections with my stored personal programmemy stored personal programme with the present selections
Please decide on your access
Please use the buttons below to download the supplementary material or to visit the external website where the presentation is linked. Regarding the external link, please note that Copernicus Meetings cannot accept any liability for the content and the website you will visit.
Forward to session asset
You are going to open an external link to the asset as indicated by the session. Copernicus Meetings cannot accept any liability for the content and the website you will visit.
We are sorry, but presentations are only available for conference attendees. Please register for the conference first. Thank you.