
 1,2,1,
- 1Weizmann Institute of Science, Earth and Planetary Sciences, Rehovot, Israel (gidi.yoffe@weizmann.ac.il)
- 2University of California, Riverside, Earth and Planetary Sciences, Riverside, California, USA
- 3Hebrew University of Jerusalem, Statistics and Data Science, Jerusalem, Israel
The search for life in the Solar System hinges on measurements that planetary missions can return. Classical organic biosignatures, including molecular identity, isotopic composition, and chiral excess, require compound-specific resolution, high precision, and contamination control, and may be altered by degradation processes [e.g., 1,2]. We introduce a new class of biosignatures, based on the statistical organization of molecular assemblages [3]. Its premise is that abiotic chemistry, governed primarily by thermodynamic and kinetic constraints, tends to favor simple compounds and sparse abundance distributions [4], whereas biological systems maintain molecular distributions through metabolism, regulation, and functional demand [5]. Relative abundances within a coherent molecular family should therefore encode an origin-diagnostic imprint of chemical organization.
We quantify this imprint using the ecodiversity formalism, treating each molecular assemblage as an analog of an ecological community, with compounds as species and relative abundances defining community structure [6,7]. For each sample, we compute Hill-number diversity profiles and normalize them by sample richness to obtain evenness curves. These curves isolate abundance structure from total concentration and species count, enabling comparisons across datasets that differ in extraction protocol, analytical method, inventory size, and molecular coverage. Measurement uncertainty is propagated through the diversity calculation, and sample dissimilarities are estimated from the separation of evenness-curve distributions.
We apply this framework to a heterogeneous dataset of amino-acid assemblages spanning biological, extraterrestrial, and experimental contexts. Biotic samples include microbial biomass, sediments, hydrothermal fluids, fossil-bearing cherts, fossilized biominerals, and amber-preserved material. Abiotic samples include carbonaceous chondrites, returned asteroidal material from Ryugu and Bennu, ureilites, laboratory-prebiotic-synthesis products, and simulated ocean-world analogs [e.g., 8–10]. Despite this heterogeneity, biotic and abiotic samples occupy distinct regions of diversity space (Fig. 1a). Biotic amino-acid assemblages are more even, reflecting coordinated production of chemically diverse building blocks (Fig. 1b), whereas abiotic assemblages are sparser and more strongly dominated by low-mass species, consistent with thermodynamic and kinetic control [4]. This separation is not only visual: k-nearest-neighbor classification of the diversity space embedding yields high classification performance, with normalized Matthews correlation coefficients of approximately 90–100% across neighborhood sizes and permutation-based significance exceeding 4σ (Fig. 1c). Extensively altered samples form an intermediate group, indicating that diversity structure encodes preservation state as well as biogenicity.
We further apply the framework to fatty acids, a second molecular class central to membranes and prebiotic chemistry [11,12]. Biotic and abiotic fatty-acid assemblages are again separable, but the diversity contrast reverses. Abiotic fatty acids are more even across chain lengths, consistent with broad production pathways such as Fischer-Tropsch-type synthesis [12]. Biotic fatty acids are sparser, reflecting membrane biosynthesis, which selects restricted chain lengths and parities required for cellular function [11]. Thus, biological organization expands diversity where a broad repertoire is required, as in amino acids, and constrains it where function demands a narrower compositional range, as in membrane-forming fatty acids.
Finally, we test the persistence of the amino-acid diversity signal under space-like degradation by modeling radiolysis in Europa’s near-surface ice. Biotic and abiotic profiles are evolved under depth-dependent radiation doses and species-specific radiolytic decay constants [13,14]. The degraded biotic signal diverges from its pristine state and may briefly approach an abiotic-like profile, but remains distinguishable across depths and timescales relevant to planetary exploration until abundances become too sparse for an evenness curve to be defined.
Diversity analysis is therefore an instrument-agnostic framework for life detection. It requires only relative abundances within a coherent molecular family and can be applied to diverse measurement techniques. By capturing a statistical property of molecular organization, it provides a general, interpretable, and mission-compatible biosignature that complements existing approaches and may transcend signatures contingent on Earth-specific evolutionary history.
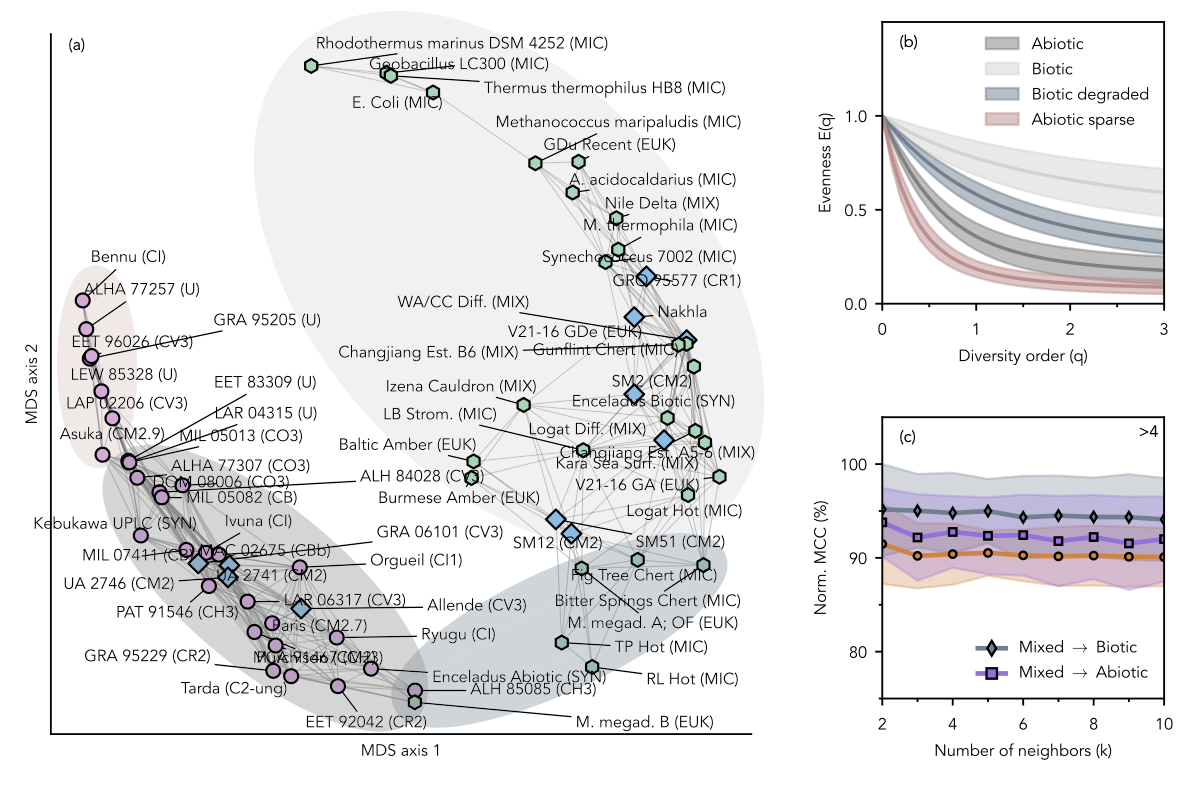
Figure 1. Dissimilarity analysis of evenness curves for amino-acid assemblages. (a) Multidimensional Scaling (MDS) projection of pairwise dissimilarities between evenness curves, E(q). Each point represents a sample; distances increase with statistical separation. Edges connect samples to the 25th percentile of their nearest neighbors. Markers denote inferred origin: biotic (green hexagons), abiotic (pink circles), and mixed (blue diamonds). (b) Evenness-curve distributions for four sample groups. Solid lines indicate group means; shaded regions denote one standard deviation. Each color represents the distribution of samples contained within the shaded regions of the same color in panel (a). (c) Classification performance of sample origin using k-Nearest-Neighbors (kNN) applied to pairwise dissimilarities projected onto the first two MDS axes. Three labeling schemes are evaluated: all three groups retained, and two alternatives in which the mixed group is assigned to either the biotic or abiotic class. Accuracy is reported as the normalized Matthews Correlation Coefficient (MCC), where 50% corresponds to random assignment and 100% to perfect classification. Uncertainty is estimated by bootstrapping class-balanced subsamples and recomputing kNN accuracy for each subsample. The value shown at the top right denotes the smallest permutation-based Z score across all k. It measures the deviation of the observed mean MCC from the mean under permuted class labels, using the most conservative value across the three labeling schemes.
Bibliography
[1] Sephton, Nat. Prod. Rep. 19, 292–311 (2002). [2] Patty et al., Chiral Analysis, 29–69 (2018) [3] Yoffe, G. et al., Nat. Astron. (2026). [4] Higgs & Pudritz, Astrobiology 9, 483–490 (2009). [5] Smith & Morowitz, PNAS 101, 13168–13173 (2004). [6] Hill, Ecology 54, 427–432 (1973). [7] Chao et al., Annu. Rev. Ecol. Evol. Syst. 45, 297–324 (2014). [8] Parker et al., GCA 347, 42–57 (2023). [9] Glavin et al., Nat. Astron. 9, 199–210 (2025). [10] Kebukawa et al., Sci. Adv. 3, e1602093 (2017). [11] Deamer, Orig. Life Evol. Biosph. 17, 3–25 (1986). [12] McCollom et al., Orig. Life Evol. Biosph. 29, 153–166 (1999). [13] Pavlov et al., Astrobiology 24, 698–709 (2024). [14] Yoffe et al., Astrobiology 25, 359–366 (2025).
How to cite: Yoffe, G., Klenner, F., Sober, B., Kaspi, Y., and Halevy, I.: Diversity within organic assemblages as a biosignature, Europlanet Science Congress 2026, The Hague, The Netherlands, 7–11 Sep 2026, EPSC2026-161, https://doi.org/10.5194/epsc2026-161, 2026.


