
 1,1,1,2,1,1,1
- 1The Open Univerity, STEM, School of Physical Sciences, Milton Keynes, United Kingdom of Great Britain – England, Scotland, Wales (alexander.barrett@open.ac.uk)
- 2European Space Agency (ESA), European Space Technology Centre (ESTEC), Noordwijk, the Netherlands.
- 3Centre for Modelling and Simulation (CFMS), Bristol, UK.
Transverse Aeolian Ridges (TARs)1 are decametre scale bedforms, common across the martian mid-latitudes. TARs are armoured by a layer of granule sized clasts. Intense gusts of wind mobilise the armouring layer, initiating the movement of the bedforms and causing TARs to align transverse to prevailing peak winds. Since the majority of mid latitude TARs show little to no movement in the present day2, TAR orientations provide a geomorphic record of historic wind vectors, in the epoch when large scale sediment transport last occurred.
A deep learning approach3 was used to segment TARs in ~10,000 HiRISE Images4 (e.g. Fig 1). A Mask R-CNN model with a ResNet 50 backbone was trained on ~5000 manually digitised TARs from six representative images. Once segmented, candidate TARs were cleaned and measured using an ArcPy-based postprocessing pipeline which recorded their orientation. The network performed well, producing comparable orientation results to manually mapped TARs.
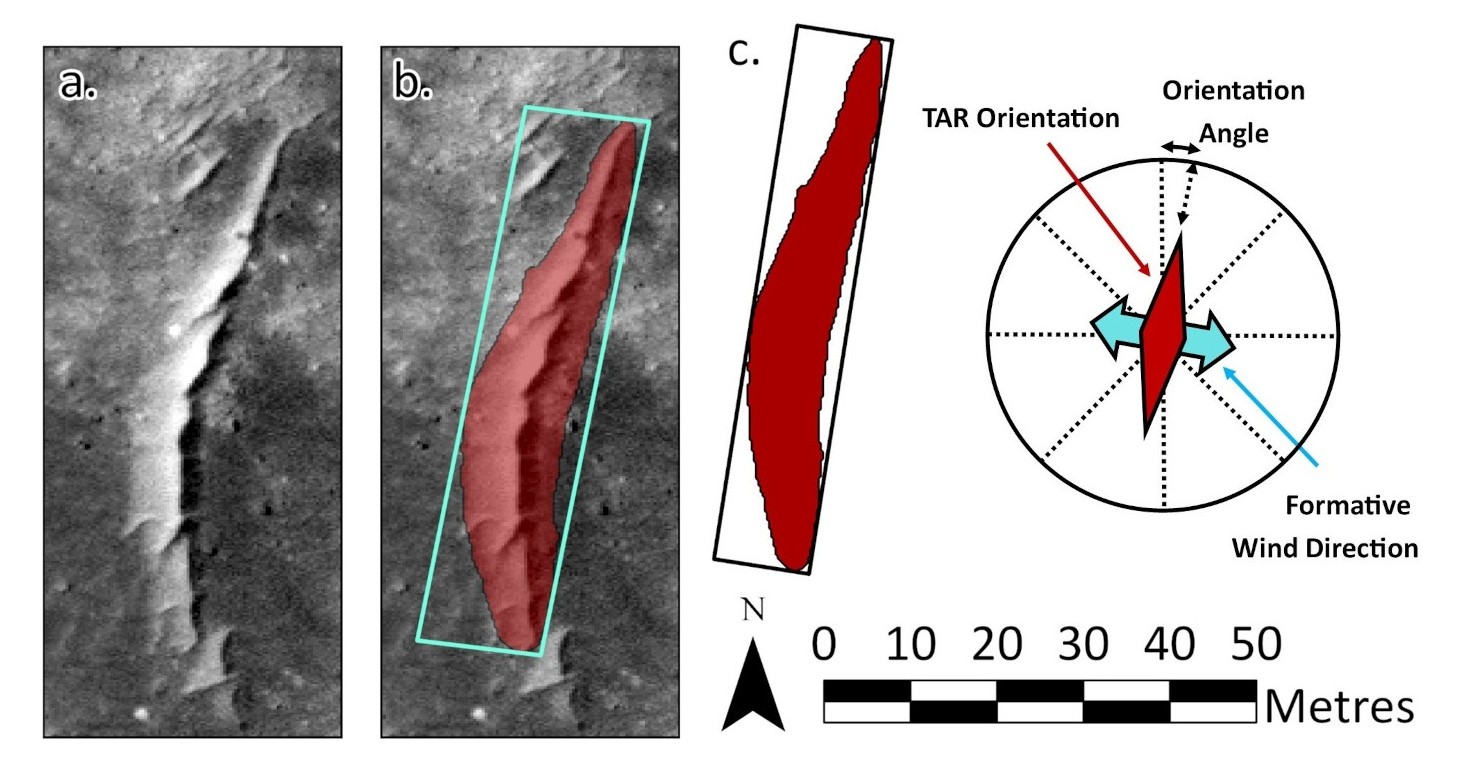
Figure 1: a) A TAR in HiRISE image ESP_ 057724_1390, b) the TAR is detected by the network (red segmentation mask) and a rotated bounding box (turquoise) is fitted to it using the ArcGIS “minimum bounding geometry” tool c) the long axis of the bounding box provides a proxy for TAR orientation. The formative wind direction is inferred to be perpendicular to this, blowing across the feature. There is a 180° ambiguity when since the stoss and lee slopes cannot be distinguished automatically.
Most images contained a few tens of false positives, however, since thousands of true positive TARs were present, the TAR signal was easily distinguishable from this “noise”. Sites with <1000 detections seldom contained real TAR populations and were removed from the dataset. False negatives occurred frequently and randomly. While they reduced the overall sample size, they were found to not introduce a systematic bias into the orientation measurements, and did not adversely affect the results.
Using this approach, ~20 million TARs were digitised, allowing TAR orientation to be characterised over an unprecedentedly large area. Global orientation trends were examined, while regional analysis focused on an area covering Isidis, Elysium, and the southern half of Utopia Planitia, and adjoining highlands in Syrtis Major and along the Dichotomy Boundary.
Low relief plains were found to exhibit spatially coherent TAR alignments which extend across dozens of adjacent HiRISE images. This provides a strong signal for wind direction during TAR forming epochs. In rugged areas, local relief preferentially controlled TAR formation, yielding heterogeneous or multimodal orientations. Larger scale topographic control was found in outflow channels, or impact craters. These sites were identified by manually comparing the regional TAR orientation trends to topographic maps from the Mars Orbiter Laser Altimeter (MOLA).5
The distribution of TAR forming wind vectors within each HiRISE image was compared to simulated wind regimes from a Global Circulation Model (GCM)6. Obliquity scenarios representing the most prevalent conditions during the last twenty million years were simulated. Agreement to the TARs was quantified using Earth Movers Distance (EMD)7, a metric of dissimilarity between histograms. The higher the EMD the more dissimilar the distributions, to a maximum of 90°.
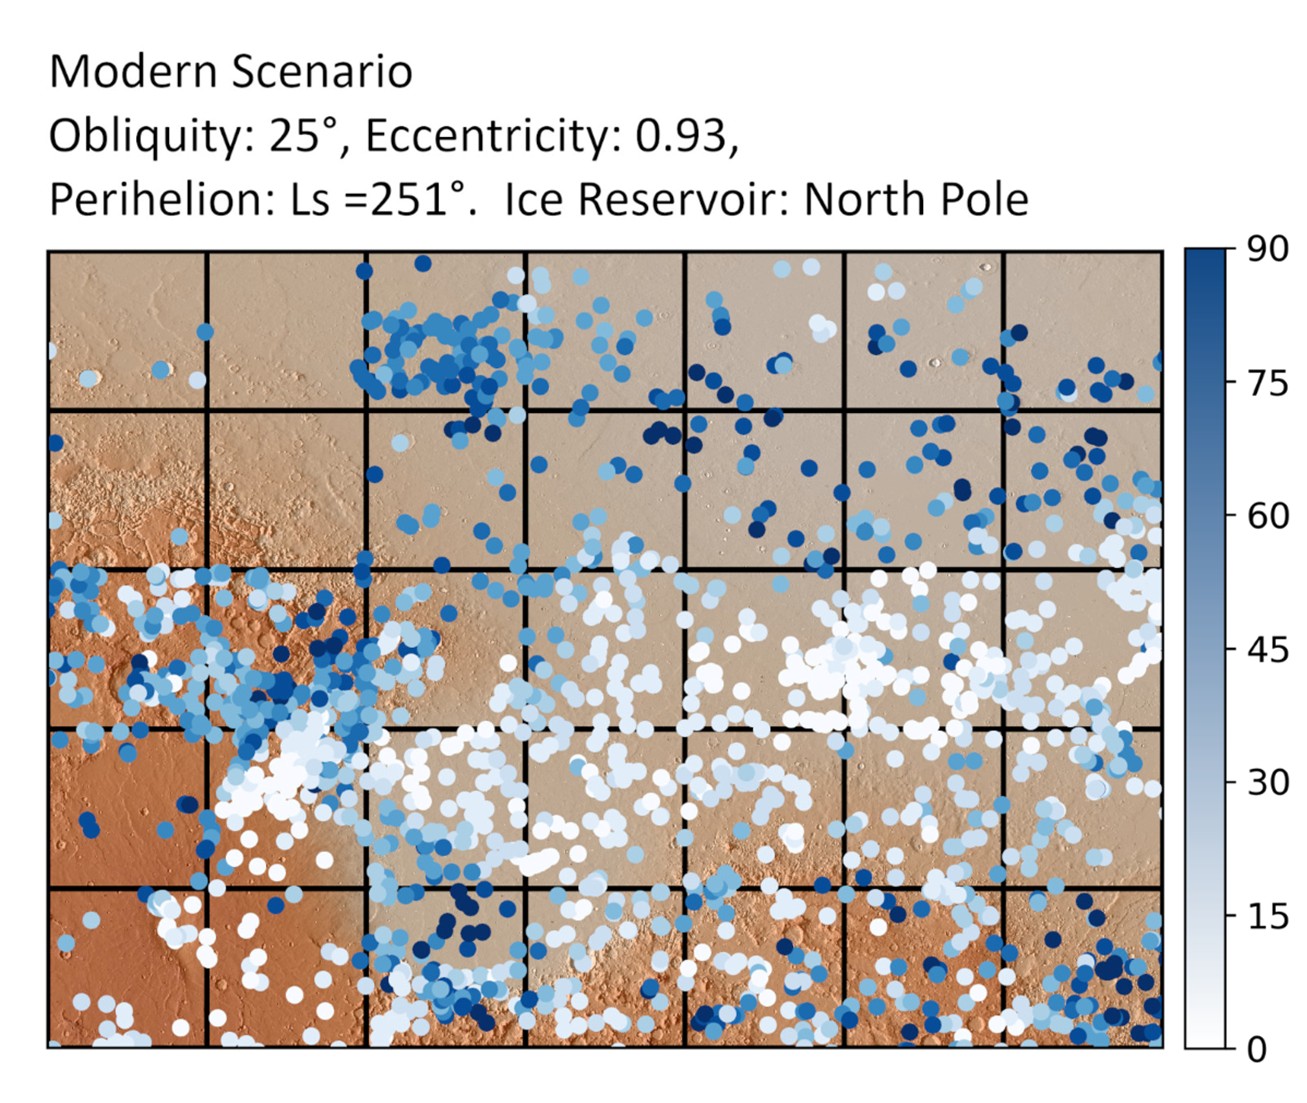
Figure 2: EMD (°) comparing the distribution of modern GCM wind vectors to TAR forming winds. Each point represents all TAR orientations in a single HiRISE image. White = close match (low EMD), blue = poor match (high EMD). A central low EMD region starts in Syrtis Major and covers the northern part of Isidis and most of Elysium Planitia. There are poorer matches on the Dichotomy Boundary, and in Utopia Planitia.
Several regions exhibit directional stability across all scenarios, suggesting that peak wind vector is not sensitive to obliquity in these areas. In most such regions, the modelled results are always a good match for TAR orientations, suggesting that conditions here have consistently favoured TAR formation throughout the geological history of Mars. Some regions never show alignment between the observed TARs and modelled wind vectors. This occurs most in regions where TAR populations are topographically controlled.
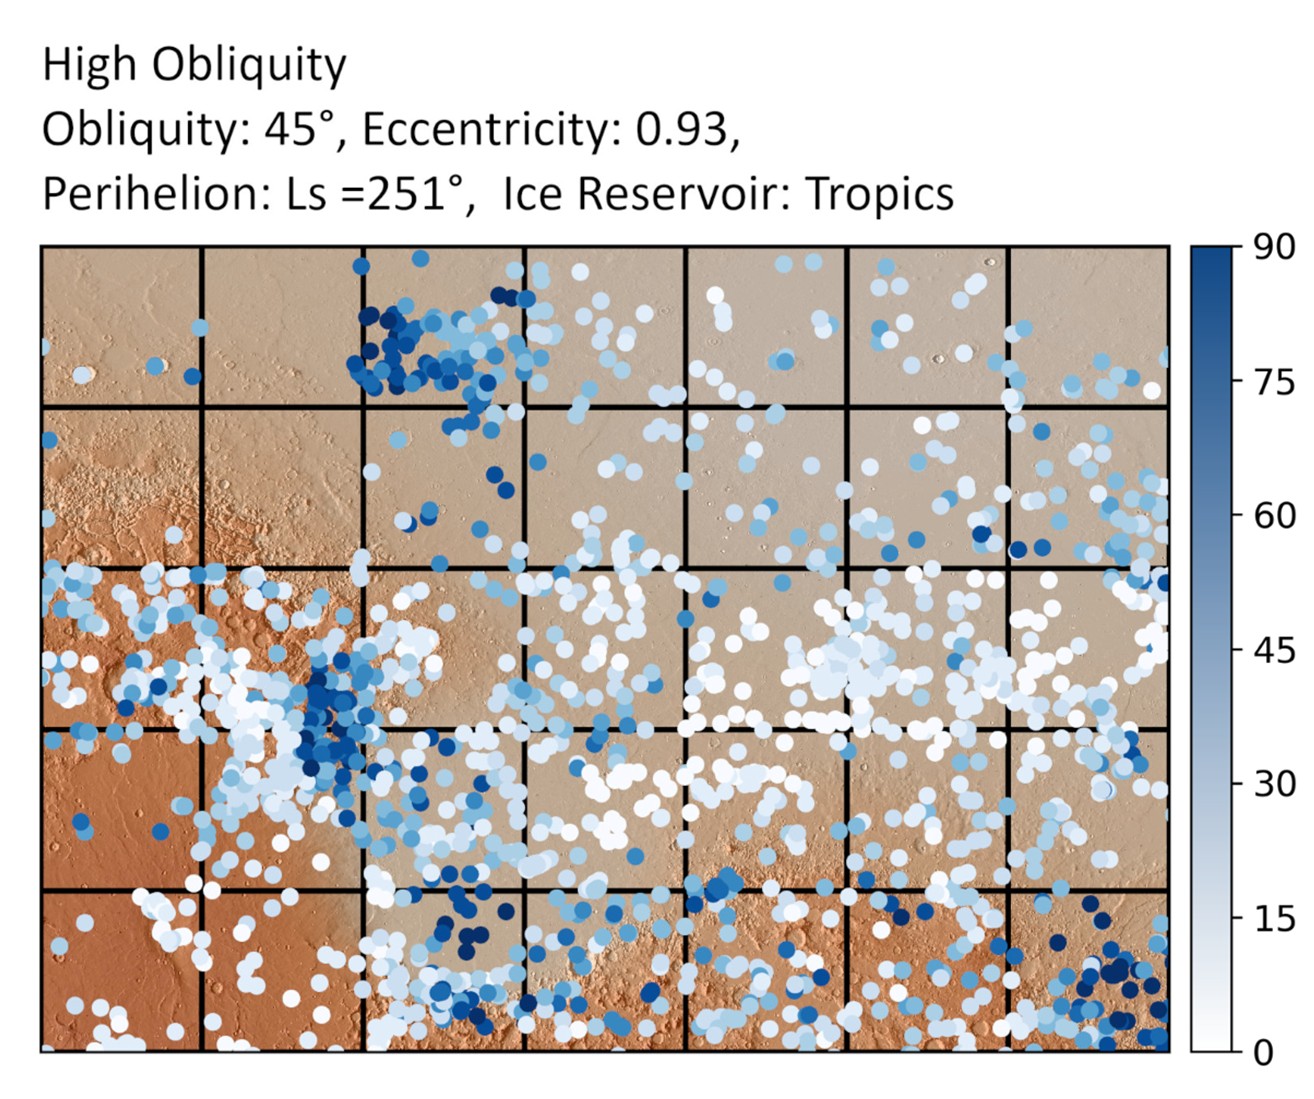
Figure 3: EMD (°) comparing high obliquity GCM wind vectors to the distribution of TAR forming winds. Low EMD values occur across the study area. Utopia Planitia matches much better in this scenario, although high EMD remains in some scattered regions.
In regions where simulated wind vectors diverge strongly between obliquity scenarios, such as Utopia Planitia, observed TAR orientations are most consistent with formation under a high obliquity scenario with axial tilt of 45° (fig 3) and a tropical ice reservoir. 15°, 25° (fig 2), and 35° obliquity scenarios showed a poor match to TAR orientations in these high variance regions, as did a GCM run simulating the known conditions during Mars Year 35.
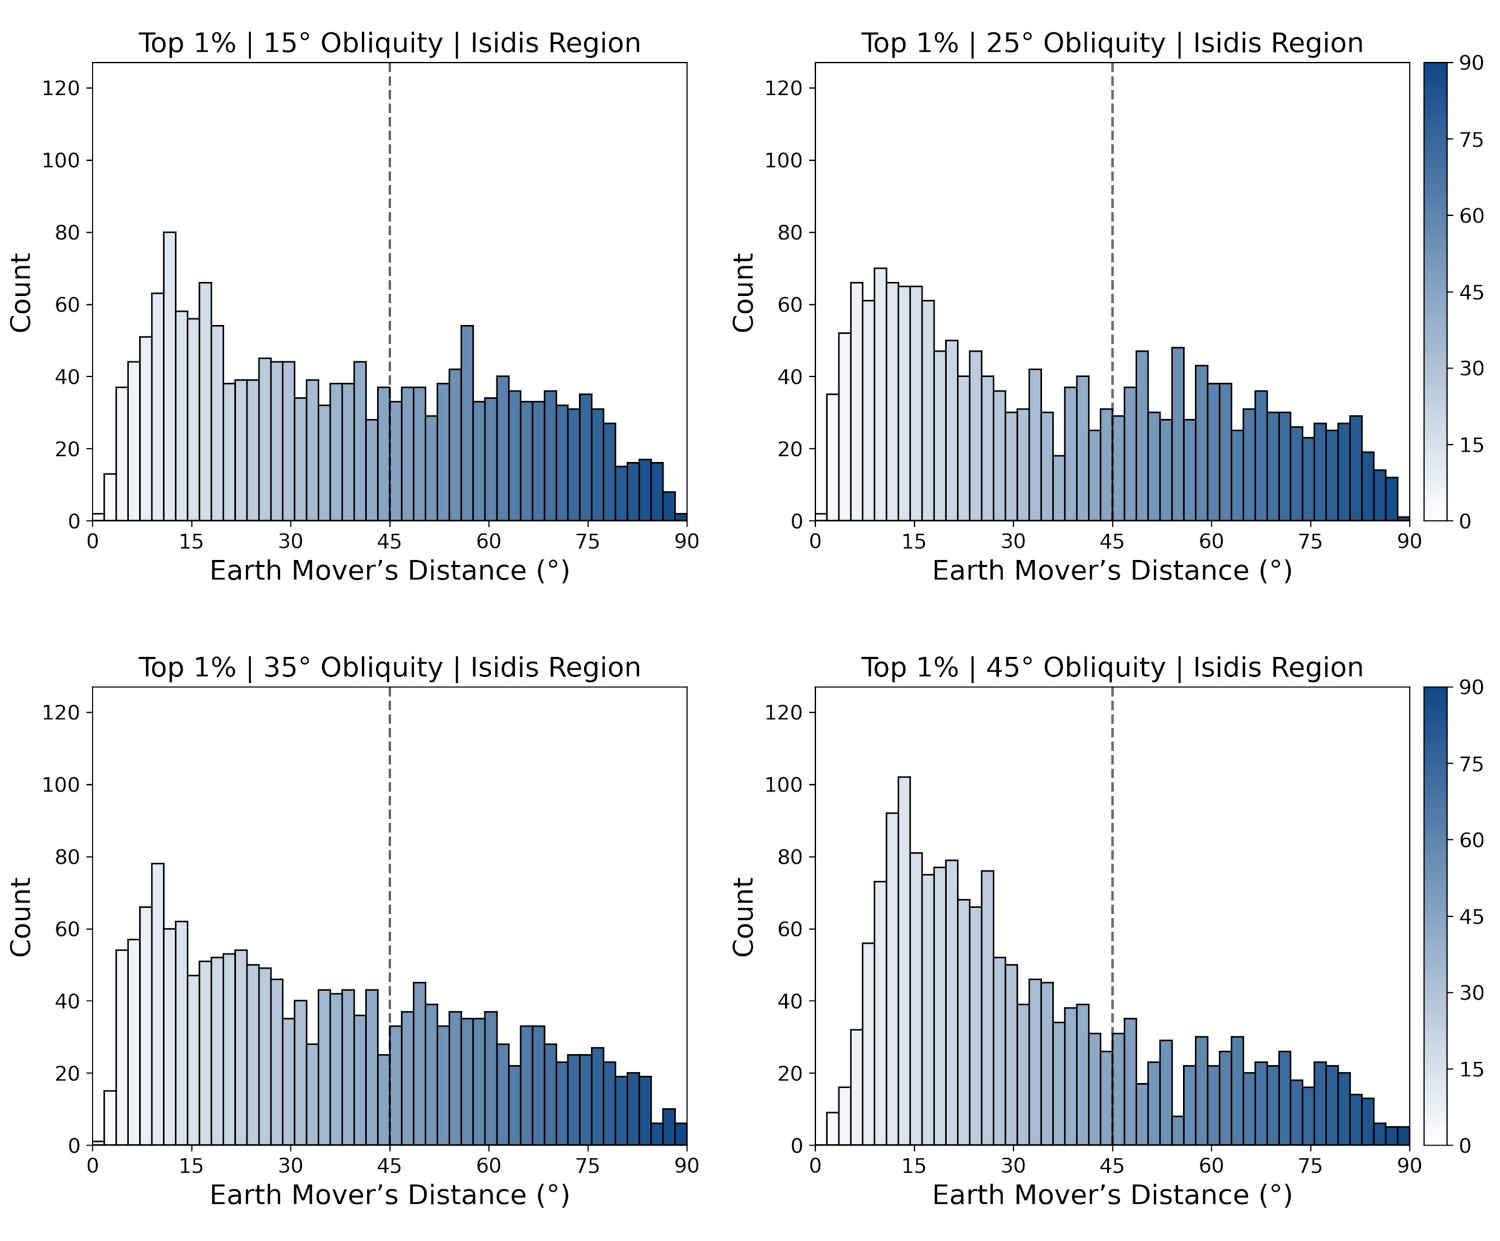
Figure 4: Histograms summarising EMD for four climate scenarios in the Isidis Region. They show the minimum EMD between TAR forming and GCM modelled wind vectors for the top 1% of modelled wind speeds (i.e. the peak winds). All climate model scenarios exhibit a peak at 10-15°, where stable areas yield a good match to the TARs. This peak is largest in the 45° obliquity scenario, which also shows the fewest sites with an EMD above the 45° threshold for acceptable correspondence between modelled and observed wind vectors.
The most recent 45° obliquity excursion occurred 5.5 million years before the present8. TARs in the high variance regions were likely last active at this time. It is plausible that TARs in low variance regions also formed at this time. However, since their wind vectors remain consistent through most obliquity excursions, TAR formation at a later time cannot be ruled out.
[1] Balme et al., 2008, Geomorphology; [2] Bridges et al., 2013, Aeolian Research; [3] Barrett et al., 2026, Icarus; [4] McEwen et al., 2007, JGR Planets; [5] Smith et al., 2001, JGR Planets; [6] Holmes et al., 2020, PSS [7] Rubner et al., 1998, Sixth International Conference on Computer Vision;; [8] Laskar et al., 2004, Icarus.
How to cite: Barrett, A. M., Balme, M. R., Favaro, E. A., Rajendran, K., Woods, M. J., Elsarky, L., Malinowski, M., Holmes, J. A., Foley, L.-A., and Patel, M. R.: Transverse Aeolian Ridges on Mars: A geomorphic marker for past climate regimes., Europlanet Science Congress 2026, The Hague, The Netherlands, 6–11 Sep 2026, EPSC2026-233, https://doi.org/10.5194/epsc2026-233, 2026.


