
 ,
,- Università degli studi Roma Tre, Dipartimento di Matematica e Fisica, Roma, Italy (thong@os.uniroma3.it)
- Introduction
Ultimi Scopuli is one of the most intriguing regions on Mars, where anomalously bright basal reflectors beneath a ~1.5 km thick ice sheet have been detected by MARSIS and interpreted as subglacial liquid-water bodies (Orosei et al., 2018; Lauro et al., 2021). Due to the ongoing debate surrounding the liquid water lake hypothesis (Cosciotti et al., 2023; Mattei et al., 2022; Stillman et al., 2022), as well as alternative interpretations (Bierson et al., 2021; Smith et al., 2021; Lalich et al., 2024), recent SHARAD observations acquired with the Very-Large-Roll configurations (VLR2 and VLR4) have focused on this region. In particular, the new VLR4 observation (ID: 8827401) revealed a basal reflector at the same location and depth as previously detected by MARSIS (Morgan et al., 2025).
Furthermore, splitting the SHARAD frequency band into high- and low-frequency sub-bands showed that the basal reflectors are detectable only in the low-frequency sub-band. In the high-frequency sub-band, the basal reflections are suppressed by background noise or by strong volume scattering (“fog”). This behavior suggests that the frequency distribution of basal echo power may play a crucial role in constraining the physical properties of the penetrated materials.
Building on this observation, we investigate the frequency distribution of basal echo power by analyzing several SHARAD observations collected over Ultimi Scopuli using the Short-Time Fourier Transform (STFT). The analysis focuses on the depth dependence of the basal reflectors, with the aim of identifying variations in the basal echo power distribution as a function of time delay and estimating radar attenuation. Radar attenuation is a key parameter for determining the permittivity of basal materials based on the intensity of the basal reflections (Lauro et al., 2022).
- Methods
We applied a processing chain distinct from the standard RDR format (Fois et al., 2007) to probe the frequency distribution of subsurface reflectors as a function of depth across various areas within Ultimi Scopuli. Beginning with the raw EDR data, we first performed range‑compression using the reference chirp (Croci et al., 2011). To mitigate strong electromagnetic interference (EMI) that appears at particular frequencies, we averaged the spectra over 40 azimuth samples. This spectral averaging can substantially increase the signal‑to‑noise ratio by >10 dB and reveal subsurface reflectors that are not discernible with simple range compression.
After range compression and spectral averaging, the data with basal reflectors were processed with STFT. The resulting STFT images and corresponding radargrams are presented in Figures 1–4.
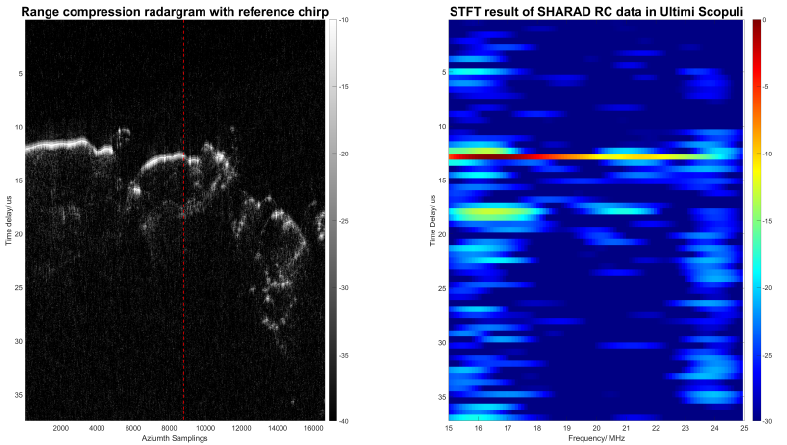
Figure 1. (Left panel) The SHARAD range-compressed radargram collected at the edge of Ultimi Scopuli. (Right panel) The STFT result of the range-compressed data marked in the left panel, in which the basal echo is located at t=~18 us.
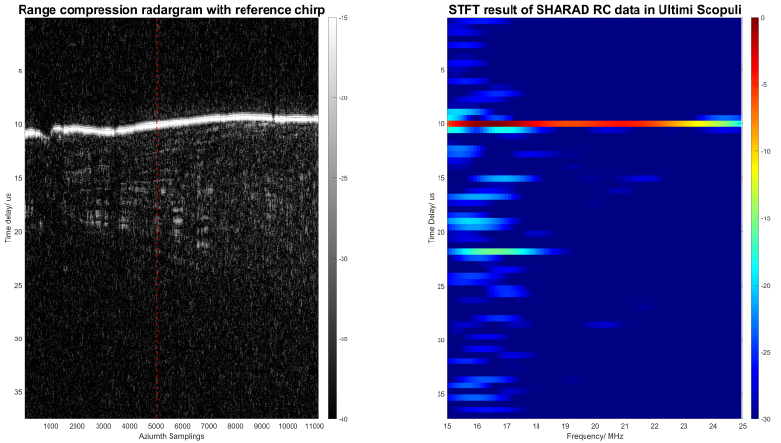
Figure 2. (Left panel) The SHARAD range-compressed radargram collected in Ultimi Scopuli. (Right panel) The STFT result of the range-compressed data marked in the left panel, in which the basal echo is located at t=~22 us.
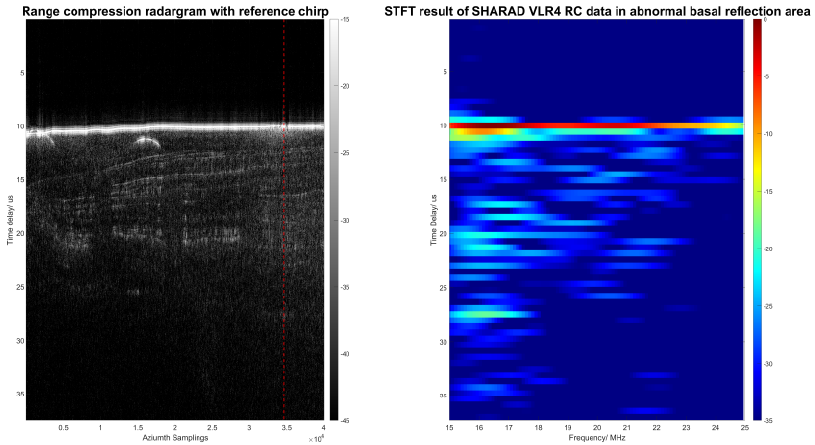
Figure 3. (Left panel) The VLR4 SHARAD range-compressed radargram collected in the abnormal basal reflection area, Ultimi Scopuli. (Right panel) The STFT result of the range-compressed data marked in the left panel, in which the basal echo is located at t=~27.5 us.
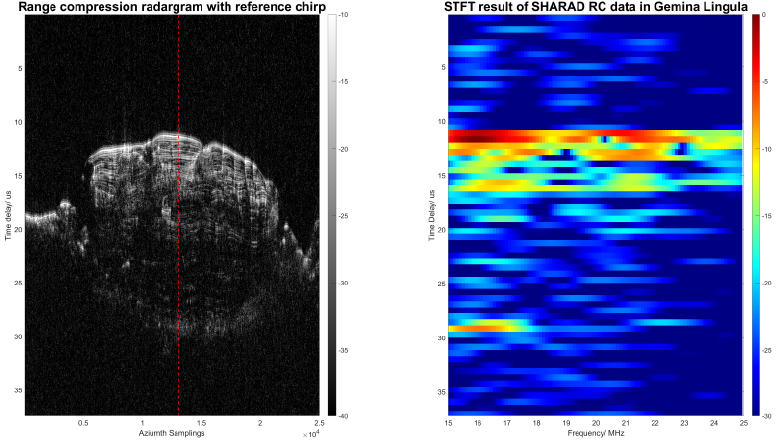
Figure 4. (Left panel) The SHARAD range-compressed radargram collected in Gemina Lingula. (Right panel) The STFT result of the range-compressed data marked in the left panel, in which the basal echo is located at t=~29 us.
- Results
The Short‑Time-Fourier-Transform (STFT) analysis shows that the frequency content of subsurface reflectors changes systematically with depth. At the periphery of Ultimi Scopuli, the basal echo occurring ~5 µs after the surface is confined to 15–22 MHz (Fig. 1). For a deeper reflector at ~12 µs, the spectral content shrinks further to 15–19 MHz (Fig. 2). In the anomalous basal‐reflection zone identified by MARSIS (Fig. 3), the echo power is restricted to a narrow low‑frequency band (15–18 MHz) with time delay reaching ~17 µs. In comparison, the basal power with a similar time delay (~17 µs) in Gemina Lingula is distributed among a wider band (15-21 MHz).
The surface echo occupies almost the entire bandwidth with a monotonic decline in amplitude with increasing frequency. In contrast, basal echoes, particularly those from greater depths, exhibit a steep drop in the first few megahertz, followed by a plateau or even a slight rebound. This plateau/rebound is indicative of background noise dominance at those frequencies.
Across all datasets examined, the contrast between surface and basal power spectra suggests that the basal/surface power ratio diminishes with increasing time delay. Such behavior can be attributed to signal attenuation during propagation through the subsurface layer (SPLD). Dust impurities embedded in the ice result in a frequency‑dependent loss (Lauro et al., 2022), and roughness on discontinuities detected by SHARAD may further contribute to this effect.
- Conclusions
The STFT analysis provides another view on frequency-dependent attenuation of subsurface echoes, revealing that the higher-frequency components are attenuated and masked by background noise as depth increases. It is questionable if the suppressed band contributes to the echo power observed in the full-band radargram. More delicate sub-band splitting is required to answer this question, which might help to estimate the attenuation more accurately.
Reference
Bierson, C. J., et al. (2021). Geophysical Research Letters, 48(13), e2021GL093880.
Cosciotti, B., et al. (2023). Journal of Geophysical Research: Planets, 128(3).
Croci, R., et al. (2011). Proceedings of the IEEE, 99(5), 794-807.
Fois, F., et al. (2007, July). In 2007 IEEE International Geoscience and Remote Sensing Symposium (pp. 2134-2139). IEEE.
Lalich, D. E., et al. (2024). Science Advances, 10(23), eadj9546.
Lauro, S. E., et al. (2021). Nature Astronomy, 5(1), 63–70.
Lauro, S. E., et al. (2022). Nature Communications, 13(1), 5686.
Mattei, E., et al. (2022). Earth and Planetary Science Letters, 579, 117370.
Orosei, R., et al. (2018). Science. https://doi.org/10.1126/science.aar7268
Smith, I. B., et al. (2021). Geophysical Research Letters, 48(15).
Stillman, D. E., et al. (2022). Journal of Geophysical Research: Planets, 127(10).
Morgan, G. A., et al. (2025). Geophysical Research Letters, 52(22), e2025GL118537.
How to cite: Hong, T., Lauro, S. E., and Pettinelli, E.: Frequency distribution of basal echo power collected by the SHARAD radar in Ultimi Scopuli, Mars and its implications, Europlanet Science Congress 2026, The Hague, The Netherlands, 7–11 Sep 2026, EPSC2026-291, https://doi.org/10.5194/epsc2026-291, 2026.


