MITM9 | (Sub)surface investigations of planetary/small bodies

MITM9

(Sub)surface investigations of planetary/small bodies
Convener: Linus Stoeckli | Co-conveners: Yookyung Ha, Valentin Meier
Orals FRI3
| Fri, 11 Sep, 14:00–15:30 (CEST)|Room Earth (Tango 1)
Posters THU-POS
| Attendance Thu, 10 Sep, 18:00–19:30 (CEST) | Display Thu, 10 Sep, 08:30–19:30|Foyer 3, F3.41–42
Fri, 14:00
Thu, 18:00
The exploration of the surface and subsurface structure of planetary bodies is of utmost importance for reconstructing their formation and evolution processes. The goal of this session is to bring together scientists, mission and instrumentation developers and the observation community to discuss past, current or future investigations in this field.

We welcome contributions employing radar-based or spectroscopic techniques, including ground-penetrating radar, THz spectroscopy and related active or passive sensing methods to probe shallow to deep subsurface layers. Studies may address laboratory measurements, analogue studies, field campaigns, numerical modeling, instrument development, and data analysis from space missions, landed platforms, or remote observations.

Topics may include, but are not limited to: characterization of subsurface stratigraphy and heterogeneity, detection of volatiles, ice (cryosphere) and organic materials, porosity studies, and regolith studies of planets and small bodies such as asteroids, comets or moons.

Orals: Fri, 11 Sep, 14:00–15:30 | Room Earth (Tango 1)

Chairpersons: Linus Stoeckli, Yookyung Ha, Valentin Meier
Time Domain Raman Spectroscopy
14:00–14:15
|
EPSC2026-803
|
ECP
|
On-site presentation
Yookyung Ha, Emma Kinne, Jonas Woeste, Dominic Azih, Bruno Broer, Sergey G. Pavlov, Nikola Stojanovic, and Michael Gensch

Raman spectroscopy is an established technique for identifying planetary materials through their unique vibrational fingerprints, which also reveal information about their structure and composition [1]. Accordingly, Raman instruments have been proposed for space missions [2-4] and are by now operational, e.g., on the Perseverance rover [5]. With the advent of space-qualified femtosecond lasers [6, 7], techniques such as Time-Domain Raman spectroscopy (TDRS) and Rotational Coherent Raman Scattering (RCRS) have become viable alternatives to detect the Raman-active vibrational fingerprints of solids and gases in space applications. Since these techniques can intrinsically be much more compact, robust, and performant (e.g., because they are not affected by photoluminescence or background illumination), their merits will be discussed in this contribution.

In TDRS, ultrafast lasers with pulse durations shorter than the phonon period are used to excite coherent lattice vibrations. Coherent phonons subsequently induce measurable changes in the optical properties of the sample, which are probed subsequently by probe laser pulses in the femtosecond time-domain. In this work, we show that, for different planetary-relevant materials, the Raman-active fingerprints can be detected in transmission, reflection, or scattering geometries (see Figure 1).

In RCRS, one utilizes the fact that ultrashort pulses can excite coherent rotational wavepackets of molecules. The RCRS response manifests as periodic bursts called “rotational revivals.” As revivals have periodicities that depend on the molecular constant B, the excited molecules can be clearly identified. In this work, with essentially the same instrumentation as TDRS, we demonstrate that N2 and O2 in air at 295 K and 1 bar can be easily detected in good agreement with simulations [8] (Figure 2).  

As a result of our work, we envision a novel instrument design that enables the detection of Raman-active fingerprints of planetary materials and atmospheres based on a single ultra-compact femtosecond laser [9].

Figure 1. TDRS measurement on α-Quartz. (a) Time-domain changes with isotropic detection in the top panel. (b) Time-domain changes with anisotropic detection in the top. In both figures, the bottom panel shows the corresponding Fourier transform of the time-domain signal with the expected Raman modes marked with an asterisk (*).


Figure 2. RCRS measurement in laboratory air at 295 K and 1 bar. Experimental time-domain signal showing rotational revivals of N2 and O2 compared to the simulations (top panel). Corresponding Fourier transformation with rotational level transitions of N2 and O2, shown in green and orange vertical lines, respectively.

References   

[1] J. Blacksberg, G. Rossman, and A. Gleckler, "Time-resolved Raman spectroscopy for in situ planetary mineralogy", Applied Optics 49, 4951-4962 (2010).

[2] F. Rull, S. Maurice, I. Hutchinson et. al., "The Raman laser spectrometer for the ExoMars rover mission to Mars", Astrobiology, 17, 627–654 (2017).

[3] Y. Cho, U. Böttger, F. Rull et. al., "In situ science on Phobos with the Raman spectrometer for MMX (RAX): preliminary design and feasibility of Raman measurements", Earth Planets Space, 73, 232 (2021).

[4] E.A. Cloutis, C. Caudill, E.A. Lalla et. al., "LunaR: Overview of a versatile Raman spectrometer for lunar exploration", Frontiers in Astronomy and Space Sciences, 9, 1016359 (2022).

[5] R. Bhartia, L. W. Beegle, L. DeFlores, et al., “Perseverance’s Scanning Habitable Environments with Raman and Luminescence for Organics and Chemicals (SHERLOC) Investigation”, Space Science Reviews 217, 58 (2021).

[6] J. Lee, K. Lee, Y.S. Jang et. al., "Testing of a femtosecond pulse laser in outer space", Scientific Reports, 4, 5134 (2014).

[7] M. Lezius, T. Wilken, C. Deutsch et. al., "Space-borne frequency comb metrology", Optica, 3, 1381 (2016).

[8] T. Szidarovszky, M. Jono, K. Yamanouchi, “LIMAO: Cross-platform software for simulating laser-induced alignment and orientation dynamics of linear-, symmetric- and asymmetric tops”, In: Computer Physics Communications 228, pp. 219–228 (2018).

[9] Y. Ha, S.G. Pavlov, G. Rabasovic et. al., "Time-Domain Raman Spectroscopy: An Emerging Technique in Space Exploration?", Journal of Raman Spectroscopy, 56, 9 (2025).

How to cite: Ha, Y., Kinne, E., Woeste, J., Azih, D., Broer, B., Pavlov, S. G., Stojanovic, N., and Gensch, M.: Time-Domain Raman Spectroscopy for Space Exploration, Europlanet Science Congress 2026, The Hague, The Netherlands, 7–11 Sep 2026, EPSC2026-803, https://doi.org/10.5194/epsc2026-803, 2026.

THz Time Domain Spectroscopy
14:15–14:30
|
EPSC2026-222
|
ECP
|
On-site presentation
Valentin Meier, Arnaud Demion, Marc Nicollerat, Joseph Moerschell, Linus Stöckli, and Nicolas Thomas
Terahertz time-domain spectroscopy (THz-TDS) enables non-destructive in-situ analysis of subsurface cometary materials. Due to its short wavelengths spanning from 0.03mm to 3mm, THz-TDS can achieve significantly higher spatial resolution than conventional techniques like ground penetrating radar, at the cost of a reduced penetration depth in the centimetre-scale. When deployed in a borehole, such technique enables high resolution access to cometary layers that have undergone minimal thermal processing since the formation of the Solar System.
 
Standard THz-TDS setups rely on a focused beam, which can reach a sub-millimetre resolution on the focal plane to the detriment of the resolution in the out-of-focus areas. In the context of cometary soil analysis, the resolution must be preserved throughout the full penetration depth. However, maintaining optimal lateral resolution throughout a thick sample typically requires refocusing the beam at different depth, leading to an increase of acquisition time, data volume and system complexity. Instead, we considered the use of a collimated beam  to approach depth-invariant resolution in a single measurement.
 
A key limitation arises from Gaussian beam propagation: reducing the beam waist improves spatial resolution but intrisincally increases beam divergence, while minimizing divergence and approaching a perfectly collimated beam leads to a larger beam waist and therefore poorer lateral resolution. This fundamental trade-off limits the ability of THz-TDS systems to probe deeper into samples while preserving resolution. 
 
Our results show that optimized beam collimation of a pulse with a main frequency of 1 THz preserves sub-2mm lateral resolution over 3cm depth, significantly increasing the usable depth range compared with conventional THz-TDS systems.

How to cite: Meier, V., Demion, A., Nicollerat, M., Moerschell, J., Stöckli, L., and Thomas, N.: Optimizing collimated THz-TDS beam propagation for centimeter scale probing with millimetric  lateral resolution, Europlanet Science Congress 2026, The Hague, The Netherlands, 7–11 Sep 2026, EPSC2026-222, https://doi.org/10.5194/epsc2026-222, 2026.

14:30–14:42
|
EPSC2026-667
|
ECP
|
On-site presentation
Linus Stoeckli, Hervé Girard, Rafael Ottersberg, Dominik Belousov, Arnaud Demion, Antoine Pommerol, Marc Nicollerat, Valentin Meier, Joseph Moerschell, Axel Murk, and Nicolas Thomas

Context: Comets preserve primordial material essential for understanding planetesimal formation. However, characterizing their internal structure remains a challenge: infrared spectroscopy offers high spatial resolution but lacks penetration, while ground-penetrating radar penetrates deeply into the interior but suffers from meter-scale wavelength limitations. We propose Terahertz time-domain spectroscopy (THz-TDS) as a novel intermediate technique capable of centimeter-scale penetration with sub-centimeter-scale resolution.

Methods: We developed COCoNuT (Characteristic Observation of Cometary Nuclei using THz-spectroscopy), a laboratory facility integrating a commercial THz time-domain spectrometer within a controlled thermal-vacuum environment. Using cometary analog materials, we simulated realistic surface and subsurface conditions to evaluate penetration depth and spatial resolution.

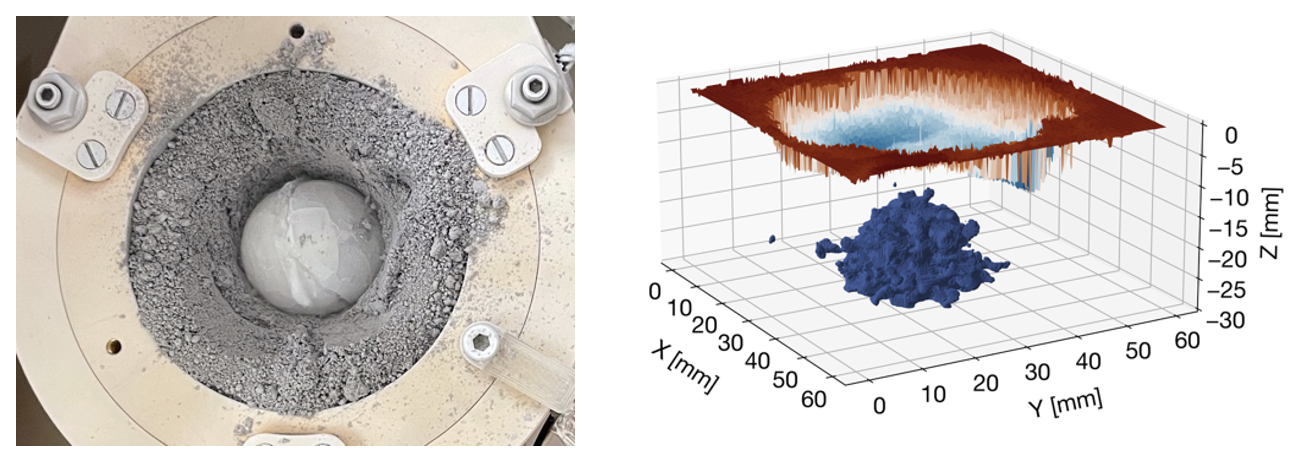
Results: Our proof-of-concept experiments demonstrate that THz-TDS successfully resolves embedded structural heterogeneities, specifically icy pebbles, which are inaccessible to current radar or infrared systems. Figure 1 illustrates the successful reconstruction of an ice pebble buried in a cometary dust analogue, validating the technique's ability to map subsurface morphology.

Conclusions: THz-TDS represents a powerful complementary tool for future in-situ space missions. By bridging the gap between surface spectroscopy and deep-penetration radar, this technology offers a pathway to revolutionize the characterization of small body interiors, providing critical constraints on planetary growth models ranging from hierarchical accretion to pebble-based formation scenarios.

How to cite: Stoeckli, L., Girard, H., Ottersberg, R., Belousov, D., Demion, A., Pommerol, A., Nicollerat, M., Meier, V., Moerschell, J., Murk, A., and Thomas, N.: In-situ THz Spectroscopy: Resolving Sub-surface Icy Pebbles on Cometary Nuclei, Europlanet Science Congress 2026, The Hague, The Netherlands, 7–11 Sep 2026, EPSC2026-667, https://doi.org/10.5194/epsc2026-667, 2026.

Radar Exploration
14:42–14:54
|
EPSC2026-988
|
ECP
|
On-site presentation
Émile Brighi, Valérie Ciarletti, Alice Le Gall, Yann Hervé, Wolf-Stefan Benedix, Dirk Plettemeier, Esther Mas I Sanz, Aleksey Shestov, Lucy Harrar, and Nicolas Oudart

 Introduction

The ExoMars 2028 Rosalind Franklin rover mission [1] is carrying onboard the Full Polarimetric Ground Penetrating Radar (FP-GPR) WISDOM (Water Ice Subsurface Deposits Observation of Mars) [2]. WISDOM will be the second FP-GPR to operate on the Martian surface, after the RoPeR/Tianwen-1 GPR [3] which has operated all along the Zhurong rover track in 2021.

WISDOM has shown unprecedented penetration depth in dry frozen environment during a field-test campaign in Svalbard; more than 15 meters in glacier ice, and more than 7 meters deep in lithic sedimentary material [4,5,6], which is truly promising for geological investigation of Oxia Planum, the ExoMars 2028 landing site. The dataset collected above a well-documented ice cave in Longyearbreen glacier [7] provides a valuable resource for testing WISDOM polarimetric capabilities in natural environment with varied polarimetric signatures.

Methodology

Polarimetric data representation

Both the transmitting (Tx) and receiving (Rx) antennas of WISDOM are made of two perpendicular radiating elements [8] labeled 0 and 1 on Fig. 1a. WISDOM is able to perform measurements in four linear polarimetric configurations involving one TX antenna and one RX antenna (two co-polarization and two cross-polarization) labeled 00, 11, 01 and 10.

To visualize the contributions of all polarizations simultaneously, we encoded them using Red (configuration 00), Green (configuration 11), and Blue (average cross-polarization configuration) channels and combined through additive synthesis (RGB additive synthesis - Fig. 1a) to produce false-color images. The resulting color are associated with specific scattering mechanisms detailed in Fig. 1b. The colored data product resulting from this process are called RGB-radargrams.

Polarimetric data representation

Both the transmitting (Tx) and receiving (Rx) antennas of WISDOM are made of two perpendicular radiating elements [8] labeled 0 and 1 on Fig. 1a. WISDOM is able to perform measurements in four linear polarimetric configurations involving one TX antenna and one RX antenna (two co-polarization and two cross-polarization) labeled 00, 11, 01 and 10.

To visualize the contributions of all polarizations simultaneously, we encoded them using Red (configuration 00), Green (configuration 11), and Blue (average cross-polarization configuration) channels and combined through additive synthesis (RGB additive synthesis - Fig. 1a) to produce false-color images. The resulting color are associated with specific scattering mechanisms detailed in Fig. 1b. The colored data product resulting from this process are called RGB-radargrams.

Figure 1: a) WISDOM polarimetric antenna onboard Rosalind Franklin rover. The two orthogonal radiating elements are labeled "0" and "1". Combination of these two linear polarimetric configuration allows to perform measurement in 4 polarization configuration labeled “00”, “11”, “01” and “10”, which are associated to color red, green and blue and merged in the same image following additive synthesis principle. Extracted and modified from [10] b) The resulting gamut of colors after additive synthesis reveals different scattering mechanisms.

Ice cave dataset

The Longyearbreen Glacier is located 5 km southwest of the University Center in Svalbard (UNIS) of Longyearbyen city. The investigated ice cave is part of a large englacial drainage system located near the steep western slope of the mountain (Fig. 3a). It was explored in-depth in spring of 2015 combining GPR (25 MHz and 100 MHz) and speleological survey [7]. We also explored the cave in detail at the location of the WISDOM survey (Fig. 2) in March 2022. The ice cave presents different feature ; (i) the meanders are various is size and shape, (ii) sedimentary rocks are embedded in the ice (Fig. 2c), (iii) water ice stalactites are growing from the ceiling (Fig. 2d) and (iv) Fresh pure water ice, recently frozen, covers floors made of sedimentary materials (Fig. 2b). Liquid water is also suspected to be present under the cave floor. We also determined the location of the meander of the cave, providing an extensive 3D ground truth to be compared with the interpretation of WISDOM radargrams.

The WISDOM survey consisted in a grid made of four lines represented on Fig. 2a and 3b-c, several meters away from the cave entrance (Fig. 2a and 3). WISDOM profiles are performed with a 10 cm step between consecutive soundings.


Figure 2: a) Location of the WISDOM survey above the ice cave of Longyearbreen glacier, and cave entrance. b) speleological survey of the investigated area. c) Sediments embedded in the glacier. d) Water ice stalactite and fresh water ice covering sedimentary rocks.

Results

The RGB-radargrams corresponding to the four WISDOM profiles (Fig. 3b) are shown on Fig. 3c. The different colors reveal varied scattering mechanism that are explored in-depth by [6]. The snow layering and snow/ice interface appear in yellow (Fig. 3c), suggesting large smooth interfaces. The spatially extended reflections associated to the ice cave itself appear in many different colors, including depolarization (blue, cyan, magenta, white), interpreted as multiple reflections in the large cavity (Fig. 3c). In some places, yellow reflection is associated to simple reflections of smooth sections of the ceiling of the cave. We also use the specificity of WISDOM antenna radiation patterns (Fig.1a) and colored RGB-radargrams to determine whether a scatterer detected in a radargram is located on the left (red-green), on the right (green-red), or below the rover's track (yellow). This is compared to actual 3D position of the scatterer and show promising results.


Figure 3: a) Location of the cave entrance on the Longyearbreen glacier. b) The four WISDOM profiles and the estimated meanders of the ice cave in the subsurface. Background map credit: Norwegian Polar Institute. c) 3D representation of WISDOM RGB-radargrams corresponding to profiles 1-3.


References

[1] Vago et al., 2017, Astrobiology

[2] Ciarletti et al., 2017, Astrobiology

[3] Zhou et al., 2020, Earth and Planetary Physics

[4] Brighi, 2024, PhD thesis

[5] Brighi et al., 2025, IEEE

[6] Brighi et al., under review, Geophysics

[7] Hansen et al., 2020, Journal of Glaciology

[8] Benedix et al., 2024, Planetary and Space Science

[9] Plettemeier et al., 2017, European Planetary Science Congress 2017

[10] Harrar et al., 2026, European Planetary Science Congress 2026

How to cite: Brighi, É., Ciarletti, V., Le Gall, A., Hervé, Y., Benedix, W.-S., Plettemeier, D., Mas I Sanz, E., Shestov, A., Harrar, L., and Oudart, N.: Full-Polarimetric capabilities evaluation of the ExoMars 2028 GPR on a 3D dataset acquired in Svalbard, Europlanet Science Congress 2026, The Hague, The Netherlands, 7–11 Sep 2026, EPSC2026-988, https://doi.org/10.5194/epsc2026-988, 2026.

14:54–15:06
|
EPSC2026-738
|
ECP
|
On-site presentation
Thorsteinn Kristinsson, Sean Peters, Joana R.C. Voigt, Gregor Steinbrugge, Christopher W. Hamilton, Serina Diniega, Jonathan Williams, and Andrew Romero-Wolf

Recent work has shown the potential for passive sounding to increase the science return for radar investigations of the icy satellites of Jupiter in a noisy sub-Jovian environment. For example, Schroeder et al. analyzed the active radar link budget during Jovian burst activity (which can exceed the background noise environment by several orders of magnitude) and showed that strong Jovian Decametric radio bursts could severely degrade the detectability of surface and subsurface radar returns [1,2]. Gerekos et al. simulated radargrams for the icy moons of Jupiter and found that active radar sounding was unable to reveal surface features for key target areas in the presence of noise at the expected Jovian burst flux densities, whereas passive radar processing was still able to recover the surface reflections using both modeled and observed Jovian noise signals [3]. Peters et al. further demonstrated the potential for passive synthetic aperture radar (SAR) imaging using radio-astronomical sources to recover surface topography [4]. The Radar for Icy Moon Exploration (RIME) or Radar for Europa Assessment and Sounding: Ocean to Near- surface (REASON) could be potential candidates for the addition of a passive sounding mode that complements active radar techniques in the presence of strong Jovian Decametric radio bursts [1,2]; however, this proposed technique had never been experimentally demonstrated. 

Astronomical radio sources have been tested on Earth as sources for sounding and echo detection using the passive radar approach, by using the quiescent solar emissions in VHF (300 MHz) [5] as well as Jovian radio bursts in the HF band (25MHz) [6].  These sources are one of the strongest in the sky in their respective bands. The Sun’s flux increases with frequency following blackbody radiation curve and approaches the magnitude of the diffused galactic background around 300MHz [5]. The Jovian bursts however are mainly due to the interaction of Jupiter’s magnetosphere and Io‘s magnetic field, which creates a strong radio burst centered around 25MHz [7]. While this mechanism indicates that Jovian bursts are not continuous like solar emissions, they are predictable based on 26 years of observations. Recent work has shown that there exists a clear combination pattern of Io’s phase and Jupiter’s system III central meridian longitude (CML) facing observer, which offers a way to forecast opportunity windows of highest burst probability and activity [8].

The Passive Autonomy, Navigation, Topography, and Habitability Exploration Radar (PANTHER) project utilizes both sources by capturing their emissions using the Ettus X310 + TwinRX software defined radio (SDR). The wide instantaneous bandwidth and usable range of receiver center frequencies allows us to rapidly test both passive sounding configurations. In the spring of 2025, the PANTHER team went to the hills of Dante’s view to experimentally demonstrate the predictability of Jovian bursts using the hardware mentioned prior to it being integrated and operated off AC powered power station. The results showed a significant increase across the received power spectrum (15-35MHz) during the predicted Jovian burst activity window, and the autocorrelation of the received signals showed a strong echo peak in the range profile. This result served as the first experimental demonstration of using the Jovian radio burst as a predictable illumination source in HF band [6] 

The PANTHER team has now scheduled its first extensive field-testing campaign during the summer 2026 in the Icelandic volcanic and glacier environment, which will focus on the radar sounding of buried ice [9], glacier structures [10], in addition to water lava contacts at the Holuhraun lava flow [11].  At these field sites, passive sounding using radio-astronomical sources will be tested, as well as validated with a commercial GPR, to identify the technique’s limits and potential for future applications. Passive sounding is a promising approach for geological monitoring on Earth and in future planetary exploration missions.

Acknowledgments: The PANTHER project was funded by the National Aeronautics and Space Administration (NASA) through PSTAR grant No. 80NSSC24K1261. A portion of this research was carried out at the Jet Propulsion Laboratory, California Institute of Technology, under a contract with NASA.

[1] D. M. Schroeder et al., Planetary and Space Science, 2016
[2] A. Romero-Wolf et al., Icarus, 2015
[3] C. Gerekos et al., IEEE Transactions on Geoscience and Remote Sensing, 2020
[4] S. T. Peters et al., IEEE Transactions on Geoscience and Remote Sensing, 2021
[5] S. T. Peters et al., IEEE Transactions on Geoscience and Remote Sensing, 2018
[6] T. H. Kristinsson et al., EGU General Assembly 2026
[7] P. Zarka et al., Journal of Geophysical Research (Space Physics), 2004
[8] M. S. Marques et al., AA, 2017
[9] E. S. Shoemaker Thackston et al., Journal of Geophysical Research: Planets, 2024
[10] H. Björnsson H, Annals of Glaciology. 2020
[11] C. M. Dundas et al., Journal of Volcanology and Geothermal Research, 2020

How to cite: Kristinsson, T., Peters, S., Voigt, J. R. C., Steinbrugge, G., Hamilton, C. W., Diniega, S., Williams, J., and Romero-Wolf, A.:  PANTHER – Utilizing Astronomical Radio Sources for passive echo detection and sounding, Europlanet Science Congress 2026, The Hague, The Netherlands, 7–11 Sep 2026, EPSC2026-738, https://doi.org/10.5194/epsc2026-738, 2026.

15:06–15:18
|
EPSC2026-291
|
ECP
|
On-site presentation
Tiansheng Hong, Sebastian Emanuel Lauro, and Elena Pettinelli
  • Introduction

Ultimi Scopuli is one of the most intriguing regions on Mars, where anomalously bright basal reflectors beneath a ~1.5 km thick ice sheet have been detected by MARSIS and interpreted as subglacial liquid-water bodies (Orosei et al., 2018; Lauro et al., 2021). Due to the ongoing debate surrounding the liquid water lake hypothesis (Cosciotti et al., 2023; Mattei et al., 2022; Stillman et al., 2022), as well as alternative interpretations (Bierson et al., 2021; Smith et al., 2021; Lalich et al., 2024), recent SHARAD observations acquired with the Very-Large-Roll configurations (VLR2 and VLR4) have focused on this region. In particular, the new VLR4 observation (ID: 8827401) revealed a basal reflector at the same location and depth as previously detected by MARSIS (Morgan et al., 2025).

Furthermore, splitting the SHARAD frequency band into high- and low-frequency sub-bands showed that the basal reflectors are detectable only in the low-frequency sub-band. In the high-frequency sub-band, the basal reflections are suppressed by background noise or by strong volume scattering (“fog”). This behavior suggests that the frequency distribution of basal echo power may play a crucial role in constraining the physical properties of the penetrated materials.

Building on this observation, we investigate the frequency distribution of basal echo power by analyzing several SHARAD observations collected over Ultimi Scopuli using the Short-Time Fourier Transform (STFT). The analysis focuses on the depth dependence of the basal reflectors, with the aim of identifying variations in the basal echo power distribution as a function of time delay and estimating radar attenuation. Radar attenuation is a key parameter for determining the permittivity of basal materials based on the intensity of the basal reflections (Lauro et al., 2022).


  • Methods

We applied a processing chain distinct from the standard RDR format (Fois et al., 2007) to probe the frequency distribution of subsurface reflectors as a function of depth across various areas within Ultimi Scopuli. Beginning with the raw EDR data, we first performed range‑compression using the reference chirp (Croci et al., 2011). To mitigate strong electromagnetic interference (EMI) that appears at particular frequencies, we averaged the spectra over 40 azimuth samples. This spectral averaging can substantially increase the signal‑to‑noise ratio by >10 dB and reveal subsurface reflectors that are not discernible with simple range compression.

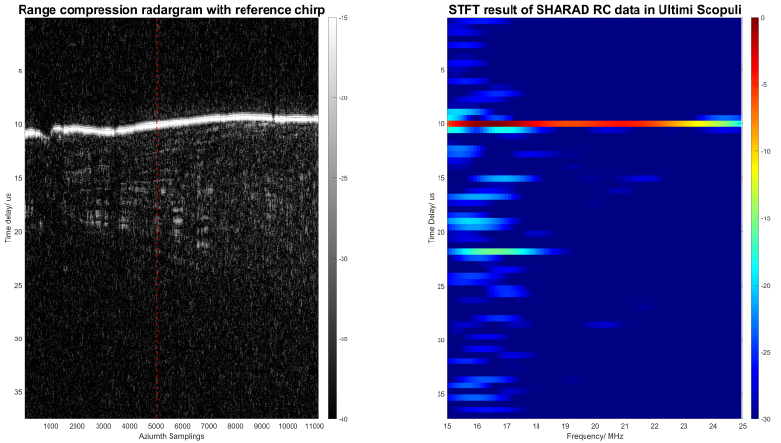
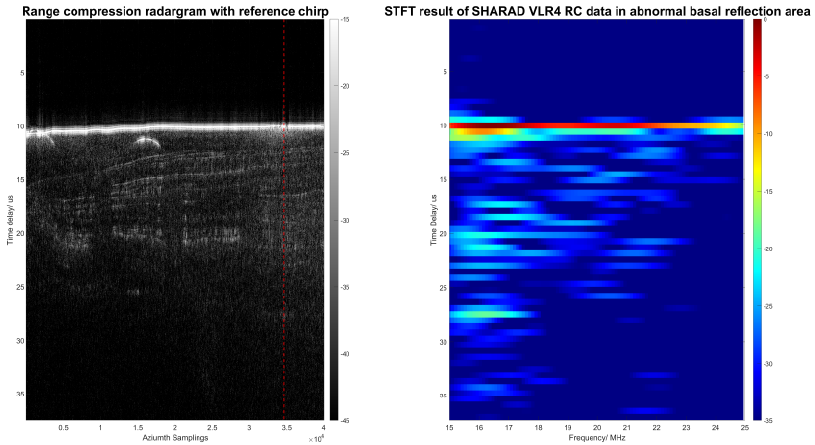
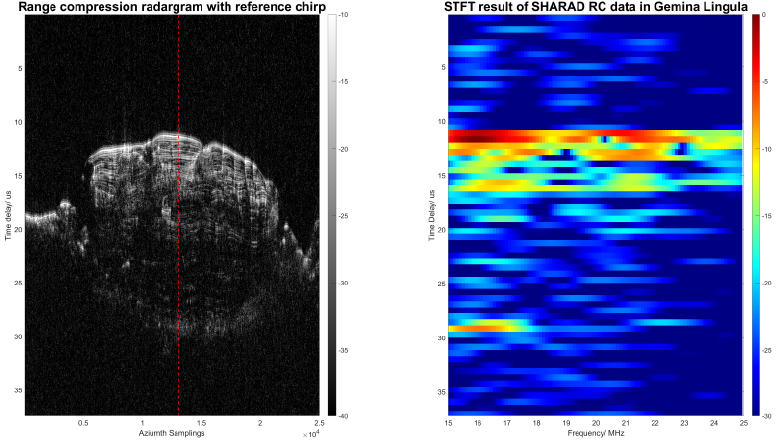
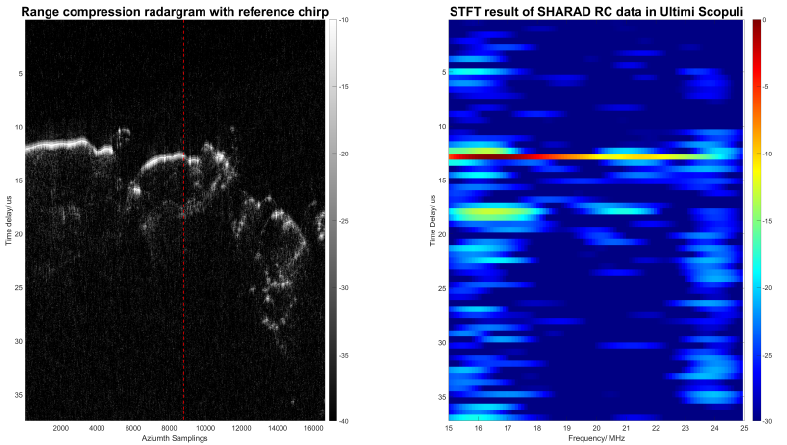
After range compression and spectral averaging, the data with basal reflectors were processed with STFT. The resulting STFT images and corresponding radargrams are presented in Figures 1–4.

Figure 1. (Left panel) The SHARAD range-compressed radargram collected at the edge of Ultimi Scopuli. (Right panel) The STFT result of the range-compressed data marked in the left panel, in which the basal echo is located at t=~18 us.

Figure 2. (Left panel) The SHARAD range-compressed radargram collected in Ultimi Scopuli. (Right panel) The STFT result of the range-compressed data marked in the left panel, in which the basal echo is located at t=~22 us.

Figure 3. (Left panel) The VLR4 SHARAD range-compressed radargram collected in the abnormal basal reflection area, Ultimi Scopuli. (Right panel) The STFT result of the range-compressed data marked in the left panel, in which the basal echo is located at t=~27.5 us.

Figure 4. (Left panel) The SHARAD range-compressed radargram collected in Gemina Lingula. (Right panel) The STFT result of the range-compressed data marked in the left panel, in which the basal echo is located at t=~29 us.


  • Results

The Short‑Time-Fourier-Transform (STFT) analysis shows that the frequency content of subsurface reflectors changes systematically with depth. At the periphery of Ultimi Scopuli, the basal echo occurring ~5 µs after the surface is confined to 15–22 MHz (Fig. 1). For a deeper reflector at ~12 µs, the spectral content shrinks further to 15–19 MHz (Fig. 2). In the anomalous basal‐reflection zone identified by MARSIS (Fig. 3), the echo power is restricted to a narrow low‑frequency band (15–18 MHz) with time delay reaching ~17 µs. In comparison, the basal power with a similar time delay (~17 µs) in Gemina Lingula is distributed among a wider band (15-21 MHz).

The surface echo occupies almost the entire bandwidth with a monotonic decline in amplitude with increasing frequency. In contrast, basal echoes, particularly those from greater depths, exhibit a steep drop in the first few megahertz, followed by a plateau or even a slight rebound. This plateau/rebound is indicative of background noise dominance at those frequencies.

Across all datasets examined, the contrast between surface and basal power spectra suggests that the basal/surface power ratio diminishes with increasing time delay. Such behavior can be attributed to signal attenuation during propagation through the subsurface layer (SPLD). Dust impurities embedded in the ice result in a frequency‑dependent loss (Lauro et al., 2022), and roughness on discontinuities detected by SHARAD may further contribute to this effect.


  • Conclusions

The STFT analysis provides another view on frequency-dependent attenuation of subsurface echoes, revealing that the higher-frequency components are attenuated and masked by background noise as depth increases. It is questionable if the suppressed band contributes to the echo power observed in the full-band radargram. More delicate sub-band splitting is required to answer this question, which might help to estimate the attenuation more accurately.


Reference

Bierson, C. J., et al. (2021). Geophysical Research Letters, 48(13), e2021GL093880.

Cosciotti, B., et al. (2023). Journal of Geophysical Research: Planets, 128(3).

Croci, R., et al. (2011). Proceedings of the IEEE99(5), 794-807.

Fois, F., et al. (2007, July). In 2007 IEEE International Geoscience and Remote Sensing Symposium (pp. 2134-2139). IEEE.

Lalich, D. E., et al. (2024). Science Advances, 10(23), eadj9546.

Lauro, S. E., et al. (2021). Nature Astronomy, 5(1), 63–70.

Lauro, S. E., et al. (2022). Nature Communications, 13(1), 5686.

Mattei, E., et al. (2022). Earth and Planetary Science Letters, 579, 117370.

Orosei, R., et al. (2018). Science. https://doi.org/10.1126/science.aar7268

Smith, I. B., et al. (2021). Geophysical Research Letters, 48(15).

Stillman, D. E., et al. (2022). Journal of Geophysical Research: Planets, 127(10).

Morgan, G. A., et al. (2025). Geophysical Research Letters52(22), e2025GL118537.

How to cite: Hong, T., Lauro, S. E., and Pettinelli, E.: Frequency distribution of basal echo power collected by the SHARAD radar in Ultimi Scopuli, Mars and its implications, Europlanet Science Congress 2026, The Hague, The Netherlands, 7–11 Sep 2026, EPSC2026-291, https://doi.org/10.5194/epsc2026-291, 2026.

15:18–15:30
|
EPSC2026-1141
|
ECP
|
On-site presentation
Elena Donini, Guilhem Mitton, and Francesca Bovolo

Characterizing the planetary subsurface through Radar Sounder (RS) data is fundamental to reconstructing the evolutionary history of the Solar System. However, the increasing volume of RS archives, which will be further expanded by upcoming and prospective missions to the Jovian and Uranian icy moons, necessitates a shift toward automated extraction methods. Although recent machine learning applications in RS stratigraphy have successfully automated the detection of isochronous layers, a significant methodological gap remains in detecting localized non-horizontal reflections. Features such as Martian troughs and Trough Migration Paths (TMPs) can serve as analogs for oblique geometries. Troughs are migratory valleys in the Martian North Polar Layered Deposit (NPLD), and their evolution provides a unique record of the history, including katabatic winds, sublimation, and cyclical climate forcing [1]. Their historical migration is encoded in the subsurface as Trough Migration Paths (TMPs), which are morpho-stratigraphic unconformities that truncate isochronous layers and track the trough floor over geological timescales [1]. While the joint analysis of high-resolution optical imagery (HiRISE/CTX) and RS (SHARAD) is essential for mapping these features [1], it relies heavily on manual tracing, which limits scalability.

We frame the detection of dipping targets considering troughs and TMPs as analogues in RS data as a semantic segmentation task stratigraphy). We introduce a two-stage deep learning strategy based on a physics-informed contrastive pre-training phase, followed by supervised fine-tuning that mitigates class imbalance between troughs, TMPs, and horizontal stratigraphy. For the pre-training stage, we utilize a Momentum Contrast (MoCo) framework. MoCo forces a network to learn discriminative feature representations by maximizing the similarity between distinct views of the same image [2]. However, rather than relying on computer vision augmentations, we leverage squinted Synthetic Aperture Radar (SAR) focusing to generate physically consistent views of the same subsurface at distinct squint angles [3]. This forces the network to learn latent structural representations that are strictly invariant to angle-dependent radiometry. This approach desensitizes the model to the overwhelmingly dominant horizontal stratigraphy of the Martian polar regions, enabling it to capture the dipping signatures of troughs and TMPs without human supervision. The model is fine-tuned on a limited set of labeled radargrams for trough and TMPs. To prevent the model from being biased by dominant horizontal stratigraphy, we use a weighted binary cross-entropy loss function. Finally, detected troughs and TMPs are georeferenced and integrated into an interactive geospatial interface. Beyond simply visualizing the regional distribution of troughs and TMPs, this interface facilitates the geomorphological analysis. The interface allows users to navigate to the original radargrams for detailed morphological analysis, including depth and steepness of the trough walls and the TMPs.

We consider SHARAD Experimental Data Record (EDR) radargrams acquired over the Martian NPLD (latitude > 77.5 N) between 2007 and 2021during solar occultation, yielding a set of 488 radargrams [4]. These were SAR-focused with 11 distinct squint angles that capture the diverse geometric slopes of the targets [3]. The data were partitioned into coregistered 11-channel patches (256×256 pixels) and standardized. The contrastive pre-training dataset comprises 1519 patches (split 70% for training, 15% for validation, and 15% for test). For the fine-tuning phase, experts annotated 50 radargrams (yielding 210 patches split 70% for training, 15% for validation, and 15% for test), cross-referencing with cluttergrams to decouple off-nadir clutter and subsurface reflections. 

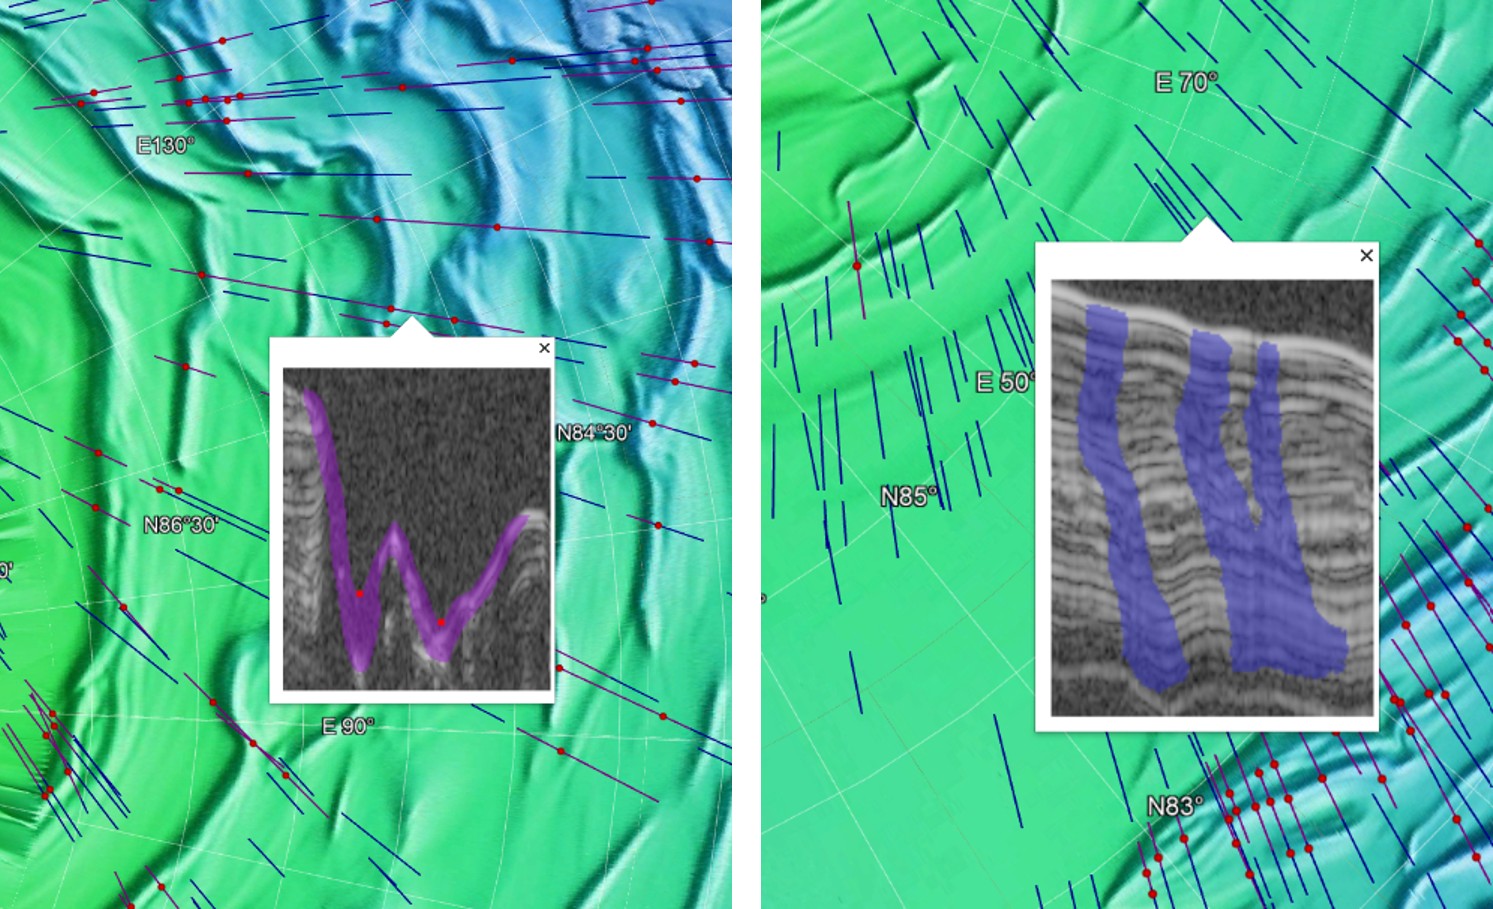
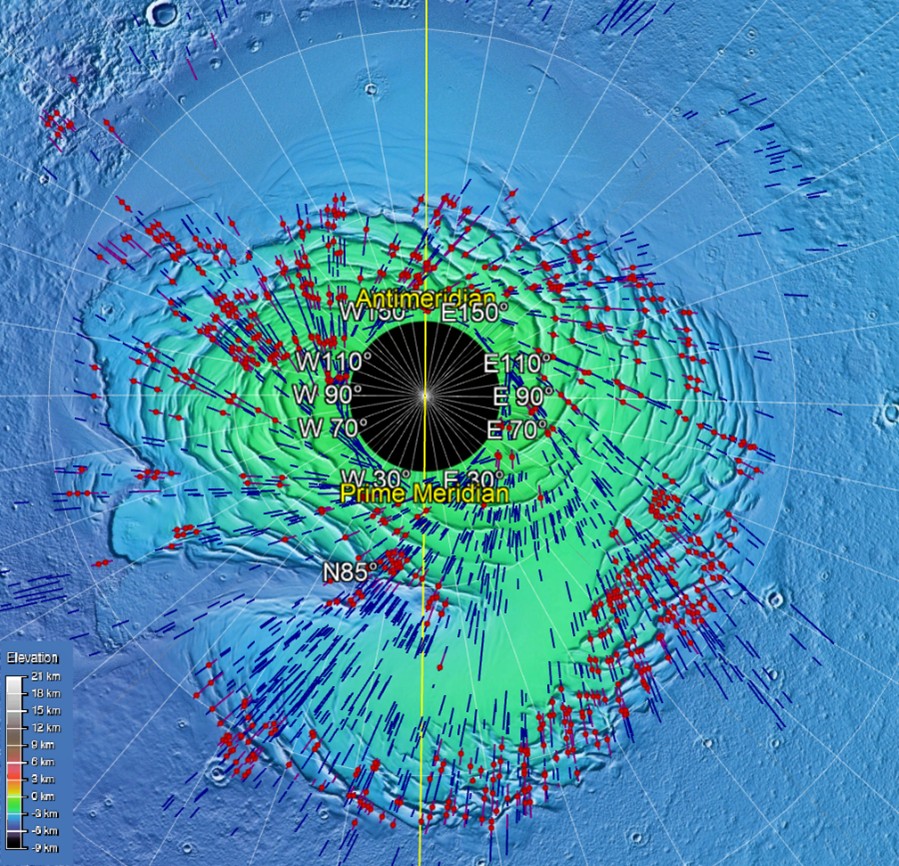
Applying the proposed deep learning method to the SHARAD dataset yielded an automated map of the Martian NPLD troughs and TMPs. The model successfully isolated the troughs and TMPs from the dominant background stratigraphy, automatically detecting more than 95% of them across the NPLD. Figure 1 displays the results projected onto a polar Digital Elevation Model (DEM), where blue tracks indicate the spatial extent of TMPs and red markers denote the troughs. The geographical distribution of troughs and TMPS over the NPLD aligns with the spiral pattern. The interactive geospatial interface links the regional map to radargrams (Figure 2). Selecting map features displays the corresponding radargrams overlaid with a segmentation map that delineates the V-shaped topography of the troughs (Figure 2, left) and the stratigraphic interruptions in the TMPs (Figure 2, right). The segmentation enables automated extraction of morphological metrics, such as average trough depth and wall steepness. The extracted values are consistent with measurements reported in the literature [1].

This work presents a dual-stage training methodology that leverages the physics of the dipping targets to map through and TMPS in RS data. We also deliver a geospatial interface that links the target's geographic position to the radargram. The methodology can be extended, with appropriate modifications, to map and characterize other geological dipping targets, including subsurface faults on Jovian or Uranian moons, providing a robust tool for investigating the cryotectonic evolution of icy satellites.


Figure 1: Map with the track of the radargram portions imaging TMPs in blue and the position of the deepest point of the troughs in red.


Figure 2: Example of trough (on the left) and TMPs (on the right) detected by the proposed method and visualized in the geospatial interface.


References

  • Smith, I. B., and J. W. Holt. "Onset and migration of spiral troughs on Mars revealed by orbital radar." Nature, 2010.
  • He, K., et al. "Momentum contrast for unsupervised visual representation learning." Proceedings of the IEEE/CVF conference on computer vision and pattern recognition. 2020.
  • Ferro, A. "Squinted SAR focusing for improving automatic radar sounder data analysis and enhancement." International Journal of Remote Sensing
  • Donini, E., et al. "Deep learning for unsupervised denoising of radar sounder data." IGARSS 2023-2023 IEEE International Geoscience and Remote Sensing Symposium.
  • Donini, E., F. Bovolo, and L. Bruzzone. "A deep learning architecture for semantic segmentation of radar sounder data." IEEE Transactions on Geoscience and Remote Sensing


How to cite: Donini, E., Mitton, G., and Bovolo, F.: A Deep Learning Method for Mapping Dipping Subsurface Features, Europlanet Science Congress 2026, The Hague, The Netherlands, 7–11 Sep 2026, EPSC2026-1141, https://doi.org/10.5194/epsc2026-1141, 2026.

Posters: Thu, 10 Sep, 18:00–19:30 | Foyer 3

Display time: Thu, 10 Sep, 08:30–19:30
Chairpersons: Linus Stoeckli, Yookyung Ha, Valentin Meier
F3.41
|
EPSC2026-762
|
On-site presentation
Michael Jenning, Sebastian Hegler, Ronny Hahnel, and Dirk Plettemeier

There are currently several missions in cruise phase and planned, operating a radar for sub-surface imaging to celestial bodies (e.g. RIME on JUICE or JURA on HERA/Juventas). With radars having a much wider field of view than e.g. Laser altimeters, reflections from the surface will be visible in recorded radargrams. Consequently, one objective is the separation of surface clutter from actual subsurface reflections. With the help of sufficiently good digital elevation models, it is possible to simulate clutter, which in turn can be subtracted from the recorded radargrams. Furthermore, reflections from the sub-surface can be simulated once objects are placed inside.

Due to the size of celestial bodies, commercially available full wave simulation tools are incapable of handling these scales. Furthermore, the detailed and broad capabilities of commercial simulation tools may also not be required to estimate the surface clutter. We therefore are developing in-house tools for the simulation of clutter or sub-surface reflections. Currently, two different tools are developed: one that is based on physical optics (PO) and a raytracer (RT). The main differences are the possibility of the PO to calculate surface currents, which can help to identify significant sources of surface clutter, and does conserve energy, which allows for link-budget estimation on the one hand and the ability of the RT to handle larger objects due to less information being calculated internally on the other hand.

Both tools are written in C++ and are highly optimized (AVX instructions, parallelization) to reduce simulation times. They are designed to handle triangulated surfaces to describe objects, handle multiple frequencies to reproduce the behavior and performance of the employed radars. Furthermore, full-wave simulations of frequency-dependent antenna characteristics when combined with the spacecraft can be used as transmit and receive antennas. Additional system characteristics can be included in post-processing as they don‘t influence the wave propagation. Actual or planned trajectories including attitude can be manually extracted from SPICE kernels and used as input for the simulation to accurately match mission trajectories. Since the simulation results resemble S11 data, they can be processed with the same algorithms as are used for mission data.

We have successfully validated the tools by estimating the Phobos flybys of MarsExpress, or calculating the descent scenario of the Philae lander of ESA‘s Rosetta mission (CONSERT experiment) and we are able to handle scenarios for RIME or even clutter simulations for RIMFAX, the ground penetrating radar onboard NASA‘s Mars2020 Perseverance rover. Furthermore, we were also able to reproduce the data that was published by ESA for the JUICE lunar-earth gravity assist in August 2024. Simulations of the scenario of the JuRa (HERA Juventas Radar) can be used to develop tools for the reconstruction of the surface of Dimorphos and potentially its inner structure.

Limitations are given by the availability of accurate models and their level of detail. During mission planning, the simulation tools can be used to estimate the link budget and performance of the radar based on assumptions. During the mission phase, measurements can be validated by comparing them with results from the tools by updating the models used.

How to cite: Jenning, M., Hegler, S., Hahnel, R., and Plettemeier, D.: Simulation Tools for Small Bodies and Planetary Radar Observation Scenarios, Europlanet Science Congress 2026, The Hague, The Netherlands, 7–11 Sep 2026, EPSC2026-762, https://doi.org/10.5194/epsc2026-762, 2026.

F3.42
|
EPSC2026-1045
|
ECP
|
On-site presentation
Dominic Azih, Bruno Broer, Yookyung Ha, Jonas Woeste, Emma Kinne, Sergey Pavlov, Oliver Gueckstock, Tom Seifert, Nikola Stojanovic, Tobias Kampfrath, and Michael Gensch

              Femtosecond lasers have in recent years been shown to be compact, robust and space qualified [1,2], thereby so called, time-domain spectroscopy (TDS) techniques, which allow to avoid complex detector systems and/or bulky opto-mechanics of conventional instruments such as Fourier-Transform Interferometers or grating spectrometers become viable options for more compact, energy/mass efficient and performant space instruments [3,4].  In this contribution we show how terahertz (THz) TDS emerges as an alternative to conventional infrared spectrometers in the spectral range of 10 – 1000 cm-1 (0.3 to 30 THz). Progress towards space qualification and chip integration is presented and future use cases such are THz TDS in attenuated total reflection (ATR) geometry are discussed.


Figure 1: Plot showing the evolution of solid-state laser systems since 1975 and their corresponding spectral bandwidth.

Figure 2:  Broadband spectrum of spintronic THz emitters

Figure 3: THz TDS in ATR geometry and schematic diagram of intergration of THz TDS for space exploration on fiber platform.


    References

[1] J. Lee, K. Lee, Y. Jang, et al. “Testing of a femtosecond pulse laser in outer space,” Scientific Reports 4, 5134, (2014).

[2] M. Lezius, T. Wilken, C. Deutsch, et al., “Space-borne frequency comb metrology,” Optica 3, 1381 (2016).

[3] O. Gueckstock, N. Stojanovic, Y. Ha, et al, “Radiation hardness of ultrabroadband spintronic terahertz emitters: En-route to a space-qualified terahertz time-domain gas spectrometer,” Applied Physics Letters 124, 141103 (2024).

[4] Y. Ha, S.G. Pavlov, M.D. Rabasovic, et al., “Time-Domain Raman Spectroscopy: An Emerging Technique in Space Exploration,” J. Raman Spectrosc. 56, 916 (2025).


How to cite: Azih, D., Broer, B., Ha, Y., Woeste, J., Kinne, E., Pavlov, S., Gueckstock, O., Seifert, T., Stojanovic, N., Kampfrath, T., and Gensch, M.: Ultra-Broadband Terahertz Time-Domain Sensing for Space Exploration, Europlanet Science Congress 2026, The Hague, The Netherlands, 7–11 Sep 2026, EPSC2026-1045, https://doi.org/10.5194/epsc2026-1045, 2026.