
 ,
,- Delft University of Technology, Aerospace Engineering, Planetary exploration, Utrecht, Netherlands (allardveenstra@hotmail.com)
Io’s widespread volcanic activity is driven by strong tidal heating within its interior [1]. The distribution of tidal heating within Io's interior is closely linked to the moon's thermal state and its evolution [2,3]. Yet, despite years of observations [4], where inside Io heat is being dissipated remains largely unknown. For example, it remains unclear whether an asthenosphere (a low-viscosity layer beneath the crust) exists [4].
Ground-based and space-borne observations provide a window into Io's interior. With the recent measurement of Io’s tidal Love number k2 [5], there are now four independent gravity observations: C20, C22, and both parts of k2 [5,6]. This makes Io, together with Titan [7], the outer solar system moon for which we have the most gravity observations. Furthermore, there is a large database of volcanic activity observations [e.g., 4], assumed to link more directly to Io's tidal heating pattern. In turn, the heating pattern is sensitive to Io’s interior radial rheology structure [2], complementing the tidal response observations. However, no comprehensive Bayesian inversion exists that incorporates both gravity and volcanic activity observations.
We investigate how combining all gravity observations and the observed volcanic heat flux constrains Io’s interior. As a measure of how Io’s heat output is distributed, we use the ratio of polar to equatorial heat flux. Our interior model consists of four layers: core, mantle, asthenosphere, and lithosphere, and we compute the tidal response using Andrade rheology [8]. We use a Markov Chain Monte Carlo approach to integrate all gravity observations and the observed heat flux ratio to constrain Io’s interior.
Different observables are sensitive to different interior parameters. The static gravity coefficients, C20 and C22, constrain the core density and radius, k2-measurements the effective rigidity and viscosity, and the heat flux ratio the radial viscosity profile. The latter requires the majority of the heating (>90%) to occur in a low viscosity asthenosphere (1013 Pa s), even with conservative assumptions on the distribution of Io’s unmeasured background heat flux.
We thus show that, within current observational limits, Io must have an asthenosphere where a significant amount of its heat is generated. The existence of an asthenosphere is in line with previous results [9] and also expected from melt advection models [e.g., 10]. While we used Andrade rheology, we find viscosities that imply melt fractions at the edge of what is considered solid [e.g., 11], raising questions about the validity of rheology models typically used to model tidal deformation in planetary objects. However, experimental work on anelastic deformation under Io-like conditions is likely needed to resolve this problem [8]. Finally, our study provides statistically consistent ranges for Io’s interior parameters, which could be used in future studies.
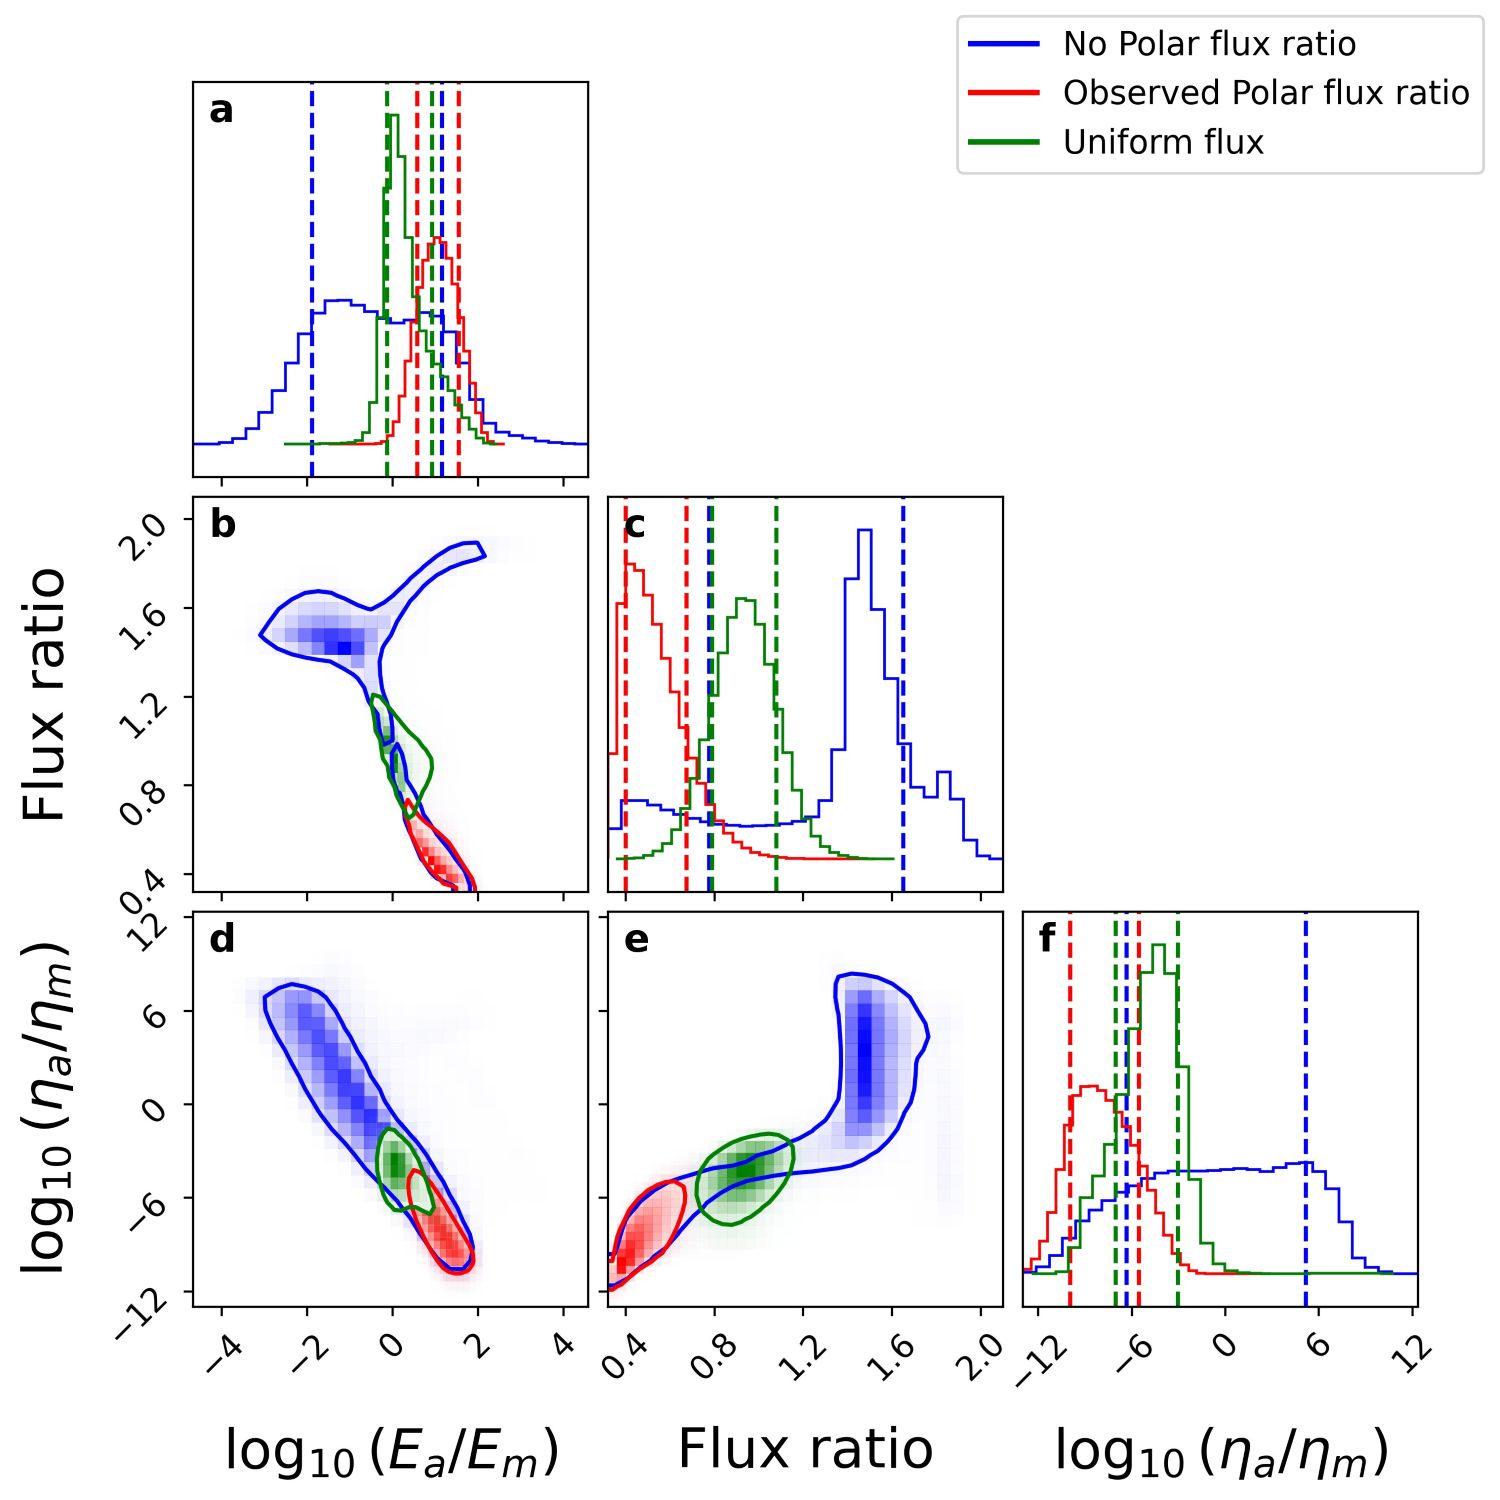
Figure 1. The posterior PDFs of the ratio between energy dissipation in the asthenosphere (Ea) and mantle (Em) (subplot a), the polar-to-equatorial heat flux ratio (subplot c), and the ratio between asthenosphere and mantle viscosity ηx (subplot f). The 2-dimensional PDFs, indicating the correlations between two parameters, are given in the off-diagonal subplots. The three cases, without the observed polar flux ratio as one of the observables (blue), with the observed ratio (red), and with a uniform flux ratio (green), are plotted on top of each other. The dotted lines in the histograms and the contours in the 2D PDFs contain 68.3% of the cases.
References
[1] Peale, S. J., Cassen, P., & Reynolds, R. T. 1979, Science, 203, 892
[2] Segatz, M., Spohn, T., Ross, M. N., & Schubert, G. 1988, Icarus, 75, 187
[3] Hussmann, H. & Spohn, T. 2004, Icarus, 171, 391
[4] Davies, A. G., Perry, J. E., Williams, D. A., Veeder, G. J., & Nelson, D. M. 2024, The Planetary Science Journal, 5, 121
[5] Park, R. S., Jacobson, R. A., Gomez Casajus, L., et al. 2025, Nature, 638, 69
[6] Lainey, V., Arlot, J.-E., Karatekin, ¨O., & van Hoolst, T. 2009, Nature, 459, 957
[7] Petricca, F., Vance, S. D., Parisi, M., et al. 2025, Nature, 648, 556
[8] Bierson, C. J. 2024, Icarus, 414, 116026
[9] Bierson, C. J. & Nimmo, F. 2016, Journal of Geophysical Research (Planets), 121, 2211
[10] Spencer, D. C., Katz, R. F., Hewitt, I. J., May, D. A., & Keszthelyi, L. P. 2020, Journal of Geophysical Research (Planets), 125, e06604
[11] Scott, T. & Kohlstedt, D. L. 2006, Earth and Planetary Science Letters, 246, 177
How to cite: Veenstra, A., Rovira-Navarro, M., and van der Wal, W.: Inferring Io’s Internal Properties by Combining Gravity Measurements and Volcanic Activity, Europlanet Science Congress 2026, The Hague, The Netherlands, 7–11 Sep 2026, EPSC2026-309, https://doi.org/10.5194/epsc2026-309, 2026.


