
 1,2,1,1,1,1,1,1,1,1,1
- 1Deutsches Zentrum für Luft- und Raumfahrt, Remote and In-site Sensing, Berlin, Germany (nimisha.verma@dlr.de)
- 2ESTEC, European Space Agency, Keplerlaan 1, 2201AZ, Noordwijk ZH, The Netherlands
- 3Department of Earth Sciences, Freie Universität, Malteserstr. 74-100 / Building A, 12249 Berlin, Germany
- 4Institut für Planetologie (IfP), Universität Münster, Wilhelm-KlemmStr. 10, 48149 Münster, Germany
Introduction:
The elemental composition of Mercury’s surface, as studied from MESSENGER, shows that it has a significantly higher abundance of magnesium (Mg) compared to other terrestrial bodies, and very poor abundance of iron (Fe)1. Various studies, over the years, have tried to understand the surface mineral composition of Mercury, however, the exact mineral composition is still unknown.
MERTIS, onboard ESA-JAXA BepiColombo mission, aims to investigate the mineral composition using the infrared spectrometer (TIS) and the radiometer (TIR)2. However, traditional spectral identification methods are time-intensive and challenging for Mercury, where mineralogy is distinct and ground-based samples are limited. To address this gap, we are developing a machine-learning-based mineral identification approach using Laboratory emissivity measurement and synthetic spectra to support MERTIS.
Dataset:
The Planetary Spectroscopy Lab at DLR, Berlin has been measuring samples in Mercury-like conditions for the last 20 years3,4. For this study, we collected spectra from 2013 – 2025 and at present, use 83 minerals amounting to 710 spectra. Some of the minerals are Olivine, Enstatite, Labradorite, Enstatite-Graphite, Olivine – Rhyolite. These minerals represent the most extensively measured samples in the database and are not only representative of Mercury’s expected surface mineralogy. It is important to have a variety in the samples because it helps the algorithm understand the distribution of the data and learn about the physics of mineral mixtures.
PSL is equipped to measure emissivity spectra in vacuum (0.7 mbar) in the spectral range of MERTIS with temperatures from 100° to 500° for a large suite of Mercury surface analogs5. Samples vary in grain size – primarily covering <25 µm, 25-63 µm and >125 µm with single samples or mixtures in different ratios. Over the years, slabs have also been measured and are included in the dataset.
The calibration of emissivity spectra is done using a reference blackbody, measured under the same conditions as the sample and corrected using Kirchhoff’s Law (1 - Reflectance)6,7.
Methodology:
It is crucial for the model to learn the underlying distribution of the spectra rather than treating each spectrum as an isolated data point. We use a Conditional Variational Autoencoder (CVAE) built with 1D convolutional layers to capture local and global patterns across the wavelength. Weights are added to highlight the key spectral features (like Christiansen Features (CF), Reststrahlen bands and transparency features) prior to encoding which helps the model to focus on relevant regions along with the underlying spread.
Temperature is the conditional parameter in the encoder, which allows the model to understand temperature dependent spectral variations. However, temperature parameter is removed from the decoder. The latent space is used for both reconstruction of the original spectra and creating synthetic spectra. The complete CVAE architecture is in Figure 1.
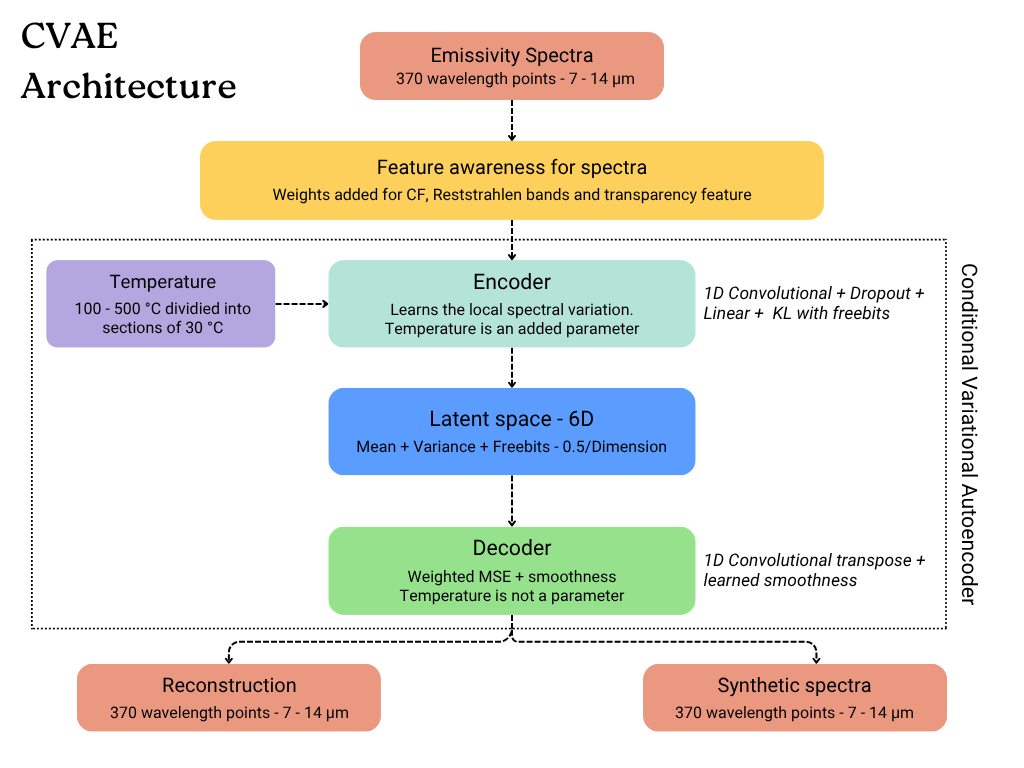
Figure 1: Conditional Variational Autoencoder - Present Architecture
Results:
The model architecture went through 9 iterations before arriving at the current architecture with best possible parameterization. With the current setup, the model is able to learn and distinguish between different minerals, avoid overfitting, and use the latent space in the 6 dimensions. The results are explained below in two sections -
- Reconstruction –
From Figure 2, we see the reconstructed spectra (blue) closely follow the shape of the original spectra (orange dotted) for most minerals, indicating that the model is able to learn key spectral features and the overall spectral structure. Some deviations in emissivity values remain, which we attribute to the latent space still needing additional conditioning parameters to better cluster various spectra. A reconstruction overview from 4 random minerals from Figure 3 highlights the model’s ability to handle outliers like Gabbronite–CaS mixture (Blue).
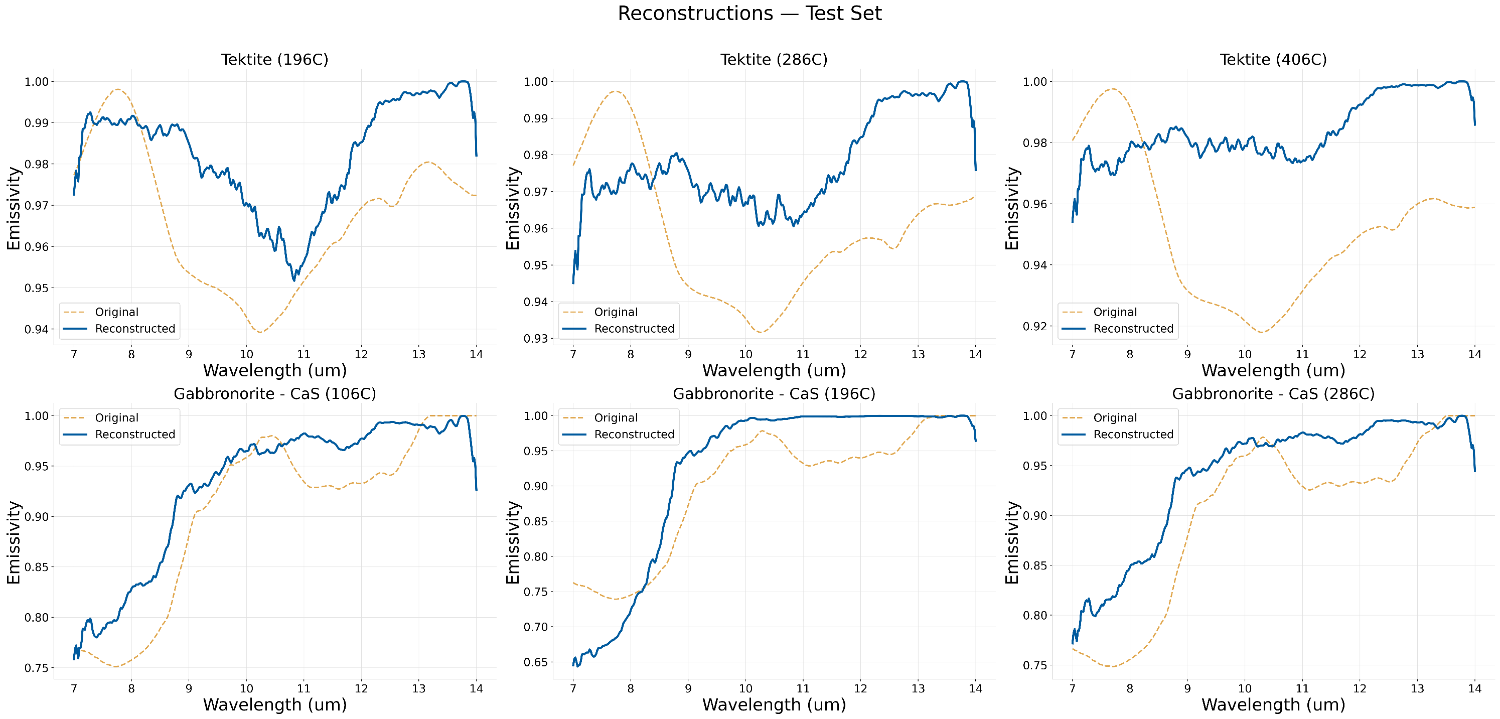
Figure 2: Reconstruction of spectra from test dataset.
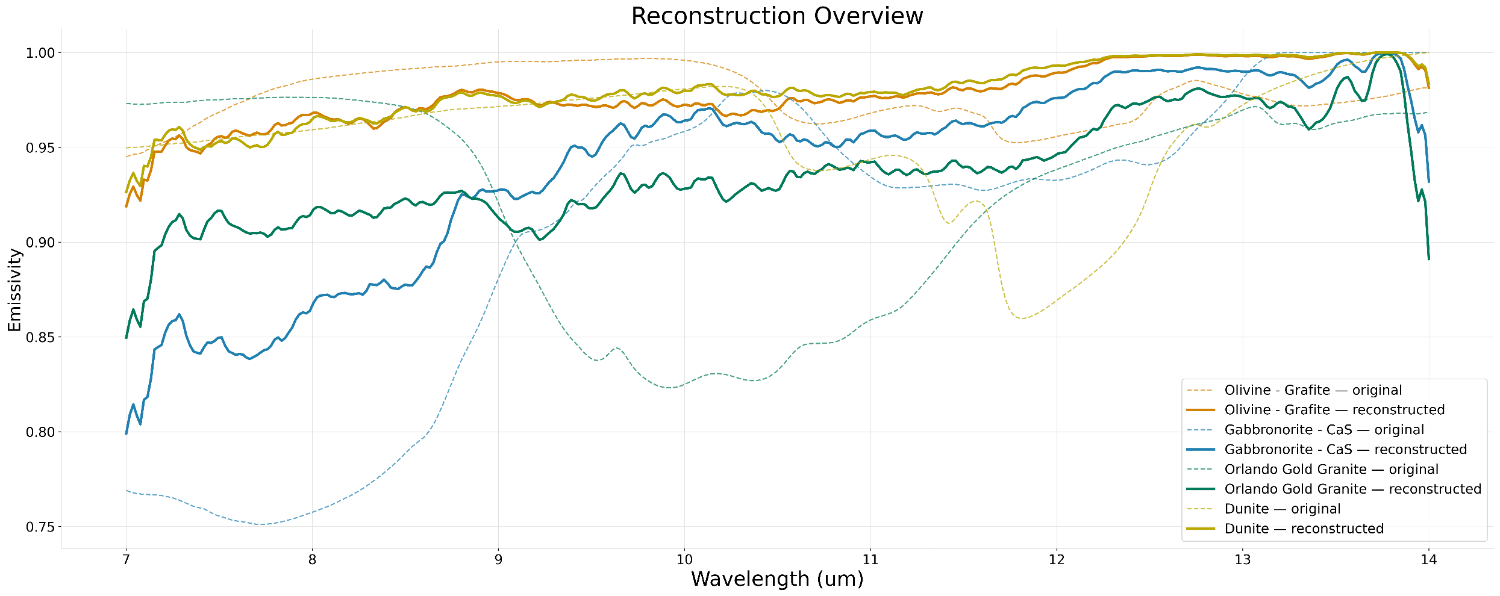
Figure 3: 4 Random spectra and their reconstruction - a comparison.
- Synthetic spectra –
One of the main reasons for using the CVAE is to generate synthetic spectra, expanding the dataset. Figure 4 shows a comparison of synthetic spectra (Yellow) generated from pure samples of Labradorite and Augite (Dotted blue and red) against the original measured mixture spectra of Labradorite – Augite (Dashed green). The synthetic spectra follow the shape of the mixed spectra with variation in the overall emissivity.
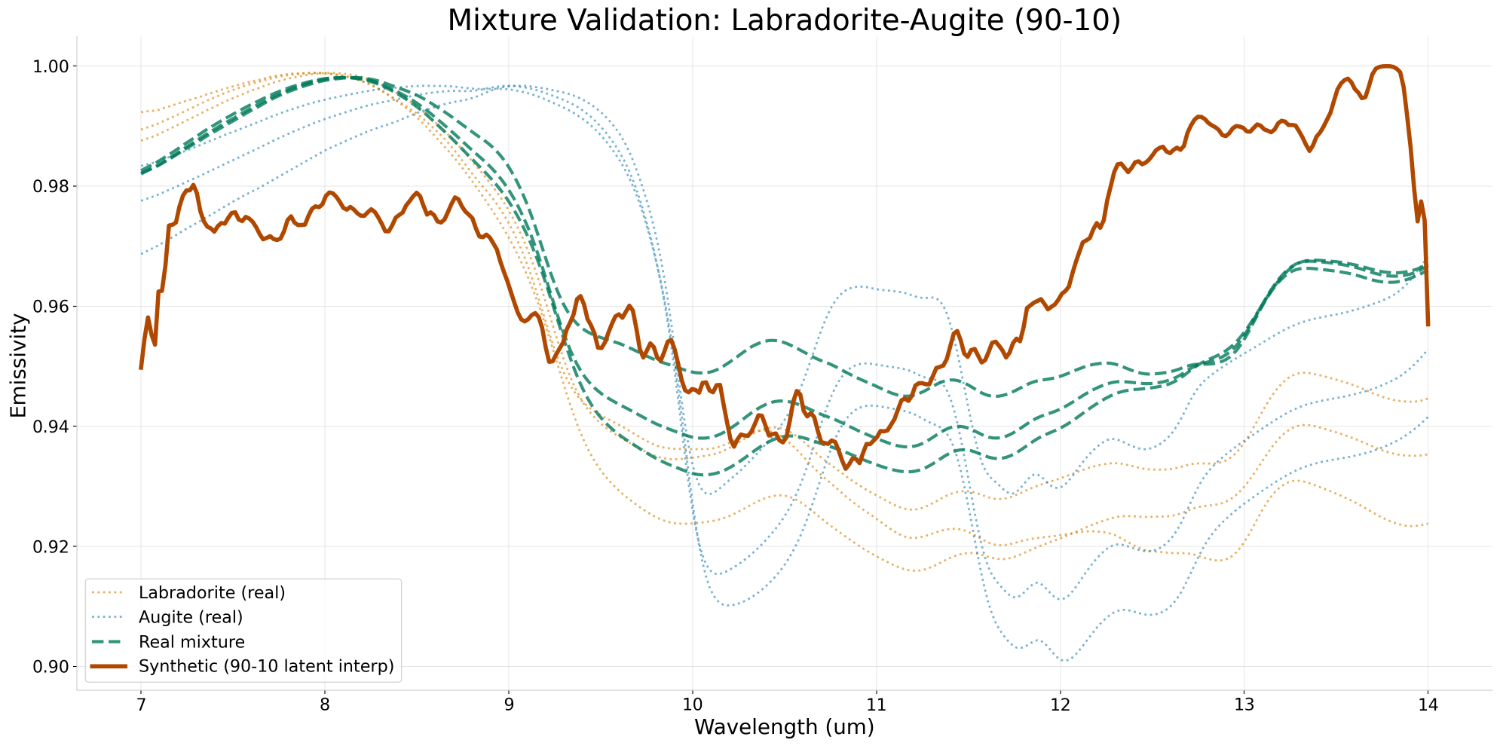
Figure 4: Synthetic spectra Vs Real Mixture - a comparison.
Discussion and Future work:
The current CVAE architecture is well suited to work with the limited dataset available (710 spectra). With the present setup, we are able to identify key spectral features, reconstruct them and generate synthetic spectra. However, there are various limitations – variations in emissivity values, shifts in spectral shape for some minerals, and the synthetic spectra do not always follow the shape of the original spectra.
Therefore, as a next step, additional conditional parameters – like grain size and mixture ratios will be introduced to improve the latent space distribution. We also plan to introduce additional algorithms to this CVAE – like Masked learning and contrastive learning to see if the algorithm is able to reconstruct partial spectra or identify similar minerals. This will help bridge the gap between laboratory and remotely sensed MERTIS data for mineral identification.
References:
- Nittler, L. R. et al. The Major-Element Composition of Mercury’s Surface from MESSENGER X-ray Spectrometry. Science 333, 1847–1850 (2011).
- Hiesinger et.al. The Mercury Radiometer and Thermal Infrared Spectrometer (MERTIS) for the BepiColombo mission. Planetary and Space Science 58, 144–165 (2010).
- Maturilli et.al. Emissivity measurements of analogue materials for the interpretation of data from PFS on Mars Express and MERTIS on Bepi-Colombo. Planetary and Space Science 54, 1057–1064 (2006).
- Maturilli et.al. Characterization, testing, calibration, and validation of the Berlin emissivity database. J. Appl. Remote Sens 8, 084985 (2014).
- Maturilli et.al. Emissivity Spectra of Mercury Analogues under Mercury Pressure and Temperature Conditions. in vol. 11 (EPSC2017, Riga, Latvia, 2017).
- Salisbury et.al. Thermal‐infrared remote sensing and Kirchhoff’s law: 1. Laboratory measurements. J. Geophys. Res. 99, 11897–11911 (1994).
- Ruff et.al. Quantitative thermal emission spectroscopy of minerals: A laboratory technique for measurement and calibration. J. Geophys. Res. 102, 14899–14913 (1997).
How to cite: Verma, N., Helbert, J., D'Amore, M., Maturilli, A., Alemanno, G., Otto, K., Agarwal, S., Fanara, L., Lamers, G., den Neucker, A. V., Barraud, O., Domac, A., Hiesinger, H., and Adeli, S.: Bridging Laboratory Spectra and Mercury’s surface: A Machine Learning approach to mineral identification for MERTIS, Europlanet Science Congress 2026, The Hague, The Netherlands, 7–11 Sep 2026, EPSC2026-333, https://doi.org/10.5194/epsc2026-333, 2026.


