MITM5 | Artificial Intelligence and Machine Learning for Planetary Science in the Age of Big Data.

MITM5

Artificial Intelligence and Machine Learning for Planetary Science in the Age of Big Data.
Co-organized by TP
Convener: Alexander M. Barrett | Co-conveners: Valerio Carruba, Beatrice Baschetti, Nimisha Verma, Natalia Amanda Vergara Sassarini, Elena A. Favaro
Orals TUE1
| Tue, 08 Sep, 08:30–10:00 (CEST)|Room Uranus (Swing)
Posters TUE-POS
| Attendance Tue, 08 Sep, 18:00–19:30 (CEST) | Display Tue, 08 Sep, 08:30–19:30|Foyer 3, F3.40–46
Tue, 08:30
Tue, 18:00
Artificial intelligence (AI) and Machine Learning (ML) are rapidly transforming planetary science, enabling the analysis and interpretation of increasingly large, complex, and heterogeneous datasets from current and upcoming missions. Recent advances, such as deep learning, Large Language Models, generative AI, and physics-informed ML, offer innovative new tools to explore and interpret the big datasets which are ubiquitous across all domains of planetary and space science.
These tools have the potential to enable larger scale and more in-depth analyses than have ever been possible before. At the same time, there is a growing focus on model interpretability, uncertainty quantification, physical consistency, and reproducibility to make sure that AI-driven methods lead to strong and reliable scientific knowledge. Thanks to this, the scientific revenue from the application of such technologies is steadily increasing.
Historically ML techniques have had a high barrier to entry for planetary scientists. However, as the use of ML has become more widespread, the techniques have become more accessible, thereby democratising this powerful tool.
This session provides a forum for presenting and discussing state-of-the-art applications of AI and ML across planetary science, as well as emerging methodologies, best practices, and future directions at the interface of data-driven and physics-based modelling. It welcomes contributions reporting original scientific results from AI-driven applications and discoveries from across the solar system and beyond. We particularly encourage the discussion of open access and transferable models, as well as presentations which will help promote these techniques to others who are considering using them.

Orals: Tue, 8 Sep, 08:30–10:00 | Room Uranus (Swing)

ML and AI in Planetary Science in the age of Big Data: Oral Session
08:30–08:45
|
EPSC2026-422
|
ECP
|
solicited
|
On-site presentation
Jakub Śledziowski, Bartosz Pieterek, and Thomas J. Jones

Planetary geology is based on fundamental terrestrial geological principles combined with modern emerging methodologies. The increasing amount of available high-resolution planetary remote-sensing datasets enable a rapid expansion of the possibilities for quantitative geomorphological analysis, which is fundamental for landforms classification and their further interpretations. However, many landform measurements still rely on expert visual interpretation and manual mapping, limiting reproducibility and scalability. With hundreds of thousands of landforms currently recognized on the planet’s surface, Martian pitted cones provide a clear example of this challenge. Although almost near-global orbital image coverage has enabled their automated identification and provided key insights into their spatial distribution, systematic morphometric analysis remains poorly constrained because manual measurements are highly labour-intensive, depend on spatially limited topographic datasets, and often involve non-standardized methodology protocols.

To address this challenge and enable the development of the global morphometric dataset, MarsCONE, an open-source workflow for automatic morphological analysis of Martian pitted cones, has been developed and publicly released (Śledziowski et al., 2026). It constitutes an important step from expert-based mapping toward reproducible planetary geomorphometry. MarsCONE uses high-resolution digital elevation models (DEMs), including High Resolution Imaging Science Experiment (HiRISE)-derived DEMs, to automate the extraction of pitted cone morphometric parameters. The workflow formalizes an often subjective, expert-defined measurement protocol and the detection of morphological pointsinto a transparent processing chain, including topographic data preparation, transect generation, profile extraction, morphological point detection, cross-transect aggregation, uncertainty handling, and data export.

To constrain and validate the performance of MarsCONE against expert-based manual mapping, we compared the morphometric parameters obtained during eight hours of manual analysis with those automatically calculated by MarsCONE in only a few minutes. This comparison demonstrates the broad potential of automation in planetary geomorphology by reducing repetitive manual work, improves reproducibility, and enabling the standardized and consistent analysis of large landform populations. Importantly, MarsCONE is not intended to replace expert geological interpretation. Instead, it makes expert-informed measurement procedures reusable, scalable, and easier to validate.

The MarsCONE workflow is also relevant to the broad application of machine learning and data-driven methods in planetary exploration. The automatic detection methods depend on reliable and interpretable feature datasets before classification, clustering, or prediction can be meaningfully attempted. MarsCONE contributes to this prerequisite by generating quality-controlled morphometric descriptors, including cone dimensions, height, depression depth, flank geometry, cross-transect variability, and uncertainty-related indicators. These outputs can support downstream applications such as supervised classification, unsupervised clustering, anomaly detection, analogue comparison, and population-scale geomorphological studies.

Nevertheless, the original Python-based MarsCONE tool requires programming knowledge and script modification, which may limit its accessibility to a wider range of users. To make MarsCONE more user-friendly beyond computational experts, we are developing an updated version, MarsCONE 2.0, featuring a graphical user interface that lowers the technical barrier for users applying automated morphometry. The new interface enables parameter configuration, DEM visualization, cross-section inspection, review of automatic detections and subsequent changes of the detection, and export of structured results. Altogether, this improvement makes reproducible computational workflows more accessible to planetary scientists with different levels of programming experience.

Through the updated version of MarsCONE, we also address the geological complexity of pitted cone morphology. The newly added modules and tool capabilities enable the analysis of the overlapping cones with multiple summit craters. This advancement improves the robustness of morphometric analyses in complex volcanic fields and expands the applicability of the tool to more realistic and heterogeneous planetary surfaces.

Altogether, MarsCONE demonstrates that democratizing emerging computational methods in planetary science does not begin only with advanced algorithms. It also requires transparent tools that transform expert interpretation into reproducible, interpretable, and reusable datasets. Automated planetary geomorphometry therefore provides a practical pathway from manual mapping to scalable, data-driven analysis of planetary surfaces.


Resources:

Śledziowski, J., Pieterek, B., & Jones, T. J. (2026). MarsCONE: A software toolbox for automatic morphological analysis of Martian pitted-cones. SoftwareX, 102608. https://doi.org/10.1016/j.softx.2026.102608

How to cite: Śledziowski, J., Pieterek, B., and J. Jones, T.: From Expert Mapping to Automated Planetary Geomorphometry: The MarsCONE Workflow for Cone Analysis, Europlanet Science Congress 2026, The Hague, The Netherlands, 7–11 Sep 2026, EPSC2026-422, https://doi.org/10.5194/epsc2026-422, 2026.

08:45–09:00
|
EPSC2026-883
|
ECP
|
On-site presentation
Tom Sander, Kay Wohlfarth, Mirza Arnaut, Marcel Hess, and Christian Wöhler

Introduction
Lunar swirls are a unique class of surface features defined by sinuous, high-albedo markings that lack distinct topographic or stratigraphic expression. These features are influenced by crustal magnetism, regolith maturation, and space weathering, yet decades of orbital observations have not resolved the competing hypotheses for their formation. Proposed models include solar wind shielding by localized mini-magnetospheres [1, 2], surface scouring from cometary impacts [3], and electrostatic transport of fine-grained regolith [4, 5]. Previous efforts to distinguish among these hypotheses have primarily relied on qualitative interpretation, mineralogical correlations [6], and linear regression methods [7]. However, these traditional approaches are limited in their capacity to capture the complex, high-dimensional, and nonlinear relations present in multimodal planetary datasets. To address the need for advanced data integration in planetary science, this study introduces a multimodal machine learning model that synthesizes distinct categories of orbital datasets, such as spectral and radar measurements, to identify the unified physical signatures of lunar swirls.

Methodology
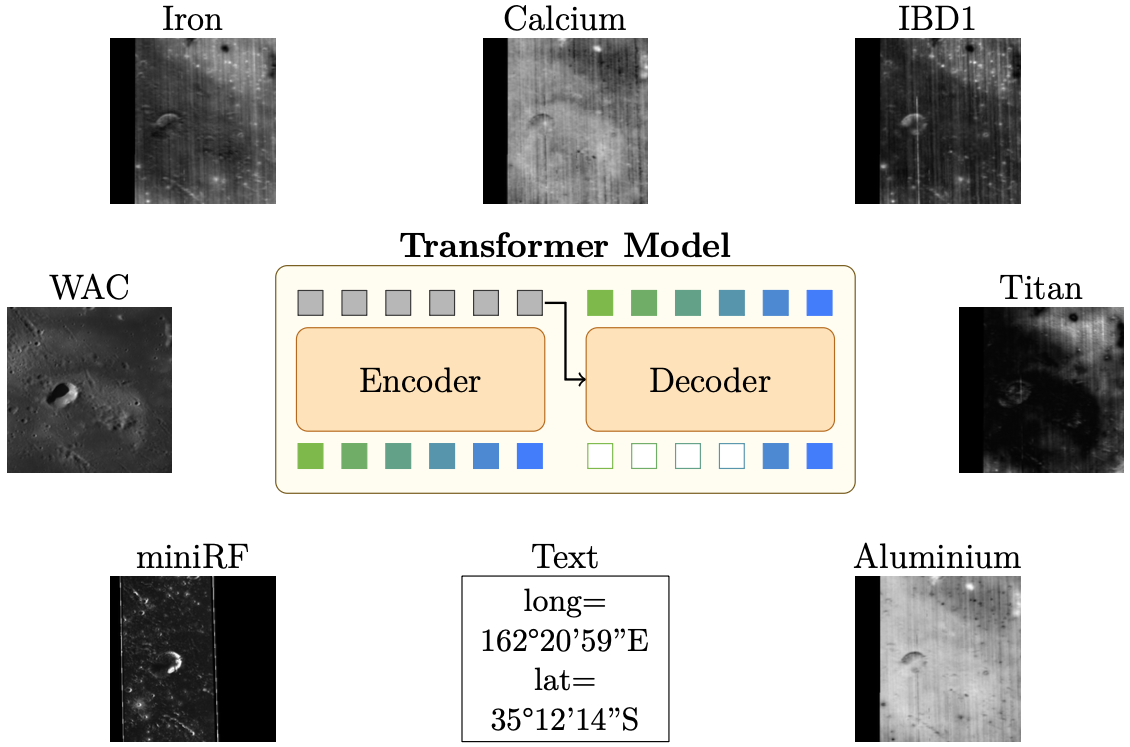
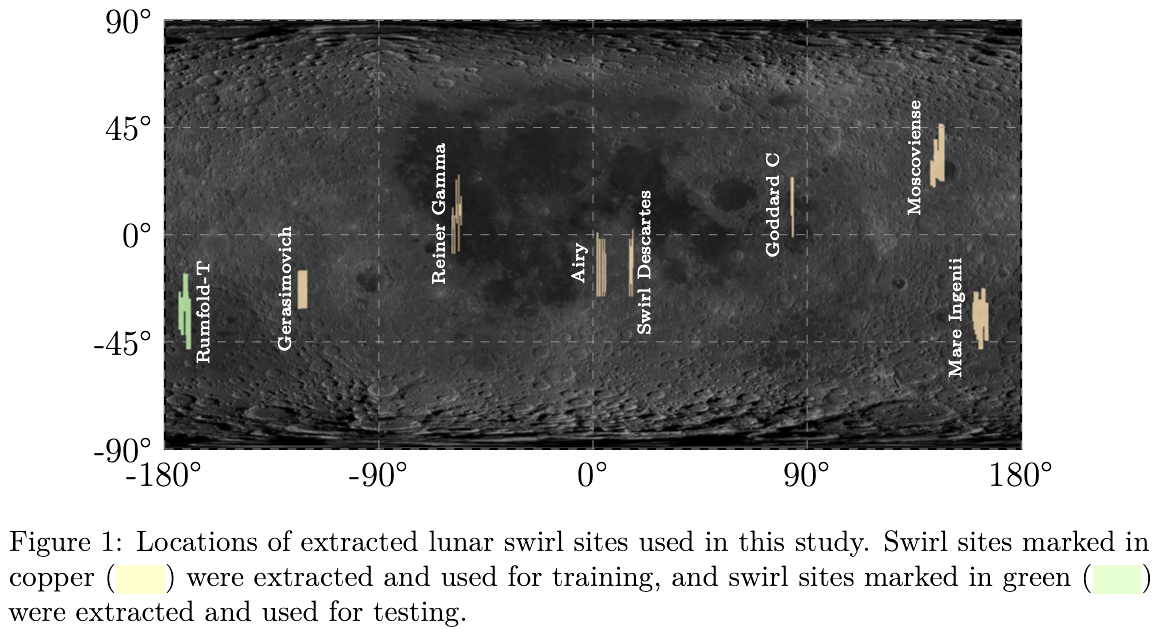
Drawing on recent breakthroughs in foundational vision-language models (VLA), a state-of-the-art multimodal Masked Autoencoder (MAE) based on a Transformer architecture was developed and trained on 12 distinct remote sensing modalities. The dataset covers 56 sites across 8 recognized lunar swirls (see Figure 1). As shown in Figure 2, the model processes heterogeneous input modalities, including image-like geophysical observations (such as LRO WAC reflectance, LRO Mini-RF radar backscatter, M3-derived elemental abundance maps, and brightness temperature) and textual spatial position information, which are jointly routed through a shared Transformer encoder-decoder. To approach the unique characteristics of each input, image-based modalities are compressed into discrete latent tokens using a dedicated, pre-trained VQ-GAN-style tokenizer, while textual coordinate modalities employ a structured, regex-based tokenization method. This brings the training dataset up to 39 million individual tokens. The Transformer encoder processes a visible subset of these tokens, and the decoder reconstructs the masked subset for each modality, compelling the network to acquire robust cross-modal geophysical relationships. The model underwent rigorous validation by repeated stratified cross-validation, followed by deployment as an exploratory tool using Leave-One-Out (LOO) ablations, Leave-One-In (LOI) evaluations, and Representational Similarity Analysis (RSA).

Results
Deploying the validated Transformer as an exploratory probe revealed quantitative constraints on the physical nature of lunar swirls. Leave-One-Out and Leave-One-In ablations identified plagioclase abundance as the most critical modality for boundary delineation, while Wide Angle Camera (WAC) reflectance emerged as the most independently sufficient dataset. Representational Similarity Analysis further demonstrated that the network encodes geophysical content along directions geometrically distinct from spatial coordinates. This confirms the model successfully captures a shared physical context across swirl sites, rather than relying on location-specific biases. By extending this ablation logic to the spatial domain, we found that the dependence of optical reflectance on mineralogical inputs is significantly stronger within swirl interiors than in the surrounding terrain. Crucially, no comparable enhancement in cross-modal coupling was observed for thermal emission or Mini-RF radar backscatter. This distinct asymmetry provides the empirical signature predicted by the maturation-retardation hypothesis, clearly separating it from competing scenarios, including cometary impacts or dust transport.

Discussion and Conclusion
The enhanced optical-compositional coupling observed inside lunar swirls is the empirical signature uniquely predicted by the maturation-retardation hypothesis [8, 9]. Reduced solar wind exposure preserves the structural relationship between regolith composition and observed brightness, a relationship that is otherwise obscured by accumulated nanophase iron in normally weathered background terrain [8, 11]. Alternative scenarios, such as cometary impacts [3], electrostatic dust transport [4], or thermophysical modification, do not predict this specific asymmetry. Instead, these alternative formation models would suggest that thermal or radar properties should exhibit similarly enhanced coupling to other physical domains within the swirls. This work characterizes the analytical limits of current orbital archives, highlighting that orbital data alone cannot definitively distinguish solar-wind shielding from other mechanisms that equivalently slow regolith maturation. Resolving the deeper structural and magnetic origins of swirls requires in-situ measurements, such as those planned for the upcoming Lunar Vertex mission [10]. Our results show that machine learning can extract complex, non-linear relationships from existing planetary datasets. This not only maximizes the data from legacy missions but also helps prioritize targets for future surface exploration.

References
[1] Bamford, R., et al., "Minimagnetospheres above the lunar surface and the formation of lunar swirls", Physical Review Letters, 2012.
[2] Deca, J., et al., "Reiner gamma albedo features reproduced by modeling solar wind standoff", Communications Physics, 2018.
[3] Schultz, P.H., Srnka, L.J., "Cometary collisions on the moon and mercury", Nature, 1980.
[4] Garrick-Bethell, I., et al., "Spectral properties, magnetic fields, and dust transport at lunar swirls", Icarus, 2011.
[5] Domingue, D., et al., "Topographic correlations within lunar swirls in mare ingenii", Geophysical Research Letters, 2022.
[6] Domingue, D., et al., "Spectrophotometric and topographic correlations within the mare ingenii swirl region: Evidence for a highly mobile lunar regolith", The Planetary Science Journal, 2023.
[7] Chrbolková, K., et al., "Reflectance spectra of seven lunar swirls examined by statistical methods: A space weathering study", Icarus, 2019.
[8] Hess, M., et al., "Processes governing the vis/nir spectral reflectance behavior of lunar swirls", Astronomy & Astrophysics, 2020.
[9] Zhao, W., et al., "Formation of lunar swirls: Implication from derived nanophase iron abundance", Remote Sensing, 2025.
[10] Vines, S., et al., "Lunar vertex: A prism science investigation of the Reiner gamma lunar magnetic anomaly and swirl", EGU, 2023.
[11] Kramer, G.Y., et al., "M3 spectral analysis of lunar swirls and the link between optical maturation and surface hydroxyl formation at magnetic anomalies", Journal of Geophysical Research: Planets, 2011.

How to cite: Sander, T., Wohlfarth, K., Arnaut, M., Hess, M., and Wöhler, C.: Investigating Lunar Swirls Using a Multimodal Transformer: A Masked Autoencoder Approach for Integrating Heterogeneous Planetary Remote Sensing Data, Europlanet Science Congress 2026, The Hague, The Netherlands, 7–11 Sep 2026, EPSC2026-883, https://doi.org/10.5194/epsc2026-883, 2026.

09:00–09:12
|
EPSC2026-333
|
ECP
|
On-site presentation
Nimisha Verma, Jörn Helbert, Mario D'Amore, Alessandro Maturilli, Giulia Alemanno, Katharina Otto, Siddhant Agarwal, Lida Fanara, Greta Lamers, Aurelie Van den Neucker, Oceane Barraud, Akin Domac, Harald Hiesinger, and Solmaz Adeli

Introduction:

The elemental composition of Mercury’s surface, as studied from MESSENGER, shows that it has a significantly higher abundance of magnesium (Mg) compared to other terrestrial bodies, and very poor abundance of iron (Fe)1. Various studies, over the years, have tried to understand the surface mineral composition of Mercury, however, the exact mineral composition is still unknown.

MERTIS, onboard ESA-JAXA BepiColombo mission, aims to investigate the mineral composition using the infrared spectrometer (TIS) and the radiometer (TIR)2. However, traditional spectral identification methods are time-intensive and challenging for Mercury, where mineralogy is distinct and ground-based samples are limited. To address this gap, we are developing a machine-learning-based mineral identification approach using Laboratory emissivity measurement and synthetic spectra to support MERTIS.

Dataset:

The Planetary Spectroscopy Lab at DLR, Berlin has been measuring samples in Mercury-like conditions for the last 20 years3,4. For this study, we collected spectra from 2013 – 2025 and at present, use 83 minerals amounting to 710 spectra. Some of the minerals are Olivine, Enstatite, Labradorite, Enstatite-Graphite, Olivine – Rhyolite. These minerals represent the most extensively measured samples in the database and are not only representative of Mercury’s expected surface mineralogy. It is important to have a variety in the samples because it helps the algorithm understand the distribution of the data and learn about the physics of mineral mixtures.

PSL is equipped to measure emissivity spectra in vacuum (0.7 mbar) in the spectral range of MERTIS with temperatures from 100° to 500° for a large suite of Mercury surface analogs5. Samples vary in grain size – primarily covering <25 µm, 25-63 µm and >125 µm with single samples or mixtures in different ratios. Over the years, slabs have also been measured and are included in the dataset.

The calibration of emissivity spectra is done using a reference blackbody, measured under the same conditions as the sample and corrected using Kirchhoff’s Law (1 - Reflectance)6,7.

Methodology:

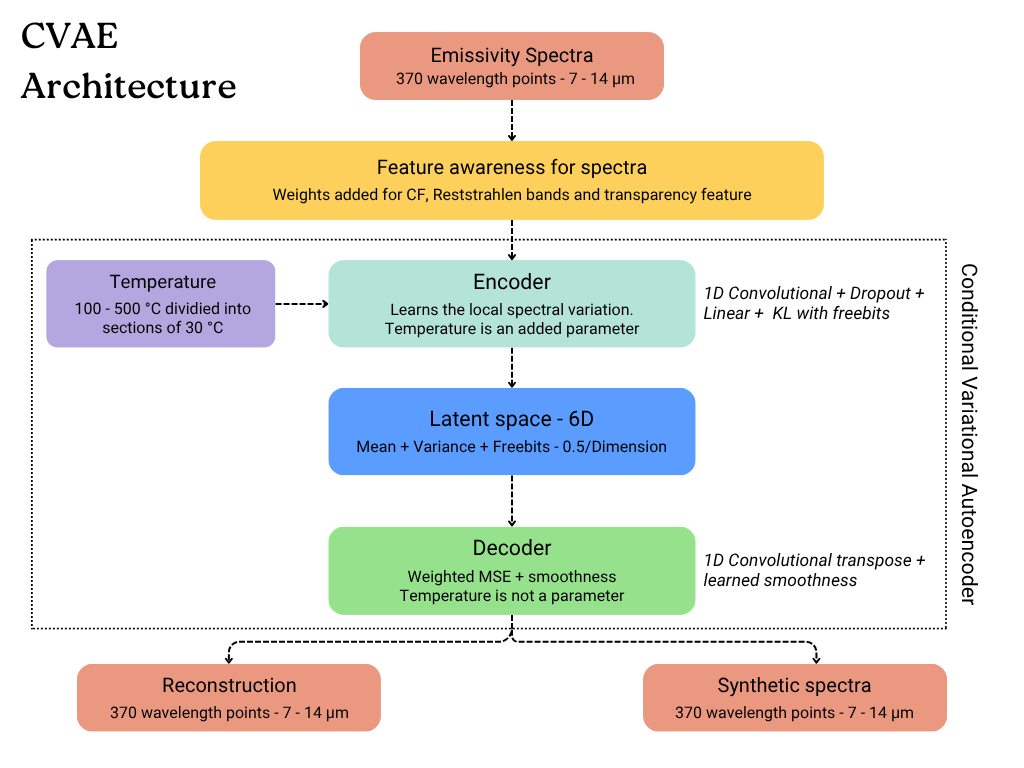
It is crucial for the model to learn the underlying distribution of the spectra rather than treating each spectrum as an isolated data point. We use a Conditional Variational Autoencoder (CVAE) built with 1D convolutional layers to capture local and global patterns across the wavelength. Weights are added to highlight the key spectral features (like Christiansen Features (CF), Reststrahlen bands and transparency features) prior to encoding which helps the model to focus on relevant regions along with the underlying spread.

Temperature is the conditional parameter in the encoder, which allows the model to understand temperature dependent spectral variations. However, temperature parameter is removed from the decoder. The latent space is used for both reconstruction of the original spectra and creating synthetic spectra. The complete CVAE architecture is in Figure 1.

Figure 1: Conditional Variational Autoencoder - Present Architecture

Results:

The model architecture went through 9 iterations before arriving at the current architecture with best possible parameterization. With the current setup, the model is able to learn and distinguish between different minerals, avoid overfitting, and use the latent space in the 6 dimensions. The results are explained below in two sections -

  • Reconstruction –

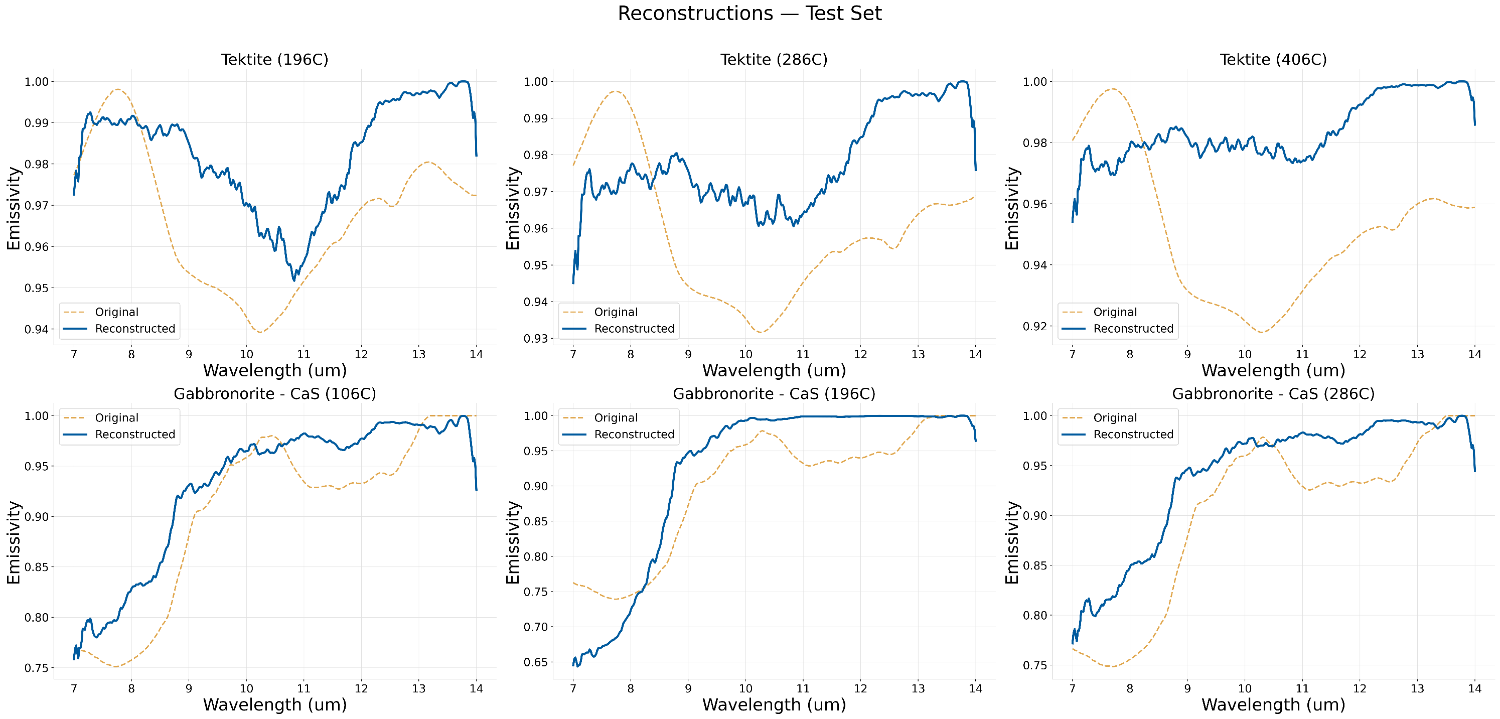
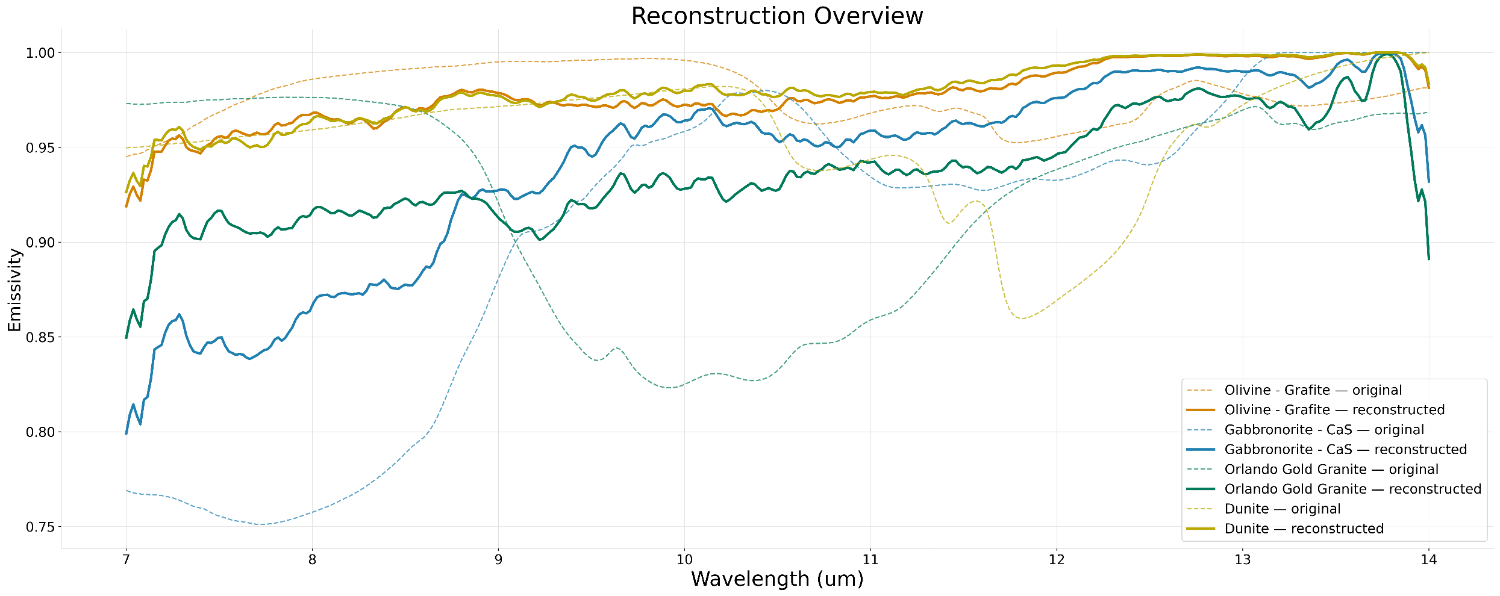
From Figure 2, we see the reconstructed spectra (blue) closely follow the shape of the original spectra (orange dotted) for most minerals, indicating that the model is able to learn key spectral features and the overall spectral structure. Some deviations in emissivity values remain, which we attribute to the latent space still needing additional conditioning parameters to better cluster various spectra. A reconstruction overview from 4 random minerals from Figure 3 highlights the model’s ability to handle outliers like Gabbronite–CaS mixture (Blue).

Figure 2: Reconstruction of spectra from test dataset.

Figure 3: 4 Random spectra and their reconstruction - a comparison.

  • Synthetic spectra –

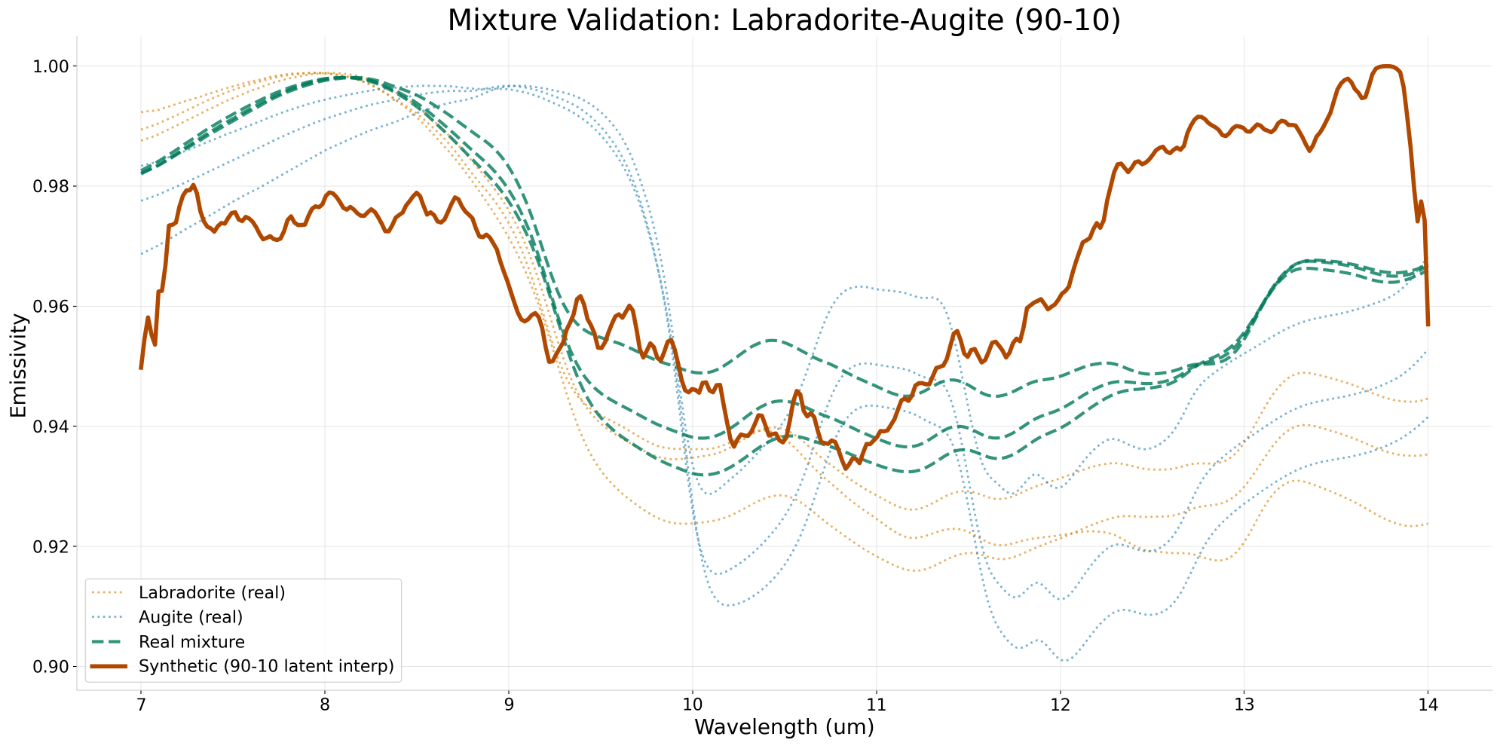
One of the main reasons for using the CVAE is to generate synthetic spectra, expanding the dataset. Figure 4 shows a comparison of synthetic spectra (Yellow) generated from pure samples of Labradorite and Augite (Dotted blue and red) against the original measured mixture spectra of Labradorite – Augite (Dashed green). The synthetic spectra follow the shape of the mixed spectra with variation in the overall emissivity.

Figure 4: Synthetic spectra Vs Real Mixture - a comparison.

Discussion and Future work:

The current CVAE architecture is well suited to work with the limited dataset available (710 spectra). With the present setup, we are able to identify key spectral features, reconstruct them and generate synthetic spectra. However, there are various limitations – variations in emissivity values, shifts in spectral shape for some minerals, and the synthetic spectra do not always follow the shape of the original spectra.

Therefore, as a next step, additional conditional parameters – like grain size and mixture ratios will be introduced to improve the latent space distribution. We also plan to introduce additional algorithms to this CVAE – like Masked learning and contrastive learning to see if the algorithm is able to reconstruct partial spectra or identify similar minerals. This will help bridge the gap between laboratory and remotely sensed MERTIS data for mineral identification.

References:

  • Nittler, L. R. et al. The Major-Element Composition of Mercury’s Surface from MESSENGER X-ray Spectrometry. Science 333, 1847–1850 (2011).
  • Hiesinger et.al. The Mercury Radiometer and Thermal Infrared Spectrometer (MERTIS) for the BepiColombo mission. Planetary and Space Science 58, 144–165 (2010).
  • Maturilli et.al. Emissivity measurements of analogue materials for the interpretation of data from PFS on Mars Express and MERTIS on Bepi-Colombo. Planetary and Space Science 54, 1057–1064 (2006).
  • Maturilli et.al. Characterization, testing, calibration, and validation of the Berlin emissivity database. J. Appl. Remote Sens 8, 084985 (2014).
  • Maturilli et.al. Emissivity Spectra of Mercury Analogues under Mercury Pressure and Temperature Conditions. in vol. 11 (EPSC2017, Riga, Latvia, 2017).
  • Salisbury et.al. Thermal‐infrared remote sensing and Kirchhoff’s law: 1. Laboratory measurements. J. Geophys. Res. 99, 11897–11911 (1994).
  • Ruff et.al. Quantitative thermal emission spectroscopy of minerals: A laboratory technique for measurement and calibration. J. Geophys. Res. 102, 14899–14913 (1997).

How to cite: Verma, N., Helbert, J., D'Amore, M., Maturilli, A., Alemanno, G., Otto, K., Agarwal, S., Fanara, L., Lamers, G., den Neucker, A. V., Barraud, O., Domac, A., Hiesinger, H., and Adeli, S.: Bridging Laboratory Spectra and Mercury’s surface: A Machine Learning approach to mineral identification for MERTIS, Europlanet Science Congress 2026, The Hague, The Netherlands, 7–11 Sep 2026, EPSC2026-333, https://doi.org/10.5194/epsc2026-333, 2026.

09:12–09:24
|
EPSC2026-913
|
On-site presentation
Simon Lejoly, Arianna Piccialli, Arnaud Mahieux, Ann Carine Vandaele, and Benoît Frénay

Introduction

The dynamics of Venus’ atmosphere around its terminator region currently remains poorly understood. The main source of temperature observations is the SOIR dataset [1], resulting from the Venus Express mission. The dataset contains 684 temperature profiles recovered through solar occultation, covering both sides of the terminator. The observations span from 2006 to 2014, amounting to an approximate 25,000 temperature points in total, observed at varying altitudes, latitudes, longitudes, and time. 

Analysis of the SOIR dataset reveals a lot of variability and uncertainty in the data, both within each temperature profile and between different profiles. Identifying outliers in the dataset is a mandatory first step to extract meaningful knowledge from observations. In previous analyses, this was done manually through visual inspection. We propose a more systematic, scalable, and uncertainty-aware approach through the use of probabilistic modelling. 

Probabilistic modelling of temperature profiles 

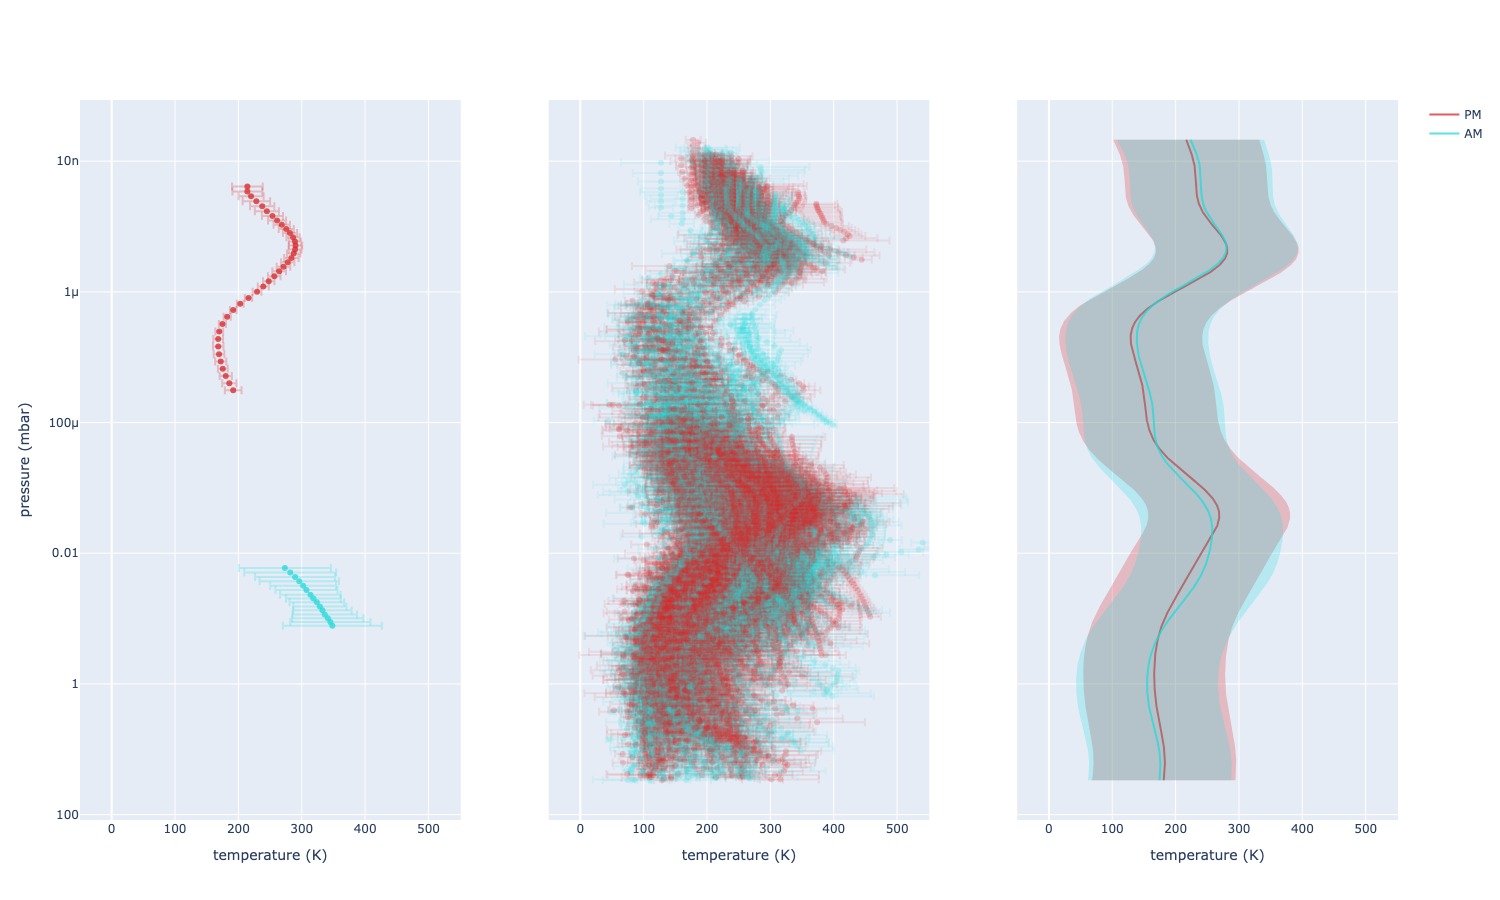
As seen in Figure 1, profiles from SOIR consist of a sequence of temperature points with their respective uncertainty estimate. Therefore, each profile can be considered as an observation of a Gaussian Process (GP) at discrete altitudes. GPs are probabilistic models used for sequential data analysis, well-known for their capacity to handle uncertainty. Using a multi-task Gaussian process framework [2], we can combine multiple observed profiles to learn a single mean profile. In this experiment, we separate profiles into two groups, based on the local time of observation (either at 6 AM or 6 PM).

Fig. 1: Left: two profiles from the SOIR dataset, with their uncertainty estimates. Profiles from SOIR are often unaligned and have varying uncertainty estimates. Center: the whole SOIR dataset. Right: the mean profiles learnt by the multi-task GP, with 95% confidence intervals. Blue/red respectively correspond to profiles observed at 6 AM/PM local solar time. 

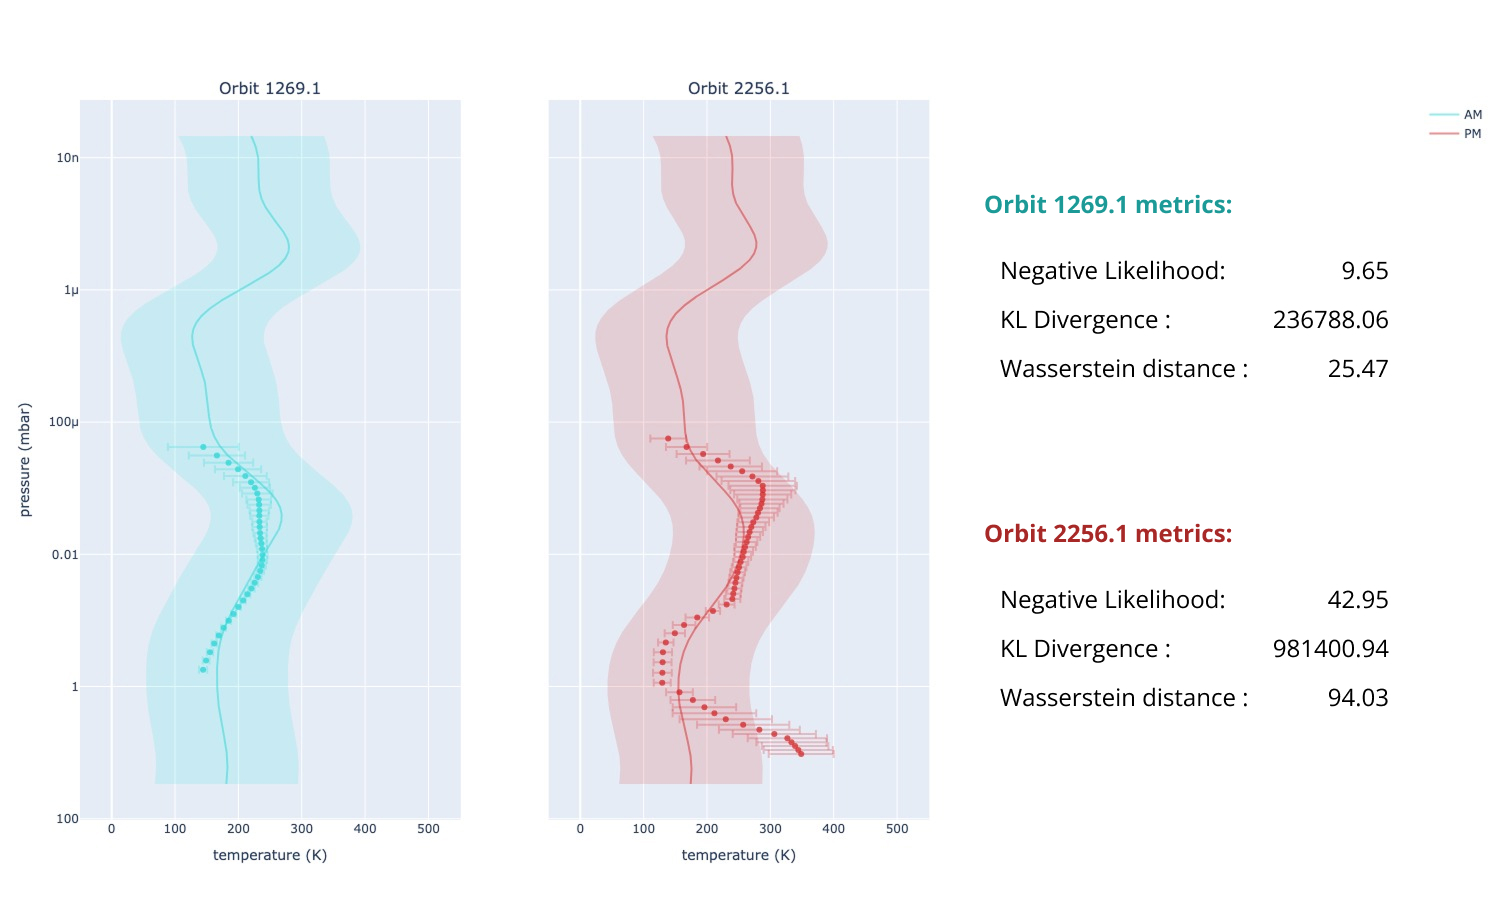
The rationale for using GPs is that any discrete observation of a GP is a multivariate Gaussian distribution. This includes every profile from the dataset as well as our mean profiles. Therefore, we can use any probabilistic metric able to compare two Gaussian distributions to assess how each profile deviates from its corresponding mean profile. A full atmospheric profile can then be characterised by a single value corresponding to its difference with the mean profile, no matter how many temperature observations the profile contained originally. Good examples of appropriate metrics are the Gaussian negative likelihood used to train the GP, the Kullback-Leibler Divergence, and the Wasserstein distance. The more typical a profile, the lower these metrics should be. Figure 2 illustrates this with two profiles. 


Fig. 2: Comparison of two profiles corresponding to orbits 1269.1 and 2256.1 with their corresponding mean profile. The metrics comparing each profile with its mean profile confirm that the first one is closer to the average dynamics of the atmosphere than the second one. 

Identifying outliers 

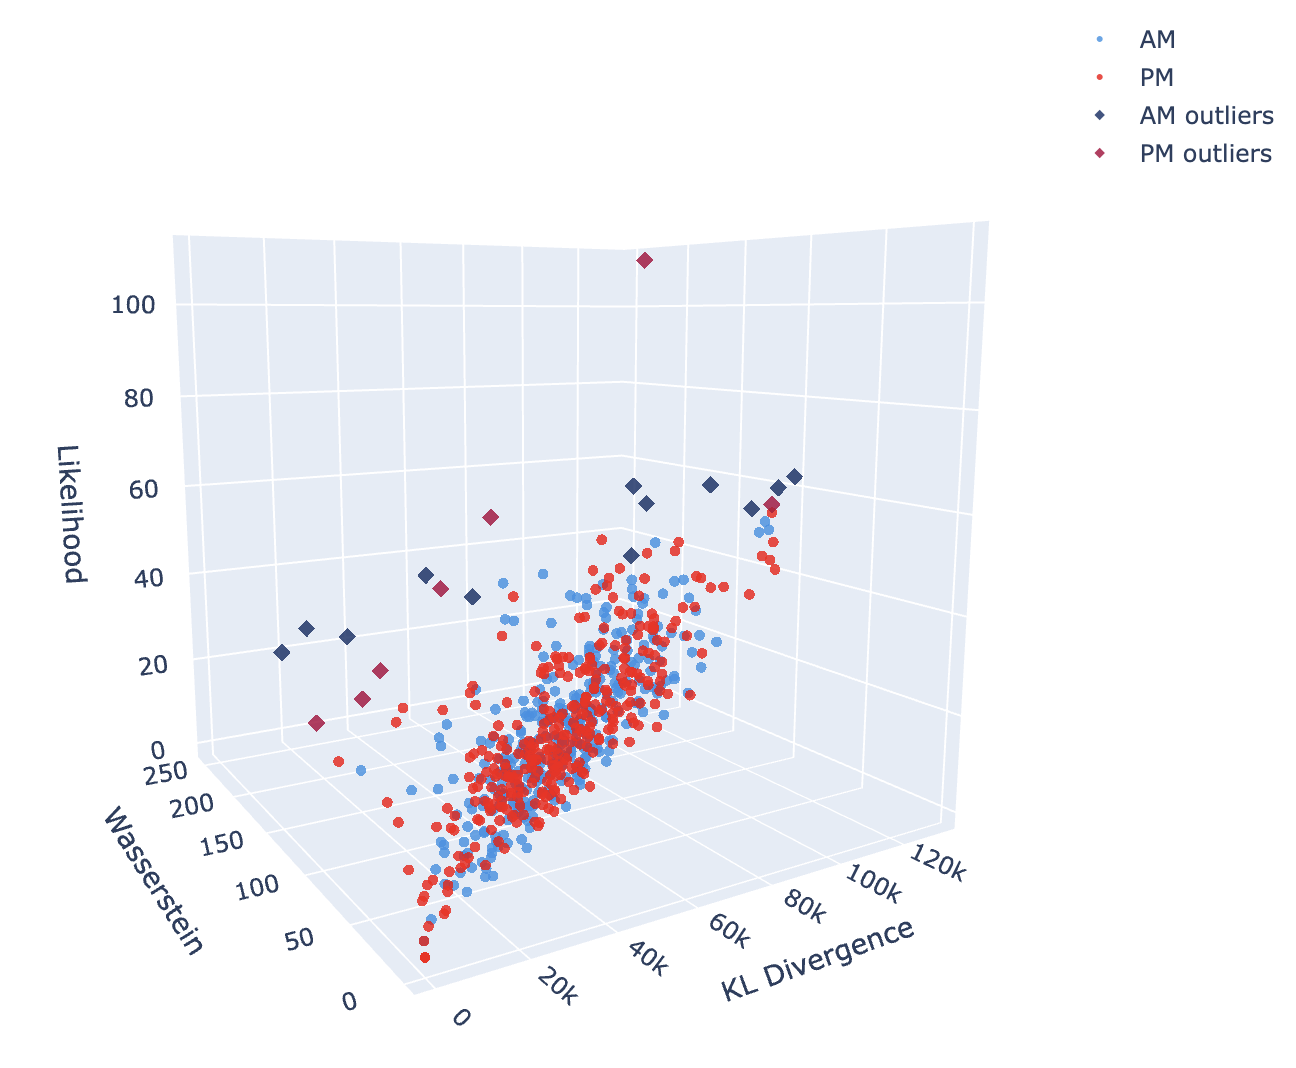
We can plot the whole dataset as a 3D scatter plot by using the three metrics computed for each profile, as shown in Figure 3. This representation makes it easy to identify profiles that are abnormally different from most other profiles.

Fig. 3: Distribution of the whole SOIR dataset with respect to each metric. Each profile is represented by a single dot in 3D space. Most profiles of the dataset seem aggregated in a specific region, while outlier profiles are scattered in regions corresponding to high values of each metric. 

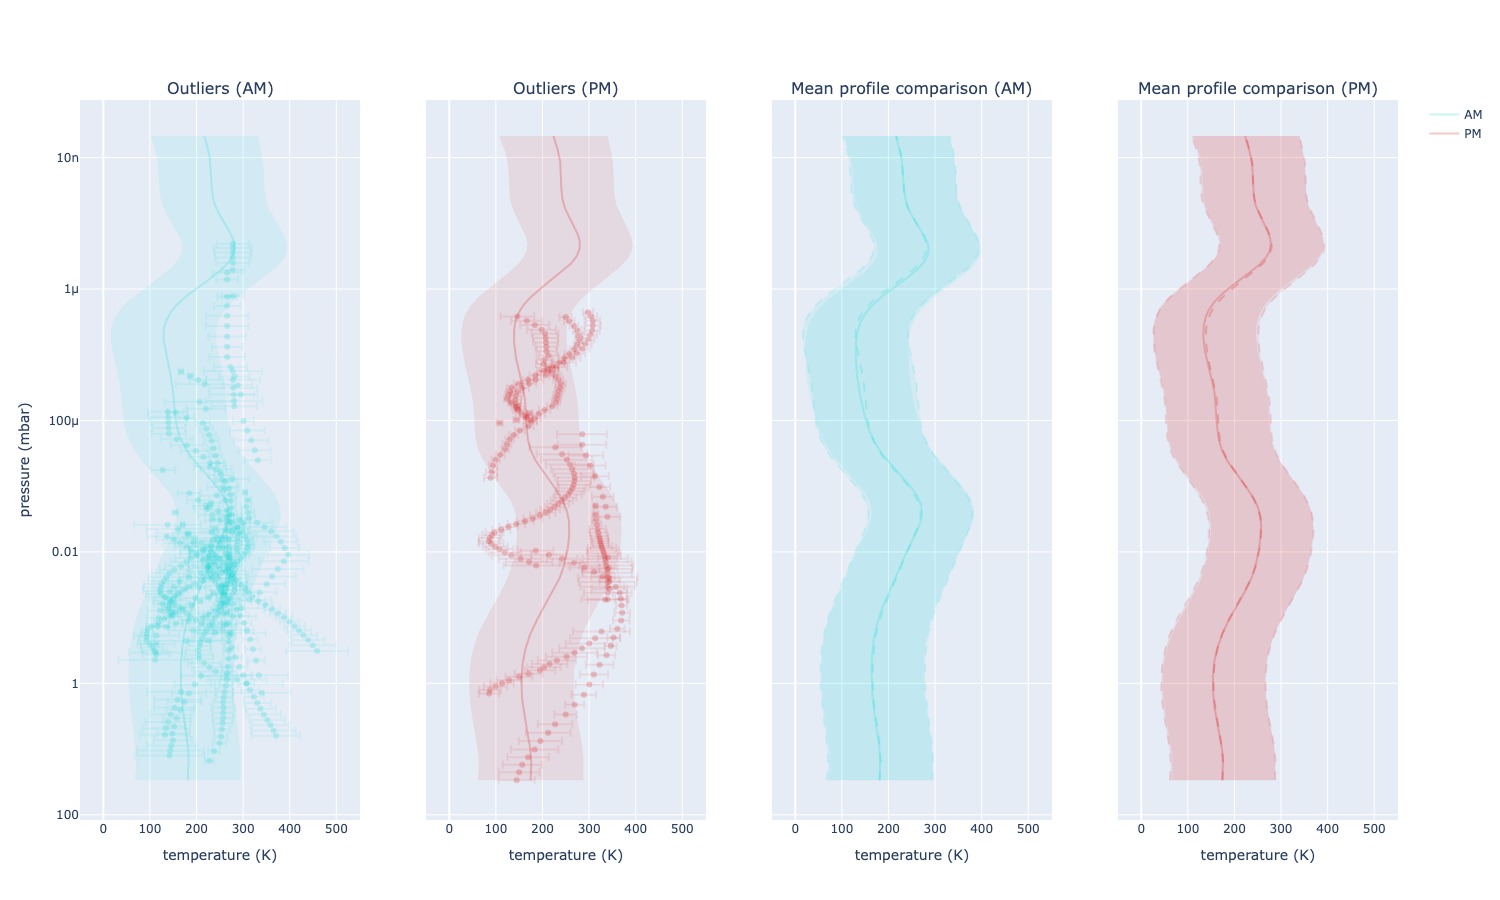
If we remove profiles identified as outliers, we can learn a more precise estimation of the mean profiles, as shown in Figure 4. We can then iteratively alternate between phases where we compute mean profiles from the remaining profiles and phases where we identify new outliers based on the updated mean profiles. 

Fig. 4: Left: Outlier profiles identified for both local solar times after the first iteration of the algorithm. Right: If we remove these outliers and retrain the multi-task GP, we obtain slightly different mean profiles compared to the ones computed on the whole dataset (previous mean profiles represented with dashed lines, new mean profiles represented with full lines). 

As with any framework used to identify outliers, this approach requires expert knowledge, both to identify outliers in the 3D representation of the dataset at each step and to know when to stop the procedure. However, seeing the dataset as a 3D distribution of points facilitates the process tremendously. Using metrics also eliminates possible biases and errors by providing an objective ordering of atypical profiles. E.g.: if an expert classifies a profile with neg-likelihood 50 as an outlier, then we can expect that profiles with neg-likelihood above 50 should be outliers too. 

Conclusion 

We propose a novel probabilistic framework to identify outliers in atmospheric profiles measured with uncertainty. By applying it to the SOIR dataset, we can both validate the methodology and provide the spatial aeronomy community with a deeper understanding of the data. 

Even though we discussed the interest of removing outliers from the dataset, we must also emphasise that those outliers are not to be fully discarded. In the end, these atypical profiles may provide information about rare phenomena in the atmosphere, calibration issues in the measurement device, or regions of Venus that are under-represented in the dataset. 

By providing atmospheric scientists with objective metrics and clear visualisations of the data at hand, this methodology enables easier analysis of typical profiles, as well as prioritisation of profiles worth investigating. This step is crucial to help researchers get from observation data to atmospheric knowledge. 

References 

  • [1] Mahieux, A., Robert, S., Piccialli, A., Trompet, L., & Vandaele, A. C. (2023). The SOIR/Venus Express species concentration and temperature database: CO2, CO, H2O, HDO, H35Cl, H37Cl, HF individual and mean profiles. Icarus, 405, 115713. https://doi.org/10.1016/j.icarus.2023.115713 
  • [2] Leroy, A., Latouche, P., Guedj, B., & Gey, S. (2020). Cluster-Specific Predictions with Multi-Task Gaussian Processes. arXiv. https://doi.org/10.48550/ARXIV.2011.07866 


How to cite: Lejoly, S., Piccialli, A., Mahieux, A., Vandaele, A. C., and Frénay, B.: Probabilistic detection of outliers in Venusian atmospheric profiles from VEx/SOIR, Europlanet Science Congress 2026, The Hague, The Netherlands, 7–11 Sep 2026, EPSC2026-913, https://doi.org/10.5194/epsc2026-913, 2026.

09:24–09:36
|
EPSC2026-1165
|
ECP
|
On-site presentation
Sonia Borsi, Elena Donini, and Francesca Bovolo

Ongoing planetary missions and future endeavors, such as JUICE to the Jovian moons, EnVision to Venus, and envisioned missions to the moons of Uranus, highlight the growing importance of Radar Sounders (RSs) for planetary science. RSs are active remote sensors capable of imaging dielectric discontinuities in the subsurface and recording them in depth images known as radargrams. While manual radargram analysis has led to important discoveries, such as the evolution of Martian troughs [1], efficiently exploiting the increasingly vast RS datasets necessitates automated methods. Currently, most automated approaches focus on segmentation or detection of linear reflections, yet there remains a need for methods that can analyze and semantically aggregate radargrams performing a large scale analysis.

We conduct large scale analysis by leveraging on Martian RS data as a primary planetary analogue for future planned and envisioned missions to the icy moons of Jupiter and Uranus. We utilize Shallow Radar (SHARAD) data [5] acquired over the North Polar Layered Deposits (NPLD) (latitude > 77.5°). SHARAD achieves a vertical resolution of about 15 m in vacuum with a maximum penetration of about 1 km [6]. At the NPLD, SHARAD images icy targets, characterized by horizontal stratigraphy and oblique structures, that closely resemble the data expected from future and envisioned RS missions. Our analysis focuses on mapping troughs, which are depressions following a spiral pattern with depths of 400-1000 m [1]. Troughs expose the NPLD internal stratigraphy and record Martian climate processes within the Trough Migration Paths (TMPs). TMPs are subsurface unconformities that trace the trough displacement since their formation [2]. Their development followed distinct evolutionary paths across eight geographical regions, each characterized by unique morphological traits of TMPs and troughs.

We selected 488 EDR SHARAD radargrams that are processed with squinted SAR focusing [7]. This approach optimizes the detection of non-horizontal reflections by aligning the RS line of sight with the subsurface dipping interfaces, such as trough walls and TMPs, which might otherwise be poorly resolved. We consider 11 squint angles, ranging from -2.5° to +2.5° in 0.5° steps. Radargrams are partitioned into patches of dimension 512 x 128 x 11, in the range, azimuth, and squint angle directions, and are divided into training and validation sets of 6,871 and 2,017 patches, respectively. Each patch is linked to one of the NPLD region [3] based on the morphological characteristics of the troughs and TMPs in the patch.

Given a query radargram imaging a trough and/or a TMP, the goal is to retrieve radargrams with similar geological signatures, enabling the mapping of known and previously uncharacterized troughs and TMPs across the NPLD [3]. The task is addressed using the Content-Based Image Retrieval (CBIR) method in [4], where a Masked Autoencoder (MAE)[8], composed of a Vision Transformer (ViT) encoder [9] and a lightweight decoder, is trained in a self-supervised manner using a reconstruction proxy task. By reconstructing missing parts of the radargrams from their surrounding context, the model learns compact embeddings that encode the morphology of troughs, horizontal stratigraphy, and TMPs. Multi-squint radargrams are incorporated as input channels, providing the network with a physics-aware and multi-view representation that enhances oblique features. In inference, the pre-trained encoder maps each radargram into an embedding space where those with similar surface and subsurface signatures are grouped together. Retrieval is performed by ranking all embeddings in the validation set by cosine similarity with the selected query.

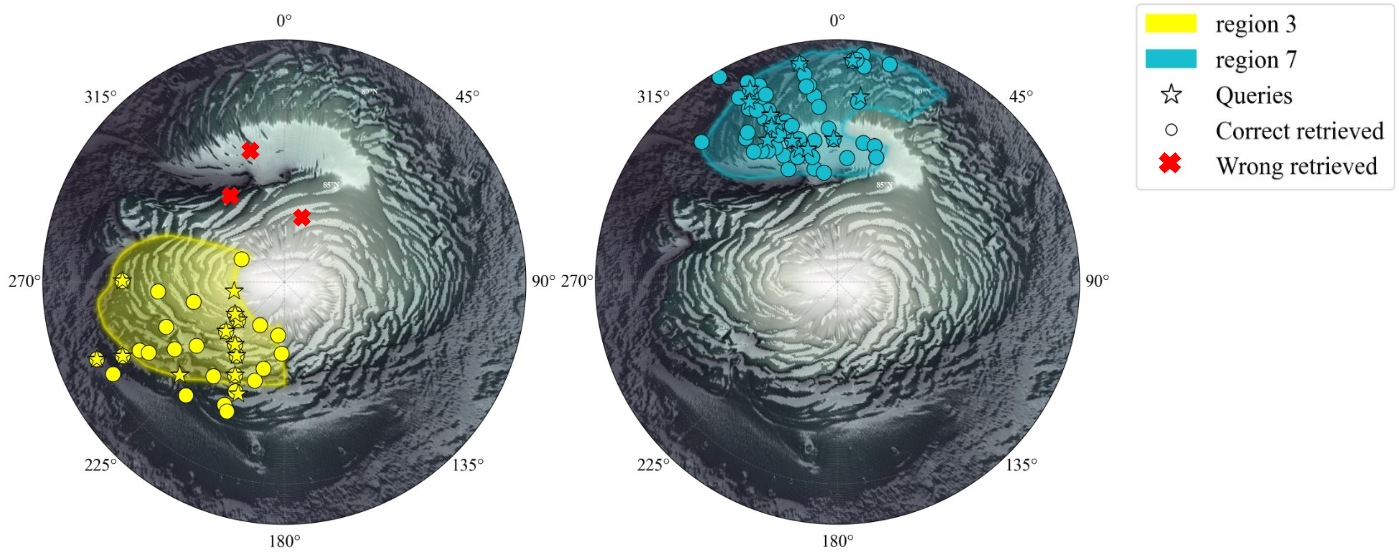
The proposed method achieves a mean Average Precision (mAP) of 67.15% across the eight regions on the validation set. Figure 1 shows a representative query from region 5 and its five most similar retrievals, which exhibit trough and TMP patterns consistent with those of the query. Figure 2 presents maps of 15 representative trough queries from NPLD regions 3 and 7, together with their top-5 retrievals projected onto the MOLA topographic map. Most retrievals cluster within the corresponding query region, indicating that the method captures region-specific trough and TMP characteristics. Misretrievals mainly occur near region boundaries, likely reflecting both annotation uncertainty and similarity between geological features across adjacent regions.

The results demonstrate that the proposed method facilitates large-scale subsurface mapping of troughs and TMPs by efficiently processing vast RS datasets. The method distinguishes between subtly different trough and TMP morphologies, effectively categorizing them in the distinct regions. This approach provides a tool for the large-scale analysis of subsurface data, supporting the management of the vast datasets expected from future and envisioned missions to the icy moons of Jupiter and Uranus. In these contexts, where specific geological targets may be unknown, grouping them by semantic similarity helps identify recurrent subsurface features.

Figure 1: Query radargram and five most similar retrievals from Region 5.


Figure 2: Retrieval maps for NPLD regions 3 and 7. Queries (stars), correct retrievals (circles), and incorrect retrievals (crosses) are shown.

References

[1] Smith, I. B., et al. (2013), The spiral troughs of Mars as cyclic steps, J. Geophys. Res. Planets, 118.

[2] Smith, I., Holt, J. (2010), Onset and migration of spiral troughs on Mars revealed by orbital radar,  Nature, 465.

[3] Smith, I. B., and J. W. Holt (2015), Spiral trough diversity on the north pole of Mars, as seen by Shallow Radar (SHARAD),  J. Geophys. Res. Planets, 120. 

[4] Donini, E., et al. (2026), A deep learning method for dual-frequency radar sounder data retrieval, in Proc. IEEE Int. Geosci. Remote Sens. Symp. (IGARSS). 

[5] Seu, R.,et al. (2007), SHARAD sounding radar on the Mars Reconnaissance Orbiter, J. Geophys. Res., 112.

[6] Croci, R., et al. (2011), The Shallow Radar (SHARAD) on board the NASA MRO mission, Proceedings of the IEEE, vol. 99.

[7] Ferro, A. (2019), Squinted SAR focusing for improving automatic radar sounder data analysis and enhancement, International Journal of Remote Sensing.

[8] He, K., X. Chen, S. Xie, Y. Li, P. Dollár, and R. Girshick (2022), Masked autoencoders are scalable vision learners, IEEE/CVF Conference on Computer Vision and Pattern Recognition (CVPR).

[9] Dosovitskiy, A., et al. (2021), An image is worth 16x16 words: Transformers for image recognition at scale, International Conference on Learning Representations (ICLR)

How to cite: Borsi, S., Donini, E., and Bovolo, F.: Towards Large-Scale Mapping of Subsurface Targets: Case Study of Spiral Troughs, Europlanet Science Congress 2026, The Hague, The Netherlands, 7–11 Sep 2026, EPSC2026-1165, https://doi.org/10.5194/epsc2026-1165, 2026.

09:36–09:48
|
EPSC2026-1016
|
ECP
|
On-site presentation
Yaqiong Wang, Daniel Hestroffer, and Huan Xie

Accurate gravity modeling near the surfaces of small solar system bodies remains one of the core challenges for spacecraft proximity operations, as demonstrated by missions such as Hayabusa2 at Ryugu [1] and OSIRIS-REx at Bennu [2]. Existing approaches, including polyhedral gravity models [3], mascon grids[4], and neural density fields [5,6], face trade-offs between computational cost, geometric flexibility, and physical interpretability. Near-surface gravity accuracy is particularly critical for safe landing and sample collection, yet most methods degrade rapidly as altitude decreases.

We present GaussGrav, a gravity field model that represents a small body's interior as a cloud of learnable three-dimensional Gaussian density blobs. Each Gaussian carries a peak density parameter and a size parameter; their collective density field implicitly encodes the body's internal mass distribution, and the gravitational acceleration at any external point is computed analytically from this representation. The model is trained purely from simulated accelerometry observations and adapts through a densification strategy that progressively concentrates resolution in high-density regions.

We evaluate GaussGrav on two well-studied asteroid analogues: Eros (a highly elongated S-type body) and Bennu (a rubble-pile B-type body with pronounced mass heterogeneity). At an altitude of 5% of the body's characteristic radius, GaussGrav achieves a mean relative acceleration error below 0.11%, representing an improvement of one to two orders of magnitude over a mascon grid approach [4]. For Bennu, the learned density field recovers the rank ordering of regional densities with a Spearman correlation of 0.87 against the heterogeneous mass distribution inferred fromOSIRIS-REx radio science data [2].

These results suggest that a Gaussian density formulation offers a promising path toward simultaneous gravity inversion and internal structure inference, with particular advantages for surface-proximity navigation in future small body missions.

References

[1] Watanabe, S., et al. (2019). Hayabusa2 arrives at the carbonaceous asteroid 162173 Ryugu. Science, 364, 268–272.

[2] Scheeres, D.J., et al. (2020). Heterogeneous mass distribution of the rubble-pile asteroid (101955) Bennu. Science Advances, 6, eabc3350.

[3] Werner, R.A., & Scheeres, D.J. (1997). Exterior gravitation of a polyhedron derived and compared with harmonic and mascon gravitation representations of asteroid 4769 Castalia. Celestial Mechanics and Dynamical Astronomy, 65, 313–344.

[4] Fanti, E., & Izzo, D. (2025). MasconCube: Fast and accurate gravity modeling with an explicit representation. arXiv:2509.08607.

[5] Izzo, D., & Gómez, P. (2022). Geodesy of irregular small bodies via neural density fields. Communications Engineering, 1, 48.

[6] Martin, J.R., & Schaub, H. (2022). Physics-informed neural networks for gravity field modeling of small bodies. Celestial Mechanics and Dynamical Astronomy, 134, 46.

How to cite: Wang, Y., Hestroffer, D., and Xie, H.: GaussGrav: Gravity Field and Density Reconstruction of Small Bodies via Learnable 3D Gaussian Densities, Europlanet Science Congress 2026, The Hague, The Netherlands, 7–11 Sep 2026, EPSC2026-1016, https://doi.org/10.5194/epsc2026-1016, 2026.

09:48–10:00
|
EPSC2026-26
|
ECP
|
On-site presentation
Louis-Alexandre Lobanov and Hilary Downes

Iron meteorites are remnants of planetesimal cores, revealing planetary formation processes and the history of the early solar system (Scott, 2020). Currently, the Meteoritical Bulletin Database contains 1445 iron meteorites. Genetic relationships between iron meteorites reveal samples related by formation on the same parent body or in similar bodies in the same region of the solar system (Krot et al., 2014). This can also help to determine a minimum value for the number of differentiated planetesimals that were present in the early solar system. Additionally, knowing which meteorites come from the same parent body allows the study of processes such as fractional crystallisation in the core of the parent body. Classification of iron meteorites is based on major, minor and trace element patterns. Traditionally, iron meteorites have been manually classified using two-dimensional element plots, usually element-Ni or element-Au diagrams. We present here the first study applying machine learning to the classification of iron meteorites (Lobanov and Downes, 2026), which allows for the automated classification in multi-element space using cluster analysis.

The first step involved compiling published iron meteorite compositional data from 67 publications from 1967 to 2023. This resulted in a database with 2,396 individual chemical analyses, covering 880 separate iron meteorites. Each analysis reported a different set of elements, and Figure 1 shows the totals of how many data points are available for each element. 

Figure 1: Bar graphs that show a) the number of analyses in the database per element. b) the number of individual meteorites for every element.

We used unsupervised machine learning, which does not require a training dataset. This is important in a situation with limited and variable available data, and also means the model is not based on any assumptions of the size and limits of currently known iron meteorite groups. This also reduces biases from the existing classification and allows independent verification of the current classification of iron meteorites. Cluster analysis is a form of unsupervised machine learning that can be used to partition data into distinct groups, where the points in a group are as similar as possible, but with groups as distant from each other as possible (Xu and Tain, 2015). Many models can be used for cluster analysis, and after theoretical considerations and numerous trials, we found that hierarchical density-based cluster analysis provided the best results (Lobanov and Downes, 2026). Density-based cluster analysis was applied successfully to the iron meteorite dataset, as the model adheres to density trends in multidimensional space for finding clusters and can therefore adapt to the irregular shapes of the clusters, and different groups being of different sizes and densities. Unlike other clustering algorithms, it does not assume that clusters are of similar sizes or spherical, and no knowledge of the number of clusters is required (Xu and Tain, 2015).

In tests on grouped data, the 7-element model (Ni, Ga, Ge, Ir, Au, As, Co) achieved an Adjusted Rand Index (ARI) of 0.98 (Figure 2), with other element models reaching up to an ARI of 0.992, demonstrating almost perfect reproduction of the existing classification for iron meteorites (Lobanov and Downes, 2026). Seven different element combinations were used in this study, based on data availability, using up to 10 elements simultaneously. Next, the models treated a suite of ungrouped iron meteorites in the same way as the already-classified meteorites. Twenty-nine of these ungrouped iron meteorites were classed by the models as being related to existing groups, based on the combination of 350 runs from the 7 different element combinations. These results propose that twenty-nine ungrouped iron meteorites are related to existing groups based on the available geochemical data and these new classifications will be proposed to the Nomenclature Committee of the Meteoritical Society.

Figure 2: 3-dimensional scatter plot with the results of clustering a smaller grouped dataset with the 7-element model, replicating the existing classification with an ARI of 0.98. Ni is in mg/g and Ga and Ge in μg/g.

This study presents a completely novel way to classify iron meteorites using unsupervised machine learning. Cluster analysis has an immense potential as a new methodology for the unbiased, fast, transparent, reproducible and adaptable classification of iron meteorites. It can be used to verify the existing classification, to classify new iron meteorites, to classify ungrouped meteorites, and to find new groups. As the model is very versatile and adaptable, we hope that it will be implemented in future classifications of iron meteorites and are open to collaborations for the classification.

Machine learning methodologies have an enormous potential to be used by the planetary science community and are currently underused. We hope that in the future our methodology can be used for applications on other meteorite groups. The detailed machine learning methodology, source code, and compiled dataset are available in Lobanov and Downes (2026) and the supplementary materials.

Acknowledgements: We thank the Paneth Trust, administered by the Royal Astronomical Society, for the grant given to Louis-Alexandre Lobanov, enabling him to complete this research.

References:

Krot, A.N., Keil, K., Scott, E.R.D., Goodrich, C.A., Weisberg, M.K., 2014. Classification of Meteorites and Their Genetic Relationships, in: Holland, H.D., Turekian, K.K. (Eds.), Treatise on Geochemistry (Second Edition). Elsevier, Oxford, pp. 1–63. https://doi.org/10.1016/B978-0-08-095975-7.00102-9

Lobanov, L.-A., Downes, H., 2026. An Unsupervised Machine Learning Approach to Iron Meteorite Classification (in press). Meteoritics and Planetary Science.

Scott, E.R.D., 2020. Iron Meteorites: Composition, Age, and Origin, in: Oxford Research Encyclopedia of Planetary Science. https://doi.org/10.1093/acrefore/9780190647926.013.206

Xu, D., Tian, Y., 2015. A Comprehensive Survey of Clustering Algorithms. Ann. Data. Sci. 2, 165–193. https://doi.org/10.1007/s40745-015-0040-1

How to cite: Lobanov, L.-A. and Downes, H.: Cluster Analysis of Iron Meteorites: Applications for Unsupervised Machine Learning, Europlanet Science Congress 2026, The Hague, The Netherlands, 7–11 Sep 2026, EPSC2026-26, https://doi.org/10.5194/epsc2026-26, 2026.

Posters: Tue, 8 Sep, 18:00–19:30 | Foyer 3

Display time: Tue, 8 Sep, 08:30–19:30
ML and AI in Planetary Science in the age of Big Data: Poster Session
F3.40
|
EPSC2026-76
|
On-site presentation
Valerio Carruba, Safwan Aljbaae, Gabriel Caritá, Rita C. Domingos, Mansur Bala, Robson Pedroso, and Eduardo Delfino

Mean-motion resonances (MMRs) play a central role in shaping the dynamical evolution of small bodies in the solar system. In Near-Earth Object (NEO) populations, identifying resonant configurations is particularly challenging due to the large number of possible resonances and the chaotic nature of asteroid orbits. Traditional methods rely on computing and inspecting resonant arguments for many candidate resonances, which becomes computationally expensive for large datasets.

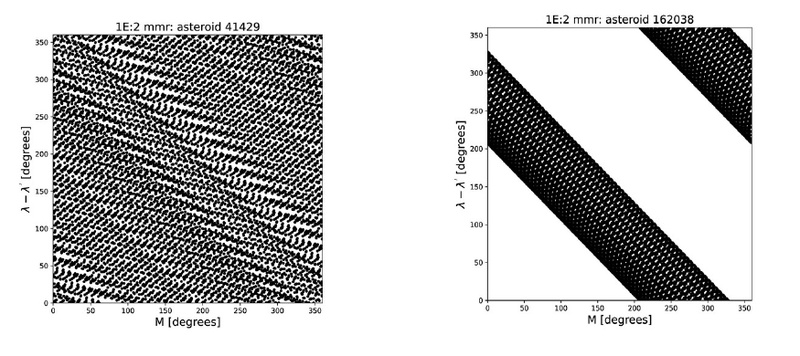
Fig. 1: Examples of orbits in circulating and librating state in the (σ, M) phase space

To address this challenge, we present ML-FAIR, a fully automated machine-learning implementation of the Fast Identification of Mean-Motion Resonances (FAIR) method (Forgács-Dajka et al. 2018). FAIR exploits the geometric structure of resonant motion in the (σ, M) phase space, where σ is either λₚ−λ for inner resonances or λ−λₚ for outer resonances, with p denoting a planet, and M the asteroid mean anomaly. Instead of directly analyzing resonant arguments, it identifies resonance configurations through characteristic stripe patterns in angular plots. The number of stripe intersections with coordinate axes encodes the resonance integers, enabling rapid identification of candidate resonances (see Fig. 1).

ML-FAIR transforms this geometrical method into a scalable pipeline using unsupervised machine learning. Resonance detection is recast as identifying structured patterns in angular distributions. Two variables, σ@(M = 0) and M@(σ = 0), capture the angular intersections that define the FAIR method. A density-based pre-classification separates circulating (non-resonant) orbits from candidate resonant cases using angular coverage metrics, automatically discarding a large fraction of non-resonant objects.

For the remaining objects, ML-FAIR applies unsupervised clustering techniques to detect peaks in angular distributions. We tested DBSCAN, OPTICS, and circular kernel density estimation (KDE). KDE with peak detection performed best overall, especially for complex or switching orbits, while OPTICS complements it in ambiguous cases. An ensemble of both methods provides robust identification of peak structures corresponding to stripe intersections.

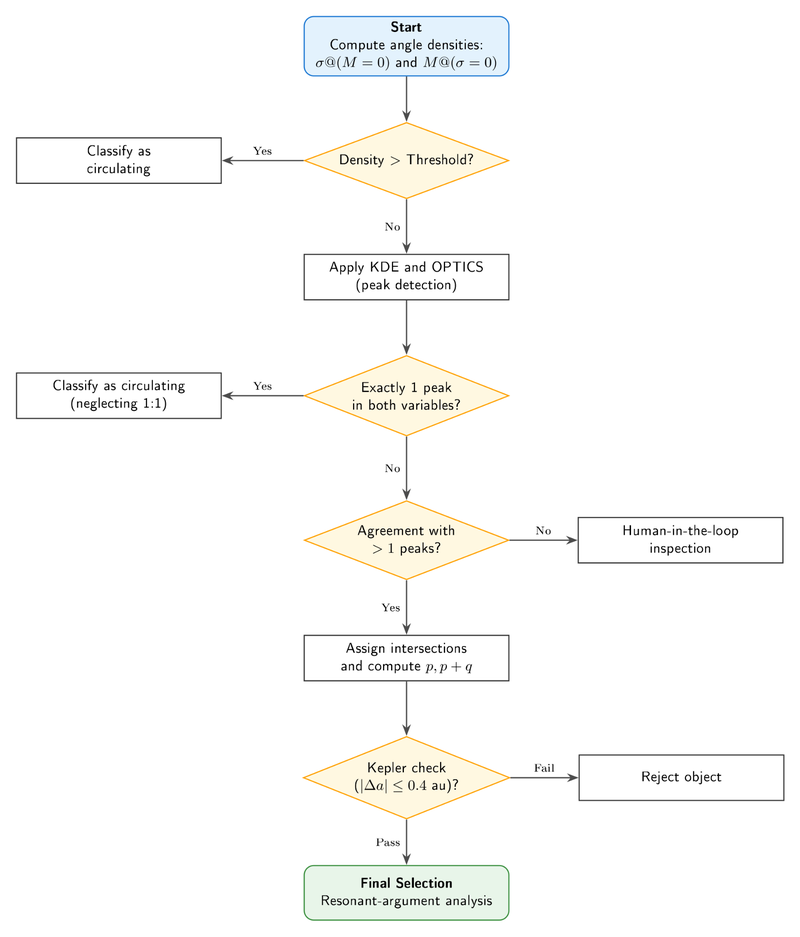
Fig. 2: Flowchart of the machine-learning-enhanced FAIR procedure.

The ML-FAIR pipeline proceeds through the following (see Fig. 2):

(1) density-based classification of circulating orbits;

(2) peak detection via clustering methods;

(3) decision logic combining multiple algorithms;

(4) reconstruction of resonance ratios; and

(5) a physical consistency assessment based on orbital parameters. Objects that pass all steps are then validated through traditional resonant-argument analysis.

We apply ML-FAIR to the Atira and Aten asteroid populations (a < 1 au), which interact with a dense “forest” of resonances with terrestrial planets. Our dataset consists of thousands of numerically integrated orbits, evolved under the influence of all planets and the Moon. Due to the chaotic nature of NEOs, integrations were limited to ~1200 years, already exceeding typical Lyapunov timescales.

The results indicate that ML-FAIR automatically screens more than 85% of cases, drastically reducing the need for manual inspection. For the remaining candidates, the method provides resonance ratio estimates that are subsequently confirmed through resonant-argument analysis.

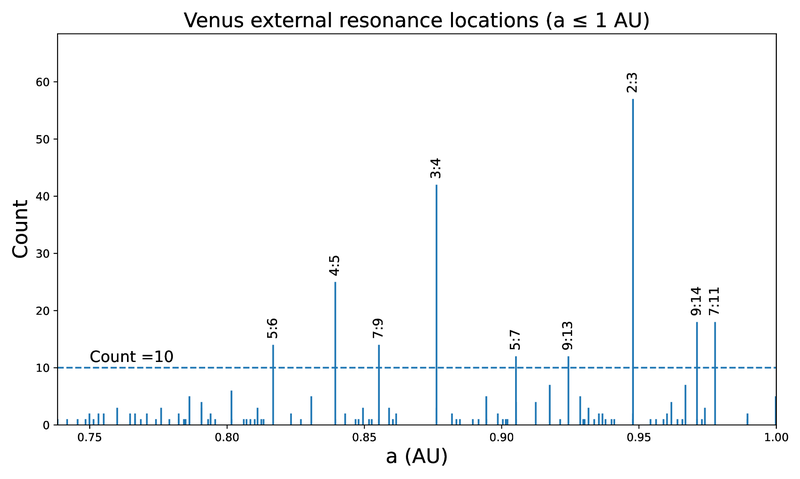
Comparison with established long-timescale resonance-identification techniques (Smirnov 2023) shows strong qualitative agreement, with both approaches identifying similar populations in the main resonances with terrestrial planets and only minor discrepancies in a few higher-order cases (Fig. 3). This confirms that ML-FAIR preserves the reliability of traditional methods while significantly improving efficiency.

Fig. 3: Location in the (a, count) plane of the external MMR with Venus identified by ML-FAIR. Resonances with 10 or more asteroids are labeled. The horizontal dashed line shows the level at which the count equals 10.

ML-FAIR enables efficient, automated detection of resonances in large NEO datasets, a key capability for upcoming surveys such as the Legacy Survey of Space and Time (LSST), which will dramatically increase the number of known NEOs.

References

  • Carruba V, Aljbaae S, Caritá G, Domingos RC, Bala MM, Pedroso RDZ, and Delfino EMDS (2026) ML-FAIR: an automated machine-learning framework for the fast identification of eccentricity-type mean-motion resonances. CMDA (under review).

  • Forgács-Dajka E, Sándor Z, Érdi B (2018). A fast method to identify mean motion resonances. MNRAS 477, 3383.

  • Smirnov E (2023) A new Python package for identifying celestial bodies trapped in mean-motion resonances. Astronomy and Computing 43, A100707.

How to cite: Carruba, V., Aljbaae, S., Caritá, G., C. Domingos, R., Bala, M., Pedroso, R., and Delfino, E.: ML-FAIR: an Automated Machine-Learning Framework for the Fast Identification of Eccentricity-Type Mean-Motion Resonances, Europlanet Science Congress 2026, The Hague, The Netherlands, 7–11 Sep 2026, EPSC2026-76, https://doi.org/10.5194/epsc2026-76, 2026.

F3.41
|
EPSC2026-350
|
On-site presentation
Yun Lu

In microwave sensing applications such as ground-penetrating radar (GPR), a central objective is to determine whether the measured scattering response originates from surface clutter or subsurface structures. This task is challenging because the observed signals are highly sensitive to measurement conditions, propagation effects, and environmental variability, making direct interpretation based on fixed reference signatures unreliable. Conventional approaches either rely on physics-based inversion, which is often ill-posed and computationally demanding, or employ data-driven learning models that may achieve strong empirical performance but offer limited physical interpretability.

In this work, we propose a physically grounded framework for scattering analysis based on a structured representation of the scattering process. Specifically, a morphological scattering spectrum is introduced as a latent representation defined over frequency and angular domains, whose structure is derived from the underlying physics of wave propagation. Rather than learning representations directly from data, the proposed approach formulates the problem as the estimation and tracking of this physically defined state. In this interpretation, machine learning is used to infer the occupancy and statistical organization of the latent representation, while the representation geometry itself remains constrained by the admissible scattering physics.

For practical applications, the estimated morphological scattering spectrum provides a compact and interpretable description of the dominant scattering mechanisms present in the observations. Surface and subsurface responses are expected to exhibit distinct occupancy patterns and structural characteristics within this representation, enabling robust discrimination between ground and underground targets. By combining physically defined representations with data-driven statistical inference, the proposed framework offers a principled approach for classification and interpretation in complex scattering environments.


How to cite: Lu, Y.: Radar On-Site Calibration and Scattering Analysis by Physics-Defined Machine Learning, Europlanet Science Congress 2026, The Hague, The Netherlands, 7–11 Sep 2026, EPSC2026-350, https://doi.org/10.5194/epsc2026-350, 2026.

F3.42
|
EPSC2026-701
|
ECP
|
On-site presentation
Raphaël Müller, Michele Lissoni, and Alain Doressoundiram

High-albedo crater rays are prominent surface features on both the Moon and Mercury. Radiating out from the progenitor craters, they are most frequently formed by immature terrain unearthed by secondary craters associated with the primary impact (Neish et al. 2013; Elliott et al. 2018).

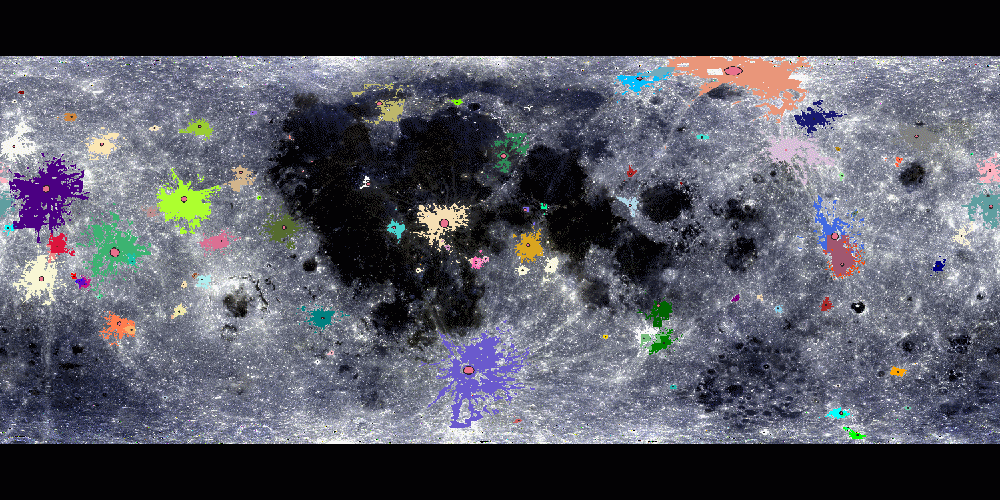
The ejecta rays of Mercury were mapped by Lissoni et al. (2025) using EJMAP, a two-stage supervised deep-learning pipeline trained to not only recognize high-albedo ejecta but also identify their crater of origin. EJMAP was applied to the 665 m px-1 Enhanced Color mosaic of Mercury’s surface developed using multispectral imagery from the MDIS instrument of the MESSENGER mission (Denevi et al. 2009).

We build upon this work and evaluate how the deep learning model behaves on a different planetary body: the Moon. We applied it to a 399 m px-1 Hapke-corrected reflectance mosaic covering latitudes 70°N to 70°S generated from imagery from the Lunar Reconnaissance Orbiter Wide Angle Camera (Sato et al. 2017). We selected 100 craters with well-defined high-albedo ejecta and prepared a training dataset of ~150 224x224 px mosaic tiles where the ejecta of the craters were mapped manually. The EJMAP pipeline was then retrained from scratch on these lunar data, and a global ejecta map was produced. The EJMAP configuration used on Mercury reaches on the Moon a pixel-level F1-score of 0.647. Building on this baseline, the next step has been to revisit the pipeline itself by testing alternative architectures, loss functions and class-imbalance strategies, aimed at improving performance on both lunar and, eventually, Mercurian data. Several hyperparameter optimisation methods are being deployed in parallel such as Bayesian search, Hyperband pruning, and alternative loss families to systematically explore the search space.

A second part of the work consists in simulating the hyperspectral imagery of Mercury that will be produced by the SIMBIO-SIS/VIHI instrument (Cremonese et al. 2020) during the orbital phase of the BepiColombo mission. To this end, a multilayer perceptron neural network is under development to map the MDIS 8-band spectra to a VIHI-like 6-nm spectral resolution. This model is trained using spectra measured by MESSENGER MASCS/VIRS hyperspectral instrument (Cornet et al. 2022) and co-located with the MDIS global mosaic. Our aim is to produce a simulated VIHI hyperspectral mosaic of Mercury ahead of real BepiColombo data and use it to further improve the performance of EJMAP.


References

Cornet et al. 2020. Mercury 2022, 71-71.

Cremonese et al. 2020. Space Science Reviews, 216(5), 75

Denevi et al. 2009. Science, 324(5927), 613-618

Elliott et al., 2018. Icarus, 312, 231-246

Lissoni et al. 2025. EPSC-DPS2025-256

Neish et al., 2013. JGR: Planets, 118(10), 2247-2261

Sato et al. 2017. Icarus, 296, 216-238.

How to cite: Müller, R., Lissoni, M., and Doressoundiram, A.: Deep learning model for crater ray mapping on Mercury: application to the Moon and preparation for hyperspectral BepiColombo imagery, Europlanet Science Congress 2026, The Hague, The Netherlands, 7–11 Sep 2026, EPSC2026-701, https://doi.org/10.5194/epsc2026-701, 2026.

F3.43
|
EPSC2026-949
|
ECP
|
On-site presentation
Riccardo La Grassa, Pamela Cambianica, Cristina Re, Gabriele Cremonese, Adriano Tullo, Natalia Amanda Vergara Sassarini, and Emanuele Simioni

Introduction

The lunar polar regions, specifically those latitudes exceeding 70° North and South, harbor permanently shadowed regions (PSRs) that function as cold traps for volatile species. These environments are critical for reconstructing the impact history of the Moon and understanding the delivery mechanisms of water ice in the inner Solar System. However, the characterization of small-scale crater populations within PSRs remains a formidable challenge due to the extreme dynamic range of lighting and the limitations of traditional topographic datasets. This study proposes a multimodal approach that bridges the gap between computer vision and planetary geomorphology. Building upon the foundational detection capabilities of YOLOLens (1) and our previous large-scale mapping of Lunar and Hermian global crater catalogs (2, 3), we introduce YOLOLens2.0. By synthesizing high-resolution ShadowCam imagery with this refined architecture and an advanced 3D thermo-physical model, we investigate the morphometric evolution of polar terrains and their capacity to preserve volatile deposits over geological timescales.

Deep Learning Framework: YOLOLens2.0 and Super-Resolution

A primary obstacle in polar geomorphologic analysis is the degradation of signal-to-noise ratios in secondary-light-illuminated terrains. To address this, we utilize YOLOLens2.0, an end-to-end deep learning framework specifically engineered for the detection and characterization of craters in challenging illumination environments. At the core of this system is a Dense-Residual-Connected Transformer (DRCT) module designed for multimodal super-resolution (SR). Unlike standard SR techniques, YOLOLens2.0 employs detection-driven supervision, where the reconstruction of high-frequency topographic details is guided by the semantic requirements of the detection head. Our experimental results demonstrate that this architecture leads to an absolute recall increase from 76.90 % to 89.20% when the super-resolution is activated and a significant gain in mAP@50-95 (reaching 0.605). By sharpening gradients and reconstructing meter-scale features from upscaled Kaguya and DTM data, the SR module provides discriminative features that allow for the identification of sub-kilometer craters with unprecedented precision. The application of this framework to ShadowCam imagery (0.9 m/pixel) facilitates the creation of high-fidelity, georeferenced crater catalogs, providing the statistical robustness required for subsequent morphometric analysis.

3D Thermo-Physical Modeling and Environmental Simulation

To contextualize the observed morphology, the illumination and thermal evolution of the polar terrains were simulated using a three-dimensional thermo-physical model (4). This framework, originally developed for the extreme environments of Mercury’s polar craters, was rigorously adapted to lunar boundary conditions. The model integrates high-resolution digital terrain models (DTMs) derived from LOLA topography with time-dependent solar illumination calculations. We evaluate local incident fluxes under realistic Sun–terrain geometries, where shadowing effects produced by complex crater morphology and surrounding ridges are explicitly computed through facet-based ray-tracing techniques. The resulting illumination fields serve as the primary input for a one-dimensional thermal model that solves the surface energy balance and subsurface heat conduction for each terrain facet. By reconstructing the spatial and temporal evolution of surface and subsurface temperatures, we can delineate the precise boundaries of thermal stability for various volatile species.

Morphometric Analysis and Geological Implications

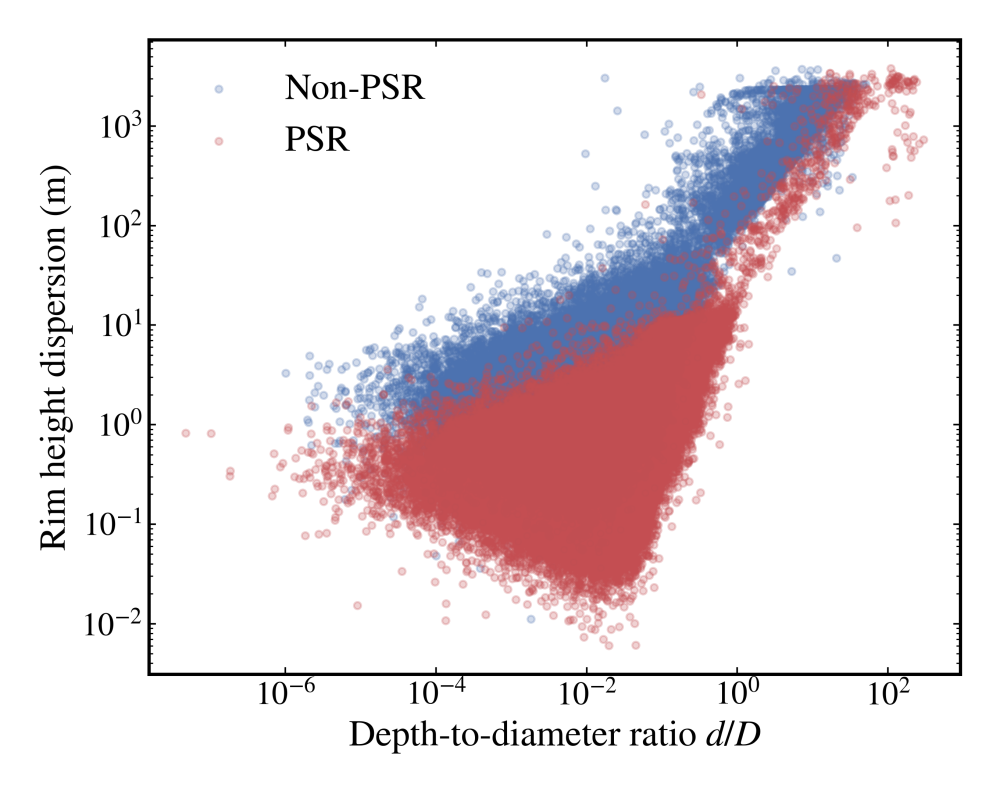
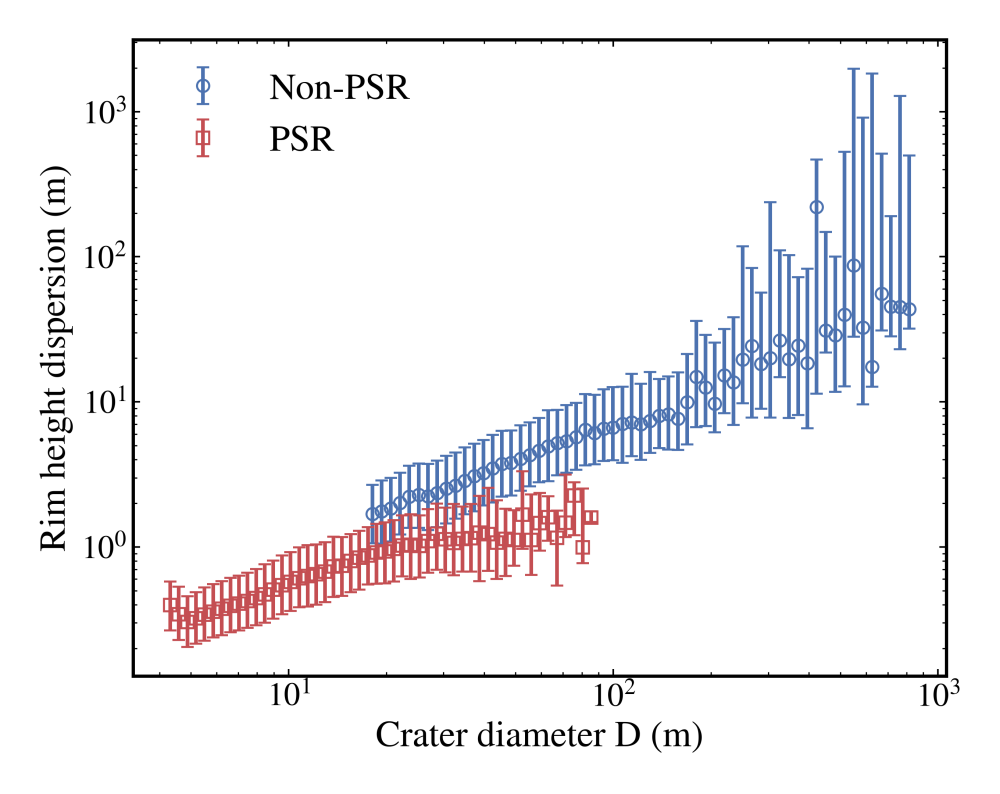
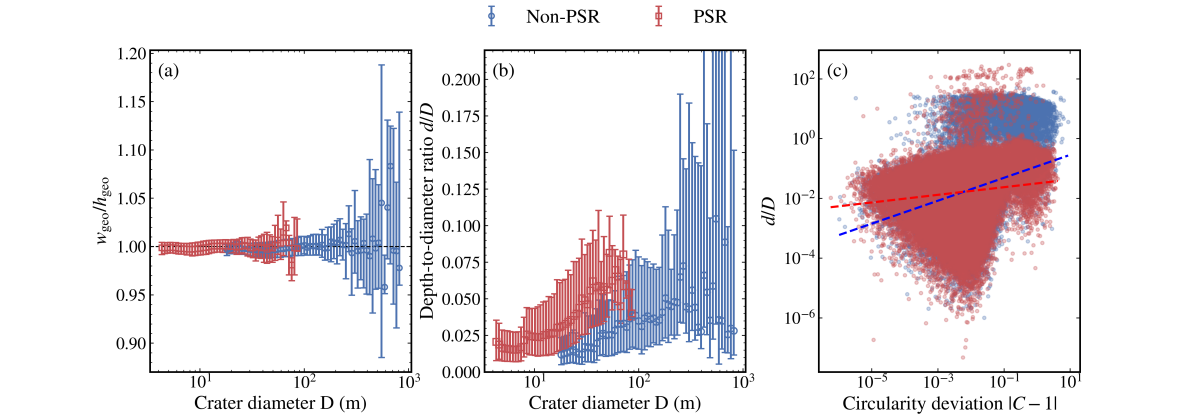
The investigation focuses on the morphometric properties of craters across the 70˚ to 90˚ latitude bands. We focus on depth-to-diameter (d/D) ratios, rim heights, and interior slope distributions to quantify the state of topographic degradation. Our findings indicate a significant scale-dependent divergence in crater morphology between PSR-hosted populations and those in sunlit regions. While large-scale craters (>1 km) typically exhibit advanced degradation states consistent with long-term mass wasting and micrometeoroid gardening, small-scale craters (<1 km) within PSRs show anomalously high d/D ratios. These fresh signatures suggest that the extreme cold-trapping environment may actively suppress certain degradation mechanisms. Specifically, the absence of extreme diurnal temperature swings within PSRs likely inhibits thermal fatigue, a process known to drive regolith mobilization and slope failure on sunlit lunar surfaces. Furthermore, our analysis suggests that these morphologically fresh, deep craters are not randomly distributed but are frequently localized within regions where our 3D model predicts maximum thermal stability. This correlation suggests that the presence of subsurface volatiles or the specific mechanical properties of ice-cemented regolith may play a role in preserving crater geometry. By comparing the d/D distributions of PSR craters against Non-PSR (Figs. 1, 2), we can identify populations that deviate from expected degradation tracks, marking them as high-priority targets for future in-situ volatile prospecting missions.


Fig 1.  Regional crater morphometry analysis. (Left) Ellipticity distributions across varying crater diameters. (Middle) Comparison of depth-to-diameter (d/D) ratios, showing higher values in Permanently Shadowed Regions (PSRs) than in non-PSRs. (Right) d/D ratio as a function of ellipticity (x-axis), indicating consistently higher d/D values within PSRs.
Fig 2.Variation in crater rim heights. (Left) Inhomogeneous rim heights across identical depth-to-diameter (d/D) ratios are more pronounced in non-PSR regions. (Right) A similar trend of rim height inhomogeneity is observed when analyzed as a function of crater diameter (D).


Discussion and Conclusions

AI-driven detection integrated with physical modeling enables multi-layered polar terrain interpretation. The YOLOLens2.0 framework prevents lighting bias in crater statistics, while thermal models provide essential environmental context. Preserved sharp rims and steep slopes serve as geomorphological proxies for volatiles, as thermal stability slows crater degradation. Despite limited DTM resolution and boundary identification uncertainties, this scalable methodology proves that morphological freshness in small-scale craters indicates local thermal and volatile history. This comprehensive framework demonstrates that PSR crater morphometry specifically higher depth-to-diameter ratios links fundamentally to the thermal environment. These findings advance lunar geomorphology and provide a robust, data-driven methodology for selecting Artemis landing sites.


References

  • La Grassa R, et al. "YOLOLens: A deep learning model based on super-resolution to enhance the crater detection of the planetary surfaces." Remote Sensing 15.5 (2023).
  • La Grassa R, et al. "LU5M812TGT: An AI-Powered global database of impact craters≥ 0.4 km on the Moon." ISPRS Journal of Photogrammetry and Remote Sensing 220 (2025).
  • La Grassa R, et al. "From the Moon to Mercury: Release of Global Crater Catalogs Using Multimodal Deep Learning for Crater Detection and Morphometric Analysis". Remote Sens.
  • Cambianica P, et al. "The thermal impact of the self-heating effect on airless bodies. The case of Mercury’s north polar craters." Planetary and Space Science 253 (2024).

How to cite: La Grassa, R., Cambianica, P., Re, C., Cremonese, G., Tullo, A., Vergara Sassarini, N. A., and Simioni, E.: Integrative Morphometric and Thermo-Physical Characterization of Lunar Polar Craters: Leveraging YOLOLens2.0 Deep Learning and 3D Thermal Simulations for Volatile Trap Analysis, Europlanet Science Congress 2026, The Hague, The Netherlands, 7–11 Sep 2026, EPSC2026-949, https://doi.org/10.5194/epsc2026-949, 2026.

F3.44
|
EPSC2026-1019
|
ECP
|
On-site presentation
Akhil Gunessee, Arnaud Mahieux, Séverine Robert, Arianna Piccialli, Ian Thomas, Simon Lejoly, Valentin Delchevalerie, Ann Carine Vandaele, and Benoît Frénay

The SOIR (Solar Occultation in InfraRed) spectrometer onboard Venus Express (VEx) collected high-resolution solar occultation spectra of the Venusian atmosphere from 2006 to 2014. SOIR combines an echelle grating with an Acousto-Optic Tunable Filter (AOTF), the latter enabling the rapid selection of diffraction orders across the 2.2 to 4.3 microns spectral range [1]. Accurate characterisation of the AOTF transfer function (TF) is essential as the TF directly impacts the spectral calibration and the accuracy of the atmospheric retrievals.  


The SOIR AOTF TF was characterised in-flight using dedicated calibration observations of the Sun, called miniscans, during which the AOTF driving radio frequency was stepped across defined frequency intervals centred on deep solar Fraunhofer lines. Because these solar lines are significantly narrower than the AOTF bandwidth, they provide an effective probe of the instrument response function. Early calibration work used 42 miniscans and approximately 250 solar lines distributed across the spectral range to derive the AOTF’s tuning relation and bandpass [2]. A subsequent study introduced a more advanced reconstruction approach based on the combined analysis of multiple solar lines and demonstrated that the SOIR AOTF TF could be approximated using a sum of five sinc2 functions with frequency-dependent coefficients [3]. A later investigation extended the calibration analysis to nearly 300 miniscans available at the time [4]. By the end of the mission in 2014, however, the complete SOIR archive contained nearly 500 miniscans.


Although the analytical multi-sinc2 model reproduces the main lobe structure of the AOTF TF, discrepancies remain, particularly in the sidelobes and in spectral regions affected by order overlap. In addition, the partial exploitation of the complete SOIR miniscan archive leaves open questions regarding the variability of the TF across the spectral domain, its long-term evolution throughout the mission lifetime, and potential instrumental dependencies not yet detectable in previous analyses.


This work introduces a probabilistic machine learning framework for the SOIR AOTF TF characterisation, with a particular focus on Gaussian Processes (GPs). GPs provide a flexible non-parametric framework well suited to heterogeneous, medium-sized calibration datasets, while naturally incorporating uncertainty estimation. The GP covariance structure can be physically informed, while the existing analytical model may be incorporated as a prior mean function, ensuring the framework remains grounded in instrument physics [5]. The objective is to investigate whether GP-based modelling can improve reconstruction of the TF shape, especially in the sidelobe regions, while also enabling the exploration of dependencies on wavelength, instrumental temperature, and observation epoch.


The ongoing study aims to extend the analysis to the complete SOIR miniscan archive acquired over the full operational lifetime of the instrument. Preliminary developments of the GP framework and data preparation pipeline are underway. Initial results from the first application of GP-based AOTF TF modelling to SOIR calibration data will be presented.


[1]        Nevejans, D., Neefs, E., van Ransbeeck, E., Berkenbosch, S., Clairquin, R., de Vos, L., Moelans, W., Glorieux, S., Baeke, A., Korablev, O., Vinogradov, I., Kalinnikov, Y., Bach, B., Dubois, J-P., and Villard, E., “Compact high-resolution spaceborne echelle grating spectrometer with acousto-optical tunable filter based order sorting for the infrared domain from 2.2 to 4.3 μm”, Applied Optics, vol. 45, no. 21, pp. 5191-5206, 2006.

[2]        Mahieux, A., Berkenbosch, S., Clairquin, R., Fussen, D., Mateshvili, N., Neefs, E., Nevejans, D., Ristic, B., Vandaele, A. C., Wilquet, V., Belyaev, D., Fedorova, A., Korablev, O., Villard, E., Montmessin, F., and Bertaux, J-L., “In-flight performance and calibration of SPICAV SOIR onboard Venus Express”, Applied Optics, vol. 47, no. 13, pp. 2252-2265, 2008.

[3]        Mahieux, A., Wilquet, V., Drummond, R., Belyaev, D., Federova, A., and Vandaele, A. C., “A new method for determining the transfer function of an Acousto optical tunable filter”, Optics Express, vol. 17, no. 3, p. 2005, 2009.

[4]        Mahieux, A., “Inversion of infrared spectra recorded by the SOIR instrument on board Venus Express”, PhD Thesis, BIRA-IASB & ULB, Belgium, 2011.

[5]        Rasmussen, C. E. and Williams, C. K. I., Gaussian Processes for Machine Learning, MIT Press, 2006.

How to cite: Gunessee, A., Mahieux, A., Robert, S., Piccialli, A., Thomas, I., Lejoly, S., Delchevalerie, V., Vandaele, A. C., and Frénay, B.: Towards Probabilistic Modelling of Venus Express/SOIR’s Acousto-Optic Tunable Filter, Europlanet Science Congress 2026, The Hague, The Netherlands, 7–11 Sep 2026, EPSC2026-1019, https://doi.org/10.5194/epsc2026-1019, 2026.

F3.45
|
EPSC2026-970
|
ECP
|
On-site presentation
Henrietta Rakoczi, Bart Root, Christopher Messenger, and Giles Hammond

Due to the limited availability of seismic data from Mars, the current best source of information about the internal structure of the planet is from the measurements of the gravitational field. In this work, the lateral density variations in the lithosphere are studied using a simulation-based approach linking the planetary model and measurements of gravity. A two-layer planetary model is implemented, where we study lateral density distributions in the crust and the mantle. However, gravity data is known for its insensitivity to depth-related information. Therefore, we parameterize the two layered model using a Matérn covariance function to simulate realistic distributions and reduce the number of freedoms. The question we aim to answer is; what can we learn about the Matérn parameters governing these distributions?

We simulate various synthetic 2-layer crust-mantle models from a multivariate normal distribution. The synthetic models are inputted in a Bayesian inference and probabilistic modelling is performed using a Normalising Flow neural network techniques. From the inference results, we can learn about the scale and structure of density variations in the lithosphere, as well as the relationships between the parameters governing these distributions in the two layers, and the sensitivity of available gravity data to this information. We have then used the available gravity data of the Martian gravity field to estimate the Matérn covariance parameters for a two layered density model. These parameters give insight the the subsurface density distribution in the form of variance of crustal and mantle anomalies, their spatial correlation, and any smoothing effects. The results of this study can inform future gravity inversion efforts and provide a stepping stone to the development of a global density map of the lithosphere of Mars.

How to cite: Rakoczi, H., Root, B., Messenger, C., and Hammond, G.: Simulation-Based Inference of Martian Lithospheric Structure Using Normalising Flows, Europlanet Science Congress 2026, The Hague, The Netherlands, 7–11 Sep 2026, EPSC2026-970, https://doi.org/10.5194/epsc2026-970, 2026.

F3.46
|
EPSC2026-181
|
On-site presentation
Henrik Hargitai

Scientific progress depends on stable reference systems in which previous results, observations, and data can be reliably identified, compared, and reused. In planetary geoscience, research often focuses on surface structures and units. These are used to infer present or past surface, atmospheric, and interior processes from shape, material properties, spatial distribution, age, or combinations of these attributes.  

A reliable register of surface entities is needed because no comprehensive, cross-catalog, ontology-oriented surface census of this kind currently exists for any planetary body. Such a system would address a basic question: what exists on the surface? More specifically, how can a planetary surface be represented as a set of spatially anchored, sometimes overlapping, scale-dependent entities of structures and units? A single item may share characteristics with different groups of other items, and those characteristics may be interpreted differently by different authors.

Planetary features have traditionally been organized through nomenclature. When recognized, they are named with descriptor terms based on morphology, displayed on maps and collected in lists and catalogs that served as reference data for research.

In recent decades, however, higher-resolution image and radar data have increased the number of identified surface features to a level where naming all of them has become impractical. Nomenclature remains useful for large, prominent, or unique features, but it is not used for geologic units or for the “uncountable” number of smaller features to receive proper names.

The Lunar Grid Reference system illustrates a parallel need for compact, systematic spatial identification. The Lunar Grid Reference System addresses a related but different problem: it provides compact spatial identifiers for grid cells rather than identifiers for geologic entities. (McClernan 2024, Navarre et al. 2026).

Nevertheless, these features still need to be identified, defined, and recorded. They must be traceable across papers and catalogs; otherwise, it becomes increasingly difficult to correlate the subjects of different studies. This problem is demonstrated by recent attempts to merge data from diverse sources, including geologic units (Ivanov and Head 2011), surface features (Gülcher et al. 2025), and raster data (Austin et al. 2026).

Useful analogies exist in astronomy. SIMBAD grew out of efforts to cross-identify astronomical objects and now provides basic data, cross-identifications, bibliography, and measurements for objects outside the Solar System (Heck and Egret 1987). The NASA/IPAC Extragalactic Database NED serves a similar role for extragalactic objects. Planetary surface features raise different difficulties, but the aim is similar: to connect multiple identifiers, geometries, classifications, and references to the same entity.

The Proposed Index of Places

The Index of Places (Hargitai 2026b) would assign unique IDs to identified planetary surface structures and units. It would link each entity to the catalogs in which it was listed, the geologic maps on which it was mapped, and, in time, the papers in which it was discussed. Its coverage could expand progressively.

The Index would first ingest features from existing catalogs, databases, and geologic maps. Each identifier would be associated with measured attributes, such as size and area; a polygon or polyline representing shape; a name, if the entity is named or listed in the Gazetteer; and links to papers that discuss or classify it. Different terms and classifications would be stored with their references.

The Index of Places would combine geologic maps, catalogs, and research literature into a developing ontology. Persistent identifiers (IDs) would serve as the primary anchor, while each entity could have one or more source-specific geometries.

A key question is what should count as an entity. The Index should distinguish between discrete surface features, mapped geologic units, feature groups, and other interpretive regions, while allowing links among them. A feature may contain subunits and one feature may also be part of another. Groups of features could also be handled collectively and individually through linked IDs.

Pilot Work

The first pilot of this Index has been completed: the Venus GIS (Hargitai 2016, 2026a), which combined most previously made feature catalogs and maps of Venus in an integration and data-preservation effort. This effort brought together datasets that had existed on private drives, in outdated formats, or in scanned, machine-unreadable catalogs.

This feature-based approach should now be transformed into a surface-location-based catalog: the Index of Places. When completed, it can be paired with raster datasets and incorporated into machine-learning systems, where it can supply training labels for pattern recognition. The Index may also be used to evaluate previous catalogs and estimate data confidence (e.g., Heyer et al. 2023).

At the same time, Foundation Models are being initialized for AI and Machine Learning applications (NASA 2025). This creates an opportunity to connect past mapping work with future AI infrastructure, forming a persistent reference basis for planetary geoscience.


References

Austin, T. J., O’Rourke, J. G., & Nelson, D. M. (2026).  https://doi.org/10.1029/2025EA004846

Hargitai, H. (2016).  DPS 48/EPSC 11 Meeting (Abstract #426.23). Pasadena, CA.

Hargitai, H. (2026a).  https://doi.org/10.5281/zenodo.18943246

Hargitai, H. I. (2026b).  MAPSIT April 2026  Abstract 6020

Heck, A., & Egret, D. (1987). SIMBAD, the CDS database. The Messenger, 48, 22–24.

Heyer, T., Iqbal, W., Oetting, A., Hiesinger, H., van der Bogert, C. H., & Schmedemann, N. (2023). https://doi.org/10.1016/j.pss.2023.105687

Ivanov, M. A., & Head, J. W. (2011).  https://doi.org/10.1016/j.pss.2011.07.008

McClernan, M. (2024).  https://doi.org/10.5066/P13YPWQD

NASA - (2025). Foundational Artificial Intelligence for the Moon and Mars (FAIMM) (ROSES-2025 Program Element C.12; Solicitation No. NNH25ZDA001N-FAIMM).  

Navarre, R., Almquist, Z., & Chase, R. (2026).  MAPSIT April 2026 Meeting  Abstract 6009

Pekala, M., Canal, G., Barham, S., Graziano, M. B., Trexler, M., Hamilton, L., Reilly, E., & Stiles, C. D. (2025).  arXiv. https://doi.org/10.48550/arXiv.2504.20125

How to cite: Hargitai, H.: A Reference Tool for Planetary Geoscience Synthesis: Index of Places, Europlanet Science Congress 2026, The Hague, The Netherlands, 7–11 Sep 2026, EPSC2026-181, https://doi.org/10.5194/epsc2026-181, 2026.