
 ,
,- Nantes Université, Univ Angers, Le Mans Université, CNRS, Laboratoire de Planétologie et Géosciences, LPG UMR 6112, 44000 Nantes, France (lison.cavalie@etu.univ-nantes.fr, victor.belissa@univ-nantes.fr, sabrina.carpy@univ-nantes.fr)
Introduction: The Martian North Polar Cap (MNPC), mainly composed of water ice, is shaped by seasonal cycles of CO₂ and H₂O ice condensation and sublimation [1,2]. During winter, the surface is covered by seasonal CO₂ frost, which sublimates in spring and summer, exposing the underlying water-ice cap to extremely dry atmospheric conditions that enhance sublimation [1,3]. Turbulent katabatic winds flowing over the polar cap during spring and summer [4] influence surface–atmosphere interactions and ice redistribution. These processes generate various aeolian and depositional landforms, including linear ridges interpreted as sublimation waves [5–8]. HiRISE images near Boreales Scopuli and Olympia Cavi reveal regular parallel ridges with wavelengths of ~7 m, oriented perpendicular to prevailing winds and showing little evidence of migration [7,8]. Similar features are also observed in Antarctic blue-ice fields and may correspond to Pluto’s Bladed Terrain Deposits [9–12]. The main objective of this study is therefore to identify which bedforms can confidently be interpreted as sublimation waves, test whether existing scaling laws reproduce their morphometric properties, and assess whether they can be used as proxies for near-surface wind dynamics. We combine morphometric analyses, mesocales estimation, and scaling laws to investigate metric-scale bedforms across the Martian North Polar Cap.
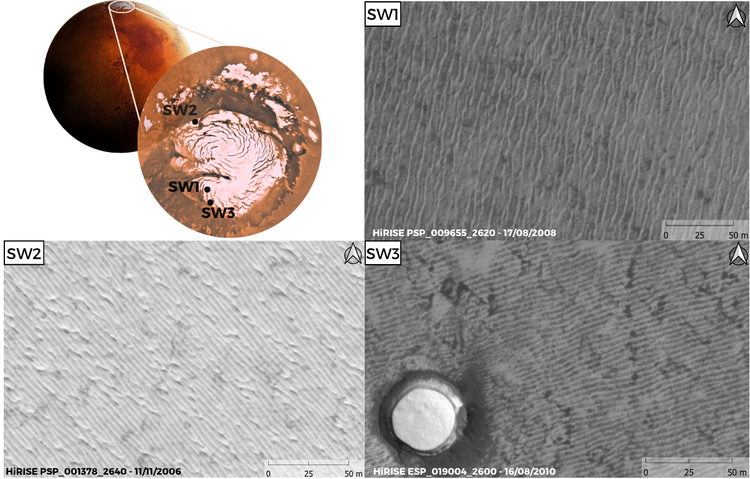
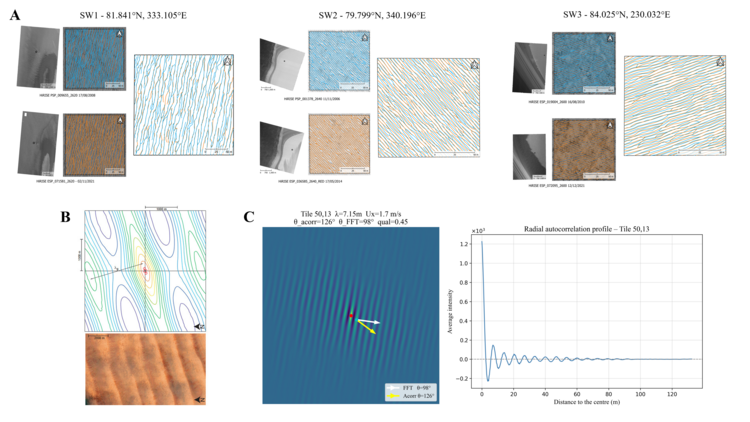
Methods: We analysed candidate sublimation waves using 25cm/px HiRISE images from three sites on the MNPC: two in Gemina Lingula (SW1 and SW3) and one in Tenuis Mensa (SW2) (Fig. 1). Multi-year image series were used to assess temporal changes in ridge morphology. Crestlines were manually mapped in QGIS to measure ridge orientation and wavelength distributions. To extend the analysis over complete HiRISE scenes, we applied an autocorrelation approach [13]. Images were divided into 750 × 750-pixel tiles, and periodic spatial patterns were identified by comparing each tile with shifted versions of itself. Peak spacing in the autocorrelation function provided wavelength estimates (Fig. 2).
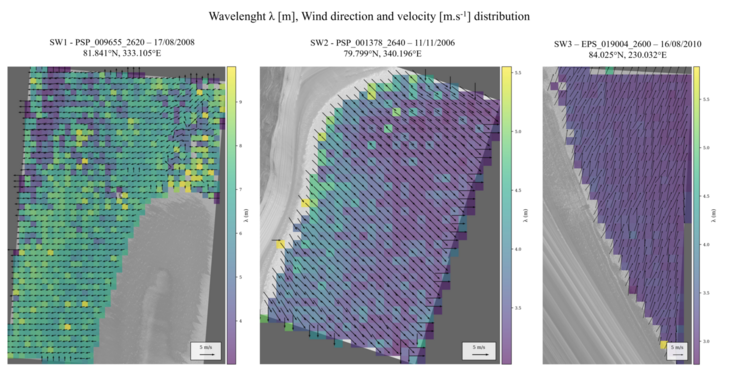
Wind direction was inferred from the assumption that sublimation waves form transverse to the prevailing near-surface flow, using both autocorrelation and Fast Fourier Transform analyses. Wind velocity at 10 m above the surface was then estimated from measured wavelengths using the scaling law of [7], which relates wavelength λ to the von Kármán constant κ, altitude z, the wavenumber kc⁺, and kinematic viscosity ν:

This equation allows measured wavelengths to be converted into equivalent near-surface wind velocities, assuming the observed ridges correspond to the most unstable mode of the sublimation-wave instability. Resulting wavelength, orientation, and wind-velocity maps were compared with LMDZ mesoscale simulations of the MNPC.
Morphological and wavelength analysis: Crest mapping reveals morphological differences between the three study areas. In SW1, ridge networks display junctions and bifurcations but no significant migration between 2008 and 2021. Individual ridges preserve nearly identical shapes and orientations over this 13-year interval, indicating a stable surface pattern. Mean wavelengths remain close to ~7m, consistent with previous measurements of Martian sublimation waves [7]. SW2 and SW3 display shorter wavelengths (~3 m) and local crest displacements between images, although the overall ridge-network geometry remains preserved. Their ridges appear more linear than in SW1 despite the persistence of junctions and bifurcations.
Autocorrelation analyses confirm distinct but internally consistent properties. In SW1, wavelengths range from 6.7 to 7.3 m, corresponding to inferred wind velocities of ~1.9 m s⁻¹ with a dominant WSW–ENE orientation. In SW2, wavelengths remain near 3.6 m, giving wind velocities of ~3.6–3.7 m s⁻¹ and a dominant NW–SE orientation. SW3 displays wavelengths close to 3 m, associated with inferred wind velocities of ~4.3–4.4 m s⁻¹ and a dominant SSW–NNE orientation (Fig. 3).
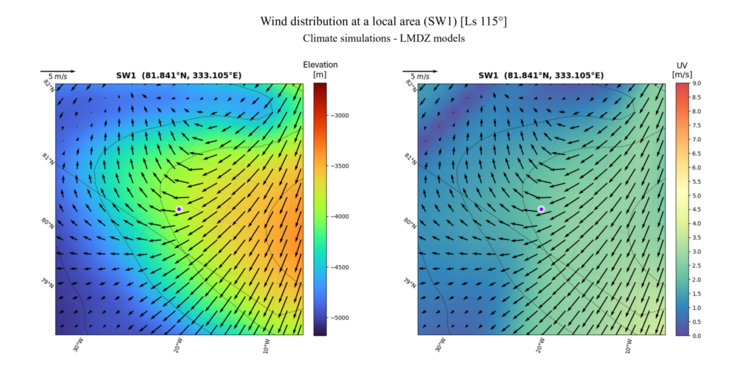
Comparison with mesoscale climate simulations: Comparison between mesoscale simulations, mapped ridge orientations, and autocorrelation results shows overall consistency, particularly for SW1 (Fig. 4). In this area, both models and autocorrelation indicate a WSW–ENE wind direction, consistent with observed ridge orientations. The absence of significant migration and the ~7 m wavelength further support the sublimation-wave interpretation [7].
For SW2 and SW3, mesoscale simulations and autocorrelation results are consistent in terms of wind velocity and regional wind-direction trends. However, manually mapped ridge orientations do not match the simulated wind field. The ~3 m structures imply winds perpendicular to the mapped crests, whereas simulations suggest winds closer to parallel. This discrepancy may reflect local effects related to topography, slope geometry, or seasonal atmospheric circulation.
Conclusion: The mass balance of the Martian North Polar Cap is controlled by seasonal condensation and sublimation cycles. We focus on the Ls range 90° to 180°, when the seasonal CO₂ frost has sublimated and water-ice sublimation is expected to be most active. In this context, morphometric analysis of metric-scale wavelengths can provide a proxy for identifying areas undergoing net sublimation. Scaling laws for icy sublimation waves also offer a way to constrain near-surface wind direction and velocity from observation.
Among the three investigated areas, SW1 shows the strongest evidence for sublimation-wave formation, with good agreement between observed wavelengths, scaling-law predictions, and mesoscale models. By contrast, SW2 and SW3 show inferred wind directions or velocities that differ from model predictions. This mismatch may reflect local controls by topography, slope geometry, or seasonal circulation, and highlights the need for higher-resolution mesoscale simulations to better resolve near-surface winds.
Acknowledgments: The authors acknowledge support from the French Agence Nationale de la Recherche (ANR), grant ANR-23-CE49-0006 (project SHERPAS).
References:
[1] Brown, A.J. (2016). Icarus, 277, 401–415.
[2] Read, P. (2015). Reports on Progress in Physics, 78, 125901.
[3] Mangold, N. (2011). Geomorphology, 126, 1–17.
[4] Smith, I.B. & Spiga, A. (2018). Icarus, 308.
[5] Herny, C. (2014). Earth Planet. Sci. Lett., 403, 56–66.
[6] Giang Nguyen, T. (2020). Planetary Space Science, 182, 104809.
[7] Bordiec, M. (2020). Earth-Science Reviews, 211, 103350.
[8] Carpy, S. (2023). Frontiers Astron. Space Sci., 10, 1176158.
[9] Bintanja, R. (2001). Journal of Glaciology, 47, 387–396.
[10] Bintanja, R. (1999). Reviews of Geophysics, 37, 337–359.
[11] Moore, J.M. (2017). Icarus, 287, 320–333.
[12] Belissa, V. (2026). This issue.
[13] Andreotti, B. (2009). Nature, 457, 1120–1123.
How to cite: Cavalié, L., Belissa, V., Carpy, S., and Bertrand, T.: Linking mesoscale atmospheric circulation to icy bedform morphology on the martian north polar cap, Europlanet Science Congress 2026, The Hague, The Netherlands, 7–11 Sep 2026, EPSC2026-334, https://doi.org/10.5194/epsc2026-334, 2026.


