
 ,
,- Charles University, Faculty of Mathematics and Physics, Department of Geophysics, Czechia (klara.anna@sindler.cz)
Introduction
Icy moons are a primary focus of the planetary science community due to their potentially habitable subsurface oceans. Enceladus is particularly intriguing because of its anomalous thermal activity, driven by tidal dissipation in its porous silicate core [1]. While the most prominent features are the 'Tiger Stripes'—fractures on the south polar terrain through which massive cryovolcanic plumes erupt—other notable features have recently been highlighted [2–4]. These include large, 100-km-scale depressions of unknown origin approximately 1–1.5 km deep, which appear too smooth to be tectonic or impact-related (Figure 1, A–G). In our study, we focused mainly on basin C and its topography along the great circles C1 and C2 (blue and green lines in Figure 1).
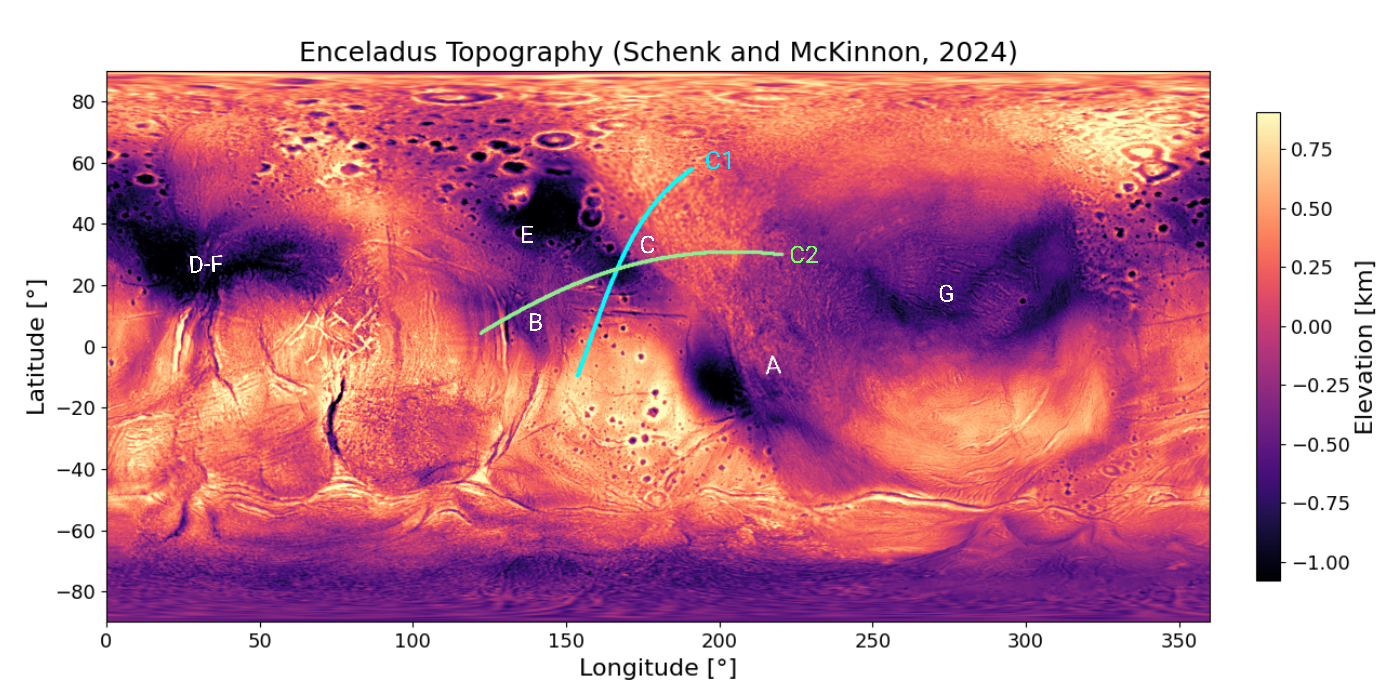
Figure 1: Enceladus’ topography. The regional depressions identified in [4] are labelled A–G. The topography predicted in this study is compared with the observation for depression C (blue and green lines C1 and C2).
As suggested by Schenk and McKinnon [4], these features may be a manifestation of hydrothermal vents originating in the porous core. According to this hypothesis, the regional depression forms as a viscous response to the heat flux anomaly coming from the ocean. Thinning of the ice shell causes a flow of ice to the area above the heat flux anomaly, which results in a topographic depression at the surface (Figure 2). Here we test this hypothesis using a numerical model, conduct a parametric study, and compare our modeling results with the topography observed during the Cassini mission.
Method
To investigate the scenario described above, we have developed a numerical code that solves the viscous deformation of the ice shell in spherical axisymmetric geometry using the finite element software FEniCS [5]. We solve the equations of mass, momentum, and energy conservation, employing free-surface boundary conditions at both the surface and the ice-ocean interface, where we also account for the ice-water phase transition. To evolve the shape of the boundaries, we use the ALE method [6]. The model accounts for the temperature dependence of ice viscosity. We assume a basal temperature of 270 K and vary the surface temperature (59 K, 100 K, and 140 K) to mimic the insulating effect of a regolith layer [7]. The hydrothermal activity is represented by a Gaussian heat flux anomaly at the ice-ocean interface, with amplitudes ranging from 0.1 to 0.5 W/m2 and a width of 60 km.
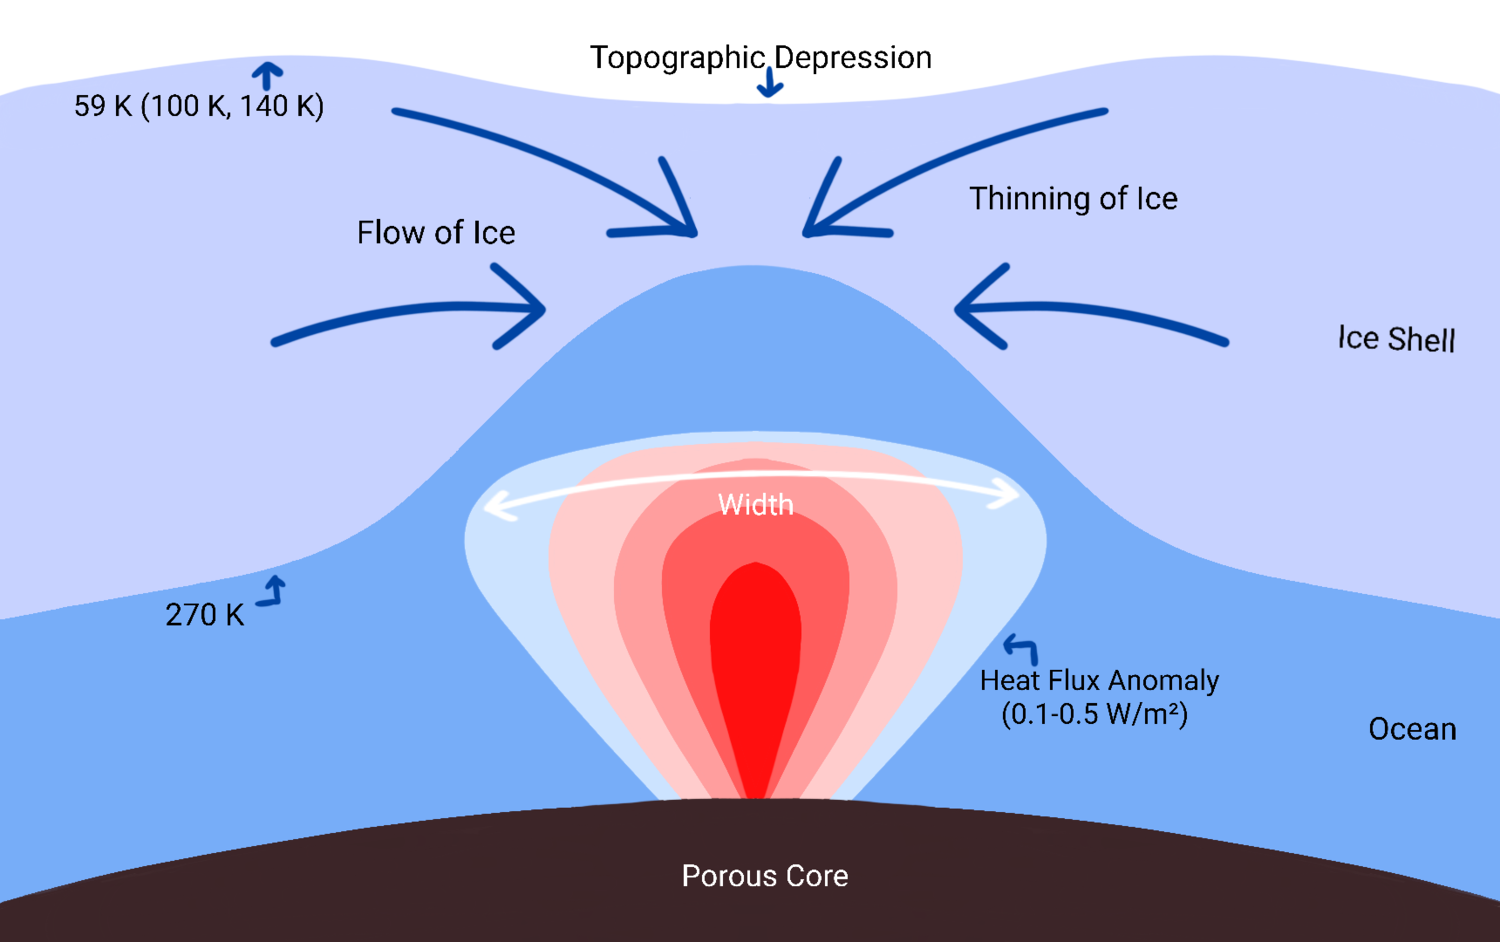
Figure 2: Illustration of the modeled scenario. The heat flux coming from the ocean results in melting the ice, driving the viscous flow in the ice shell, and leading to the formation of a regional depression.
Results
Figure 3 shows the evolution of the depth of the surface depression for different model parameters. The characteristic times of the evolution strongly depend on the amplitude of the heat flux anomaly, ranging from a few tens of Myr for qw=0.5 W/m2 to hundreds of Myr for qw=0.1 W/m2. The rate of the convergence and the depth of the predicted depression are influenced by the average thickness of the ice shell, being significantly larger for a thin ice shell (Figure 3, left). In Figure 4, we compare some of our models with the topography observed by Schenk and McKinnon [4]. The best fit is achieved for the heat flux anomaly with the amplitude of 0.25 W/m2, the 20 km thick ice shell, and the surface temperature of 59 K. Note that simulations performed for a thicker ice shell produce wider topographical depressions (see, e.g., simulation 8 in the right panel of Figure 4).
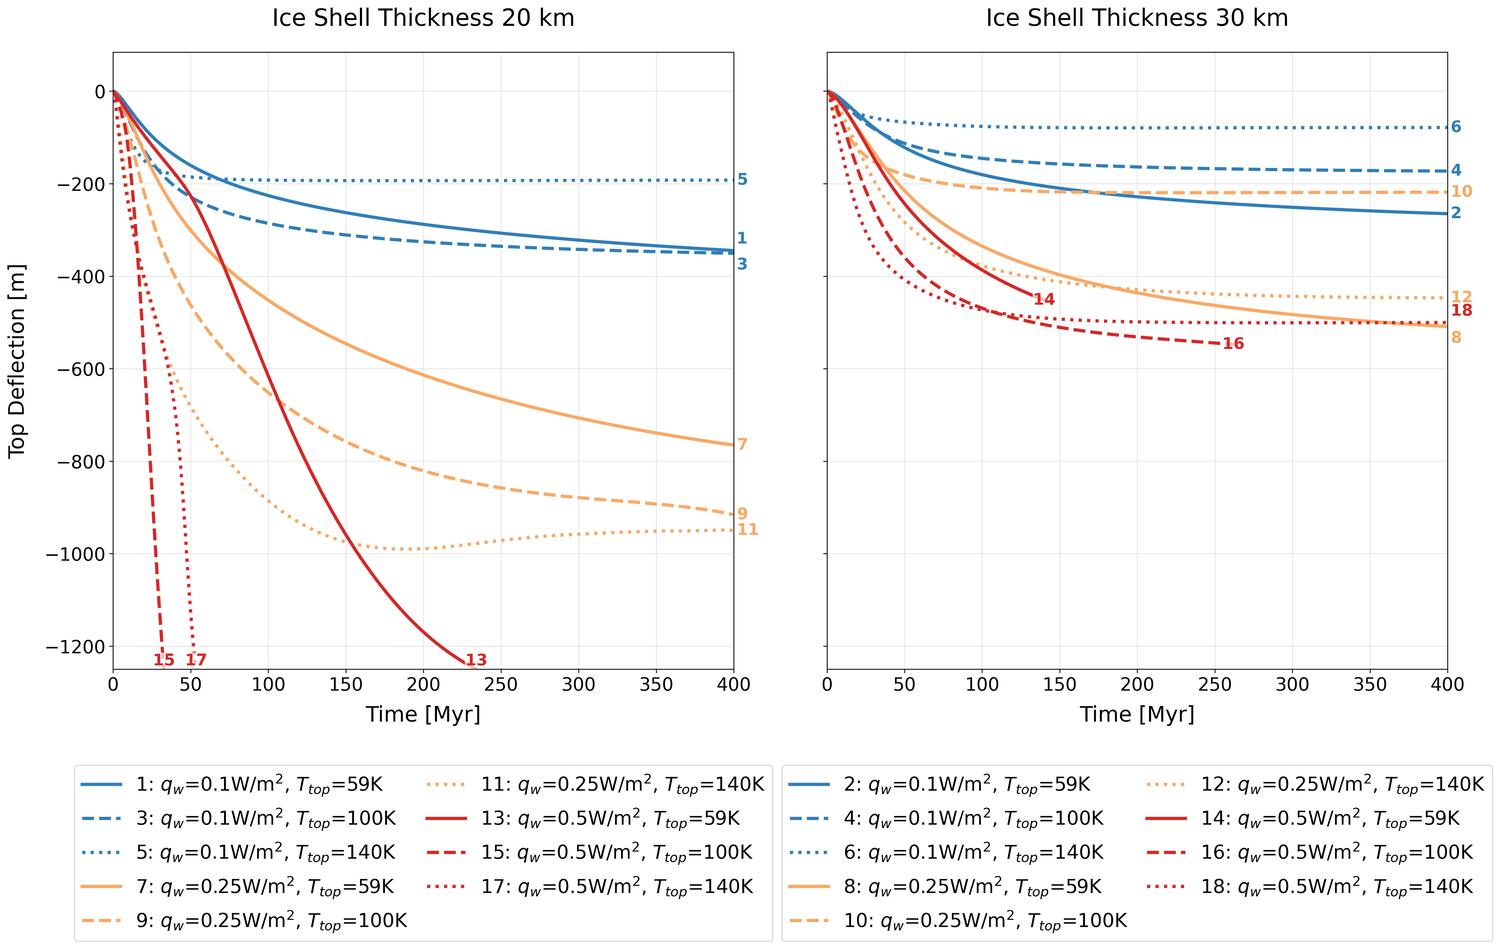
Figure 3: Depth of the surface depression as a function of time computed for 20-km (left) and 30-km (right) ice shells assuming different amplitudes of the ocean heat flux (qw) and different surface temperatures (Ttop).
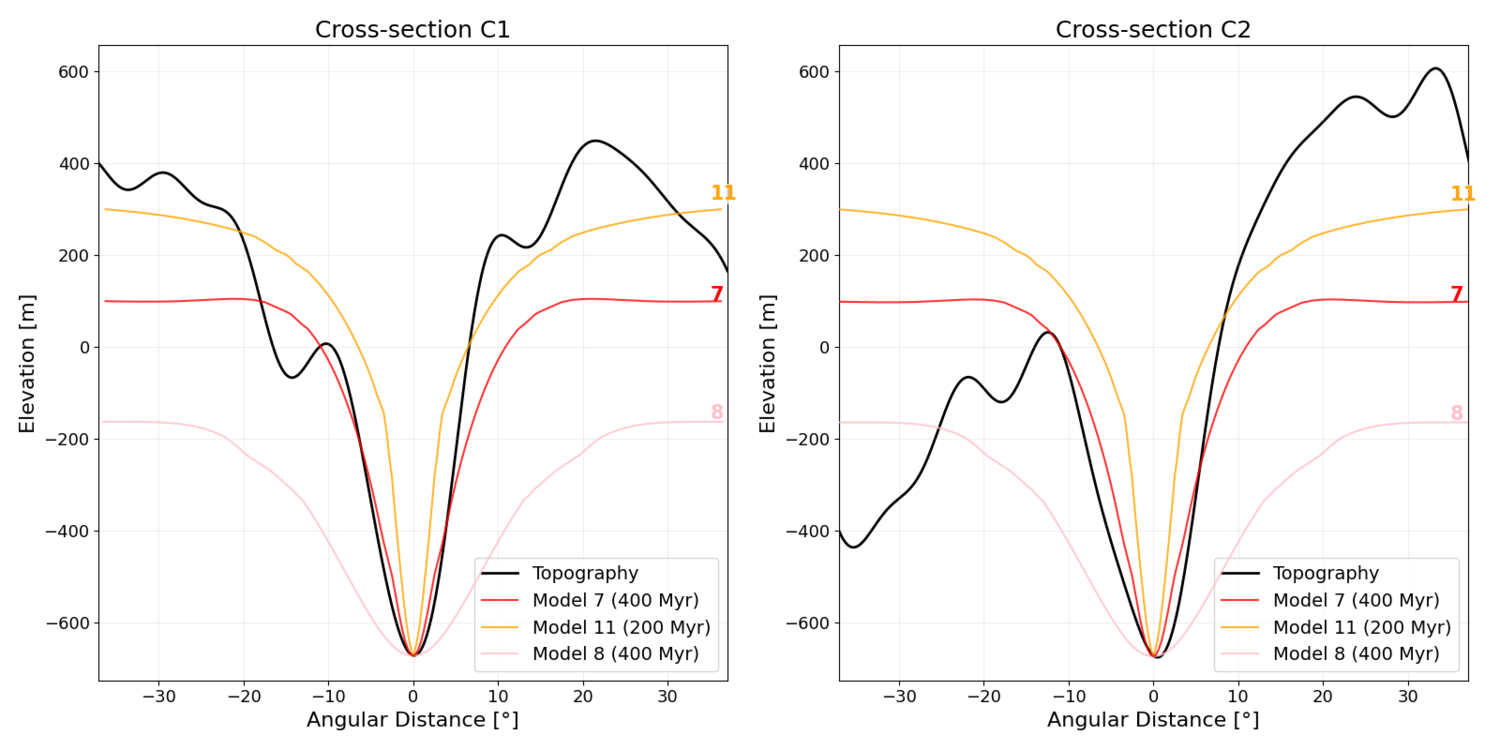
Figure 4: Comparison of selected models with the observed topography of basin C along the great circles C1 (left) and C2 (right) indicated in Figure 1. The observed topography corresponds to spherical harmonic degrees 4–40.
Conclusions
Our numerical simulations demonstrate that the hydrothermal vents originating in the core are a plausible explanation for the formation of deep, smooth 100-km-scale depressions observed on Enceladus’ surface. The rate of formation of these depressions strongly depends on the thickness of the ice shell and the amplitude of the anomalous heat flux coming from the ocean. Given that the plume in the ocean may be rather unstable (except in the case where it is located near the pole [8]), it is likely that the depressions were formed relatively quickly (≈10–50 Myr) during a period of enhanced tidal dissipation. Another possible explanation is that the depressions were formed relatively slowly near the pole (≈50–500 Myr) and then relocated due to the rigid rotation of the ice shell [2].
Acknowledgments
This research is supported by the GAUK project No. 436326 and by the Czech Science Foundation through project No. 25-16801S.
References
1. Choblet et al. (2017), Nat. Astron., 1, 841–847.
2. Tajeddine et al. (2017), Icarus, 295, 46–60.
3. Park et al. (2024), J. Geophys. Res. Planets, 129, e2023JE008054.
4. Schenk and McKinnon (2024), Icarus, 408, 115827.
5. Logg et al. (2012), The FEniCS Book, Springer–Verlag.
6. Donea et al. (2004), Encyclopedia of Computational Mechanics, John Wiley & Sons, pp. 413-437.
7. Martin et al. (2023), Icarus, 392, 115369.
8. Bouffard et al. (2025), Nat. Astron., 9, 650-657.
How to cite: Šindlerová, K. A., Kihoulou, M., and Čadek, O.: Uncovering the mystery of deep depressions on Enceladus’ surface, Europlanet Science Congress 2026, The Hague, The Netherlands, 7–11 Sep 2026, EPSC2026-346, https://doi.org/10.5194/epsc2026-346, 2026.


