
 2,4
2,4- 1Universität Münster, Institut für Planetologie, Münster, Germany (morlok70@mac.com)
- 2Max Planck Institute for Solar System Research, Göttingen, Germany
- 3Universität Münster, Institut für Mineralogie, Münster, Germany
- 4Deutsches Zentrum für Luft- und Raumfahrt, Berlin, Germany
Introduction:
The MERTIS (MErcury Radiometer and Thermal Infrared Spectrometer) is a mid-infrared imaging instrument, onboard the BepiColombo ESA/JAXA mission to Mercury expected to arrive in 2026. Part of the instrument suite is MERTIS, the Thermal Infrared spectrometer (TIS), covering the wavelength range from 7 to 14 µm, which will map the mineralogy of the surface of Mercury [1,2].
MERTIS provided the first thermal infrared data of the hermean surface from a spacecraft since Mariner 10 [3], since it was among the few instruments used during the 5th flyby at Mercury. Owing to the distance of nearly 40.000 km during the flyby, the footprint is comparatively large (~30 km), but already allows distinguishing surface details.
The main challenge even with the first batch of spectra is to obtain quantitative mineralogical information from the vast amount of data. For quantitative mineralogical data, laboratory emission spectra will be needed for detailed modelling.
The IRIS laboratory at the Institut für Planetologie (Universität Münster) geared up its effort, in line with ongoing work at the DLR in Berlin [e.g., 4, 5] to enhance its database with emission data to complement the already large reflectance spectral library [6].
Techniques:
We expanded our Vertex70v infrared spectrometer in the IRIS laboratory with a Harrick Emission Accessory, which is located at the emission port near the light source of the spectrometer and acts as the infrared light source [7, 8]. This device allows sampling of small amounts of material << 1 gram, collecting the emission over a large angular distribution by using an ellipsoidal mirror.
The sample and background material are enclosed in a separate stage (6 mm in diameter and 4 mm in height), which can be evacuated down to high vacuum (10-6 mbar), and can be heated to temperatures up to 450°C and is connected with the emission setup at the FTIR spectrometer. The temperature is controlled by two thermocouples, one on the top one at the bottom of the sample/background for a better determination of the temperature in the sample itself due to possible temperature gradients inside the sample chamber.
For each analytical run, first a series of background followed by a sample spectra is obtained at the usual sequence of temperatures: 100°C, 200°C, 300°C, and 350°C. The background material consists of a fine ground industrial slag, a featureless amorphous material. The sample spectra are ratioed against these background blackbody slag spectra [9]. If necessary, a baseline correction was also applied.
We used several Python packages to process and display the data: Pandas, NumPy, SciPy, and Matplotlib [10-13]. All spectral data will be made available in the IRIS database [6] in the future.
Results:
Here, we present first results for the 25 µm - 63 µm size fraction of mineral endmembers relevant for the studies of Mercury [14]. We compare the series of emission spectra from 100°C - 350°C to the reflectance spectra of the materials obtained at room temperature and coarse vacuum (10-3 bar) as a measure of quality control (Figure 1).
All spectra show an increasing band depth with increasing temperature. Also, clear shifts of the Christiansen Feature, a characteristic emission maximum (or reflectance minimum) is observed to lower wavelengths between room pressure and high vacuum: shifts of 0.02 µm (ID374 Forsterite) to 0.6 µm (ID54 Mercury Regolith glass). Similar shifts were observed in earlier studies [e.g. 15], indicating that high vacuum plays an important role.
Smaller shifts are also observed among the emission CF spectra with shifts towards higher wavelength (0.03 µm to 0.06 µm), and similar small shifts are observed for the Reststrahlen Bands [also compare 15].
While the general band shape is similar in most cases between the reflectance and emission spectra, the ID84 Oligoclase spectra shows differences in relative band intensities and shape towards longer wavelengths. Similar, ID53 Enstatite shows a stronger RBs at ~9.3 µm in remission compared with the features at longer wavelengths than in the reflectance results.
Summary & Conclusions
Future work will cover all grains size fractions (0 µm- 25 µm; 25 µm -63 µm, 63 µm -125 µm and 125 µm -250 µm). Furthermore, the range of sample will be extended to cover the whole range of expected mineral phases [e.g., 17]. Our measurements confirm that there is a significant shift in the CF between reflectance measurements under normal conditions and emission measurements in high vacuum. Differences between reflectance and emission data could result from temperature gradients in emission [e.g. 15, 16] as well as vacuum conditions [18].
References
[1] Benkhoff J. et al. (2010) Planetary and Space Science 58, 2-20 [2] Hiesinger H. et al. (2020) Space Science Reviews, 216, 1-37 [3] Chase S. C. (1976) Icarus 28, 565-578 [4] Maturilli A. et al. (2006) PSS 54, 1057-1064 [5] Helbert J. et al. (2008) PSS 56, 420-425 [6] Weber I. et al. (2026) Adv. Sp. Res. 77, 3934-3946 [7] Handke M. et al. (1985) Proc. SPIE, 553, 332-334 [8] Handke M., Harrick N. J. (1986) Appl. Spec. 40, 401-405 [9] Maturilli A. et al. (2013) 44th LPSC, #1719 [10] McKinney W. (2010) Proceedings 9th Python Sci. Conf. 56-61 [11] Harris C. R. et al. (2020) Nature 585,357-362 [12] Virtanen P. (2020) Nature Methods 17, 261-272 [13] Hunter J.D. (2007) Computing in Sci. & Eng. 9, 90-95 [14] Barraud O. et al. (2025) EPSC-DPS 2025, #1747 [15] Donaldson-Hanna K. (2017) Icarus 283, 326-342 [16] Martin A.C. (2025) JGR Planets 130, e2024JE008331 [17] Morlok A. et al. (2023) Icarus 396, 115498 [18] Weber I. et al. (2023) Icarus 404, 115683
Acknowledgements:
Acknowledgments: MPR, JHP, MPR, IW, AM, and JHP are funded by the DLR grant number 50QW2502A.
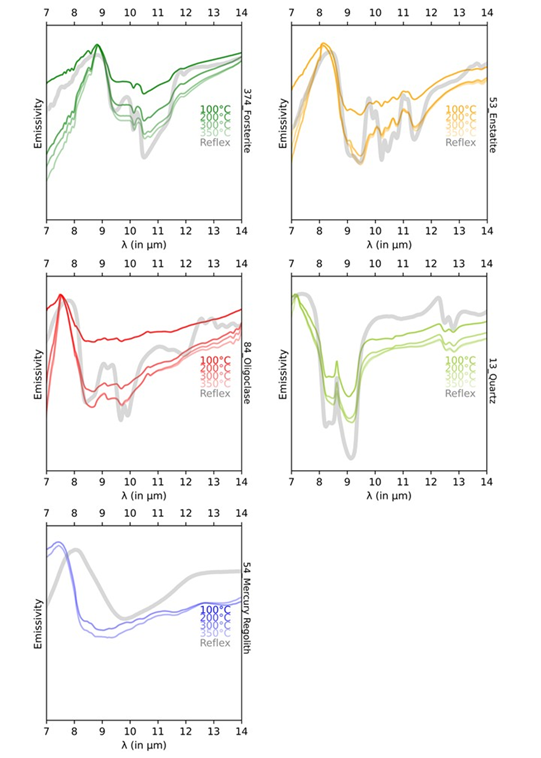
Figure 1: Mid-infrared emissivity spectra of the grain size fraction 25 µm – 63 µm. Shades indicate temperatures of mesurement (100°C to 350°C) under high vacuum. Thick grey line denotes the reflectance spectrum (scaled for better clarity) obtained atoom temperature.
How to cite: Morlok, A., Reitze, M., Weber, I., Renggli, C., Klemme, S., Pasckert, J. H., Heyer, T., Schmedemann, N., Hiesinger, H., and Adeli, S.: Emission Spectra of Analogues for the MERTIS Instrument on the BepiColombo Mission to Mercury, Europlanet Science Congress 2026, The Hague, The Netherlands, 7–11 Sep 2026, EPSC2026-488, https://doi.org/10.5194/epsc2026-488, 2026.


