

- Department of Earth and Planetary Sciences, ETH Zurich, Zurich, Switzerland (xi.yang@eaps.ethz.ch)
The Moon almost certainly hosted an internally generated dynamo in the past [1]. When the lunar crust was modified by impacts or magmatic processes in the presence of a dynamo field, portions of the crust acquired remanent magnetization, leading to pronounced magnetic anomalies (some reaching tens of nT at the surface) detectable from orbit [2–3]. Constraining the structure of magnetized sources that generate these observed magnetic anomalies is key to reconstructing the lunar magnetic history and understanding the thermal and magnetic evolution of its crust.
Assuming the lunar dynamo field was dominated by the dipolar component, and if the geographic locations and the magnetization direction of the source body are known, one can estimate the location of the paleopole at the time when remanent magnetization was acquired. However, paleopoles inferred from orbital data are widely scattered across the lunar surface, spanning all latitudes and longitudes [4]. This distribution may reflect either a time-variable and non-stationary dipole axis or a field that was not predominantly dipolar.
When estimating the magnetization and direction of the magnetizing field, earlier studies used various assumptions of the source geometries, including a single dipole [5,6], a set of unidirectional dipoles (e.g., Parker’s method) [7], and uniformly magnetized prisms [8]. However, these assumptions have not been systematically examined against observational constraints. If the ambient field varied significantly during magnetization (e.g., reversing dynamo field), magnetization intensity may be underestimated, and inaccurate paleofield directions may be retrieved [9].
A uniformly magnetized source of simple geometry that generates homogeneous magnetic fields can be approximated by a point source [10,11], the magnetic field of which follows a simple power law field fall-off function T=Cr-N, where T is the magnetic anomaly, r is the distance, C is the coefficient as a function of direction associated with anomalous magnetization, and N is the scaling index that describe the delay of signal strength with distance. The constant intergal scaling index corresponds to sources of different geometries: N=3 for a dipole or sphere, N=2 for a line (pipe or cylinder), and N=1 for a plane or thin sheet (dike or sill). The depth of the point source lies between the top and center of the source. Non-integer scaling indices are a function of distance and present transitional features between the ideal source geometries [12]. A scaling index N>3 corresponds to a signal that decays faster than a dipole, suggesting contributions from higher orders, implying a non-uniformly magnetized source.
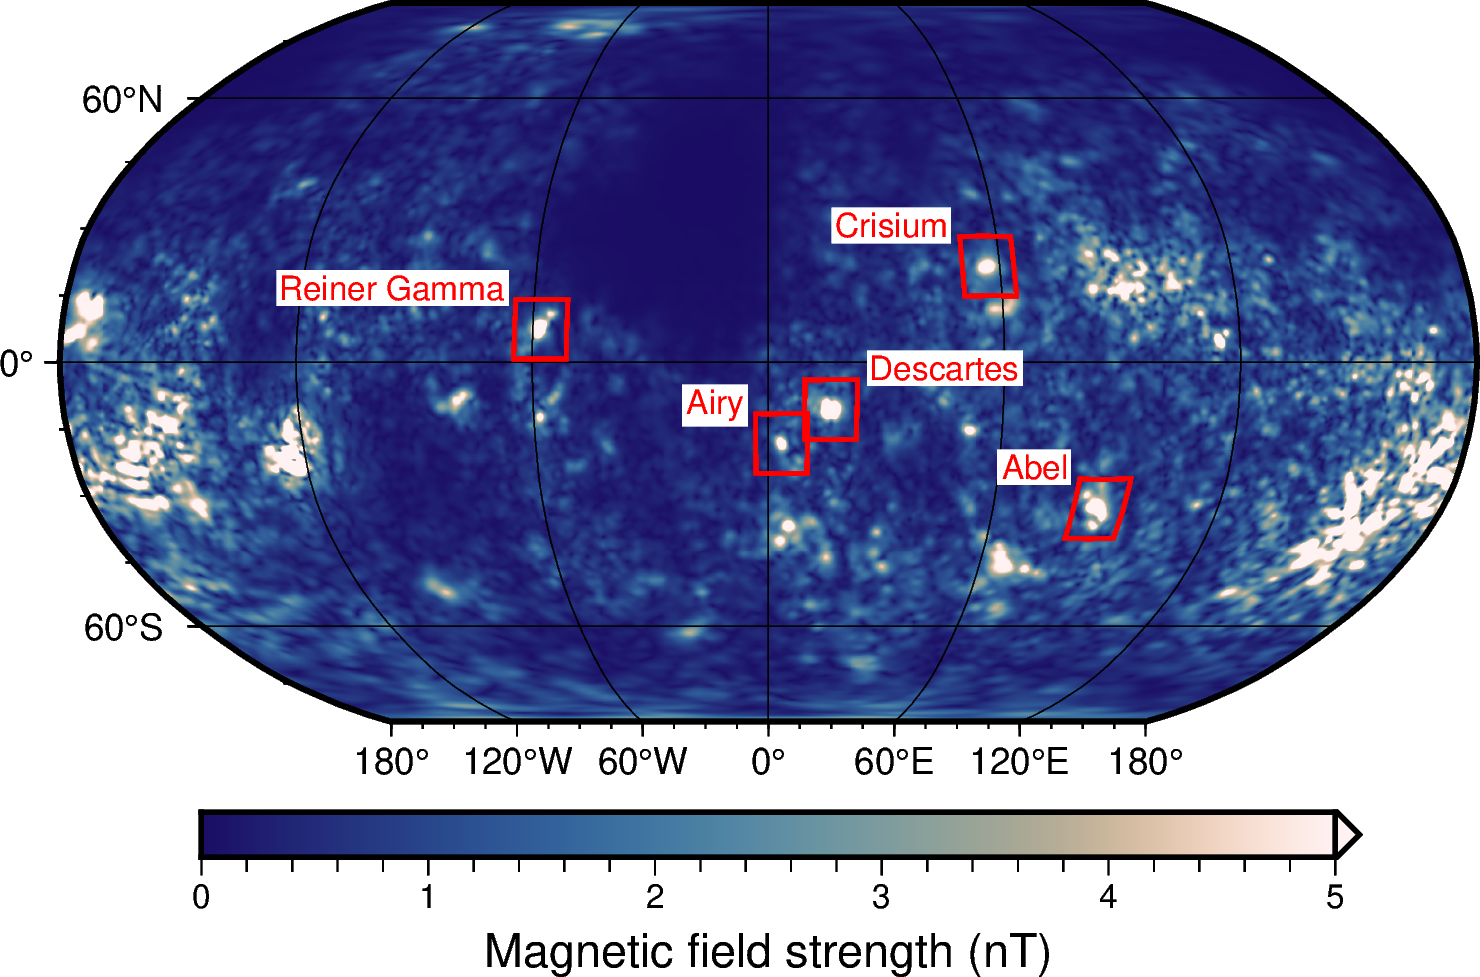
Fig 1. Locations of the studied lunar isolated magnetic anomalies. The shown magnetic field strength at 30 km height was predicted from the model of [13].
We focus on five isolated strong lunar magnetic anomalies (Fig.1) that show similar geometries and total field strengths > 5 nT at 30 km height in the recent lunar magnetic field models [13-15]. When deriving the scaling indices, we use the model of surface vector mapping [13] as primary because the other two models [14,15] use the equivalent source approach, which already imposes assumptions on source geometry. We extract the radial component of the strongest peak of the studied anomalies in the height range of 27—33 km in 0.1 km intervals and derive the best-fit point source depth and scaling indices (Table 1).
Table 1. Scaling indices and source depth of the studied lunar magnetic anomalies
|
Magnetic anomalies |
Scaling index |
Source depth (km) |
|
Reiner Gamma |
3.3 |
15.2 |
|
Abel |
2.3 |
16.4 |
|
Airy |
3.3 |
32.4 |
|
Descartes |
3.5 |
27.9 |
|
Crisium |
3.0 |
48.5 |
Among the studied anomalies, Reiner Gamma, Airy, and Descartes show N>3, suggesting non-uniform magnetized sources and inaccurate corresponding paleopoles. These observations are consistent with swirls (surface reflectance anomaly) associated with Reiner Gamma and Airy, which indicate complex field geometry at the surface. Crisium anomaly shows a scaling index equivalent to dipole (N=3.0), while Abel anomaly (N=2.3) is consistent with a source geometry between sphere- and pipe-like sources.
Our results suggest that the Crisum and Abel anomalies can be reasonably approximated by uniform magnetized sources, thus enabling an accurate paleopole reconstruction. Beak et al. [5,6] use a dipole source to model the Crisium anomaly (consistent with the derived scaling index N=3) and estimate a paleo south pole at ∼45◦N70◦E. The paleo north pole of the Abel anomaly derived using Parker’s method [7] is located at ∼42◦N114◦E. Together, these results indicate that the lunar magnetic paleopole was offset by more than 40 degrees from the present geographic pole and reversed at least once between the formation periods of the Crisium and Abel anomalies.
Estimated source depths further constrain the origins of the studied anomalies. The Crisum and Abel anomalies are consistent with emplacement of iron-rich impactor-derived materials [5,6,8]. Reiner Gamma, Airy, and Descartes anomalies do not show an association with impact basins, and combined with N>3, may reflect multi-stage magmatic processes involving magnetization under varying ambient field directions. In particular, the magmatic origin of Reiner Gamma is consistent with the multi-phase magmatic activities of the region [16]. These results provide new constraints on the structure and origin of lunar magnetic anomalies and implications for their detection and interpretation in upcoming lunar missions, such as Lunar Vertex and Chang’e 7.
Reference
[1] Weiss & Tikoo, Science (2014). [2] Tsunakawa, H. et al. JGR-Planets (2015). [3] Ravat, D. et al. JGR-Planets (2020). [4] Wieczorek, M. et al., NVM-2 (2023). [5] Beak, S. et al., JGR-Planets (2017). [6] Beak, S. et al., JGR-Planets (2019). [7] Oliverira, J. and Wieczorek, M., JGR-Planets (2017). [8] Hood, L., Icarus (2011). [9] Chaffee, T. et al., JGR-Planets (2025).[10] Thompson, D., Geophysics (1982). [11] Reid, A. & Thurston J., Geophysics (2014) [12] Florio, G. et al., Geophys. Prospect. (2009). [13] Tsunakawa, H. et al., JGR-Planets (2015) [14] Ravat, D. et al., JGR-Planets (2020). [15] Hood, L. et al., JGR-Planets (2021). [16] Hiesinger, H. et al., JGR-Planets (2003).
How to cite: Yang, X. and Mittelholz, A.: Scaling analysis of strong lunar magnetic anomalies, Europlanet Science Congress 2026, The Hague, The Netherlands, 7–11 Sep 2026, EPSC2026-497, https://doi.org/10.5194/epsc2026-497, 2026.


