
 1,2,2,
- 1Laboratoire de Météorologie Dynamique / Institut Pierre-Simon Laplace (LMD/IPSL), Centre National de la Recherche Scientifique (CNRS), Sorbonne Université, 4 place Jussieu, Tour 45-55 3e étage, 75252 Paris, France
- 2Laboratoire Atmosphères Observations Spatiales / Institut Pierre-Simon Laplace (LATMOS/IPSL), Université Paris-Saclay, Université de Versailles Saint-Quentin-en-Yvelines (UVSQ), Sorbonne Université, Centre National de la Recherche Scientifique (CNRS), Guy
Context: Titan's methanologic cycle
Titan's methane cycle is very similar to Earth's hydrologic cycle: evaporation from liquid bodies at the surface, condensation and cloud formation in the troposphere, rain (Hayes et al. 2018). Here, we focus on the clouds' formation and evolution.
Methods:
We use the Titan WRF PCM model: a regional model based on the coupling of the Weather Research and Forecast (WRF) dynamical core with the physics of the Titan Planetary Climate Model (Titan PCM, Lebonnois et al. 2012, de Batz de Trenquelléon et al. 2025a, de Batz de Trenquelléon et al. 2025b).
We use it in 3D, with a domain of 60x60km and a horizontal resolution of 1km. The top of the model is around the tropopause, at 50km, and the vertical resolution goes from 3m close to the surface to 1.8km at the model top. Our time step is of 0.5s. We set our simulation at a latitude and season where we expect convective clouds to appear: during the southern summer, close to the south pole. Indeed, clouds are predicted there by general circulation models (de Batz de Trenquelléon et al. 2025b), and were observed in 2004 by Cassini (Porco et al. 2005). The simulation is initialized with profiles from the general circulation model (Titan LMDZ PCM), for temperature, methane vapor, and aerosols. We trigger convection with a warm bubble at the center of the domain, 1K warmer than the environment, and we let the situation evolve. The warm bubble is an ellipsoid with horizontal semi-axes of 5km and a vertical semi-axis of 500m, laying on the surface.
Modeled cloud
Figure 1 shows the evolution of the cloud.
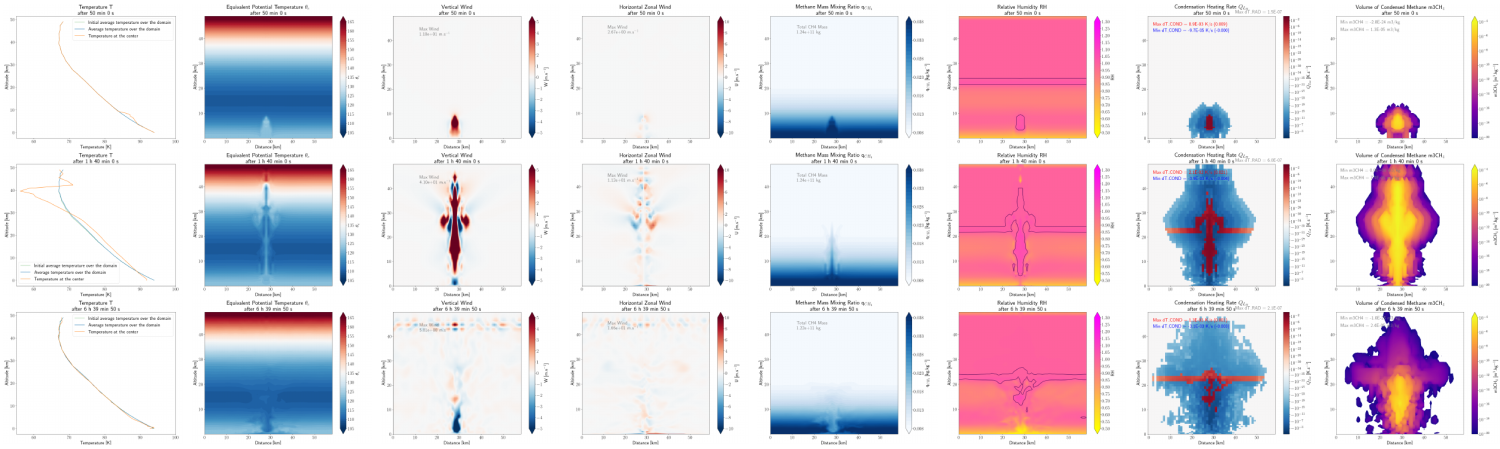
Figure 1: Evolution of the simulation (temperature, equivalent potential temperature, vertical wind, horizontal wind, methane vapor, relative humidity, condensation heating rate, volume of condensed methane). First line: 50min after run start, Second line: 1h40 after run start, Third line: 6h39 after run start.
The warm bubble has a positive buoyancy (see the temperature profiles and the equivalent potential temperature figures, columns 1 and 2). As a result, it rises in the atmosphere, transporting methane upward (see the vertical wind (column 3) and the evolution of the methane vapor (column 5)). As the temperature decreases in altitude the air reaches a point of saturation, causing methane condensation (see the relative humidity (column 6) and the condensation heating rate (column 7)). Once the condensation is triggered, it releases latent heat (positive condensation heating rate), which increases the temperature and the buoyancy, causing the air to continue its motion upward: the cloud is convective.
Column 8 shows the volume of condensed methane, i.e. the volume of cloud at each point. The cloud forms ~35min after the start of the simulation (~5km above the surface), and then extends upward (updraft) and downward (precipitations and unsaturated downdrafts) during ~1h. The updrafts and downdrafts are visible in the vertical wind column (column 3). When the unsaturated downdrafts reach the surface they spread horizontally, forming cold pools. The maximum horizontal wind at the surface is ~24m.s-1 (in the first level, i.e. ~3m above the surface). The cloud reaches the top of the model ~1h20 after the start of the simulation. Afterwards, it extends horizontally, during ~1h30, and the cloud top lowers slowly. The cloud's maximal horizontal extent is ~50km.
The storm produces in total 0.03kg.m-2 of precipitations (corresponding to 0.011mm.h-1 of rain on average over the domain and a total of 0.076mm during the simulation). Taking only the parts of the domain receiving rain, the precipitations are of ~0.033mm.h-1 on average (i.e. 0.22mm in total, or 0.09kg.m-2). At the peak it rains 9.5mm in 1min, corresponding to a precipitation rate of 569mm.h-1; the maximum hourly cumulative rainfall is 159mm. For a rough estimate, we can say that precipitations during the storm are on average in the range 0.01-0.1mm.h-1, and around 100mm.h-1 at the storm maximum. In comparison, storm Ciarán (which hit the Channel Island and the North of France in November 2024) produced a maximum rain rate of 175mm.h-1 over one minute (Winter et al. 2024), while the world record rainfall is 300mm in 42min (Lott 1954).
Other simulations
To study the altitude the cloud would reach without the artificial barrier of the model top, we perform a run with a top at 70km. We obtain a maximal cloud top around 60km. This simulation also enables us to see that the modeled convective cloud introduces some methane vapor in the stratosphere (see Figure 2). This phenomenon could explain the observed stratospheric methane variability, as suggested by Rannou et al. 2021.
Moreover, by changing the season we are able to reproduce some seasonal variability of the methane convective clouds (i.e. bigger clouds at the south pole than at the equator during the southern summer).
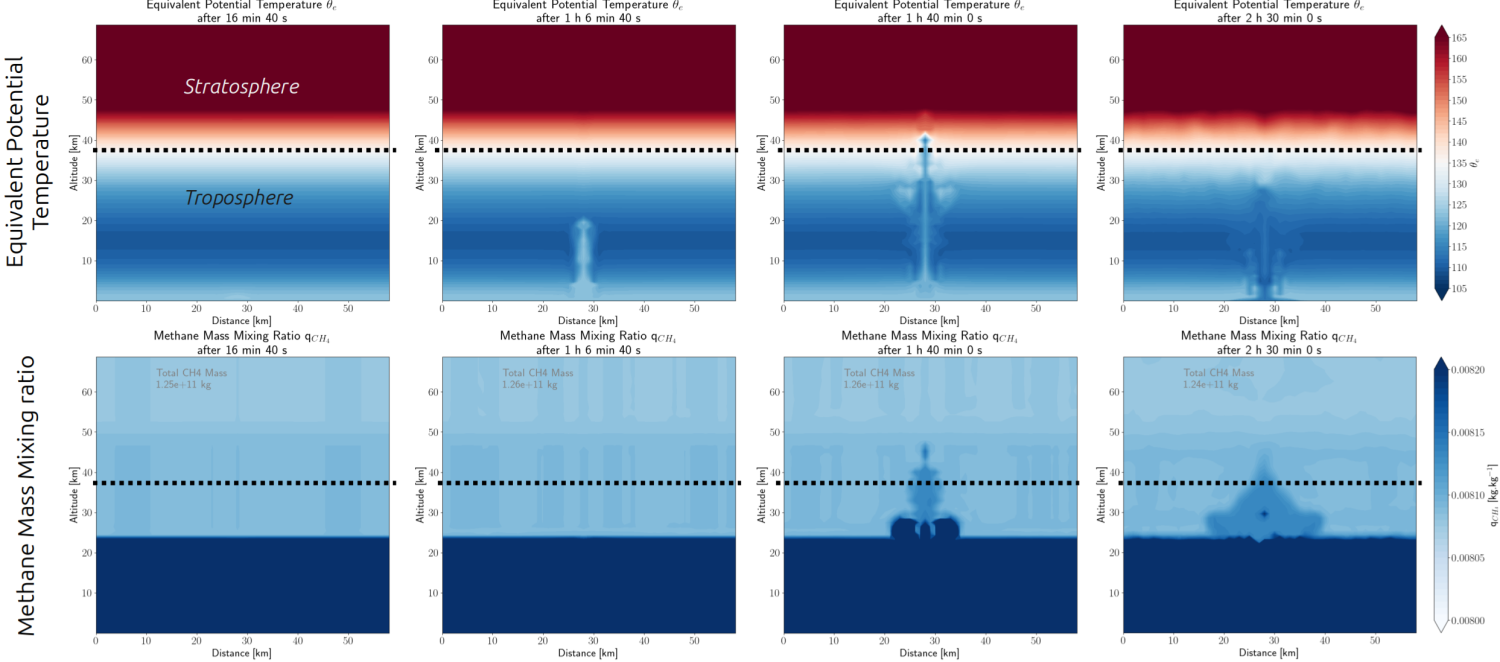
Figure 2: First Row: Equivalent potential temperature. Second Row: Methane vapor. Columns: time after run start (16min 40s, 1h 6min 40s, 1h 40min 0s, 2h 30min 0s). The dashed line indicates the tropopause.
Rerefences
de Batz de Trenquelléon et al. 2025a “The New Titan Planetary Climate Model. I. Seasonal Variations of the Thermal Structure and Circulation in the Stratosphere”. (The Planetary Science Journal)
de Batz de Trenquelléon et al. 2025b “The New Titan Planetary Climate Model. II. Titan’s Haze and Cloud Cycles”. (The Planetary Science Journal)
Hayes et al. 2018. “A Post-Cassini View of Titan’s Methane-Based Hydrologic Cycle”. (Nature Geoscience)
Lebonnois et al. 2012. “Titan Global Climate Model: A New 3-Dimensional Version of the IPSL Titan GCM”. (Icarus)
Lonfat et al. 2004. “Precipitation Distribution in Tropical Cyclones Using the Tropical Rainfall Measuring Mission (TRMM) Microwave Imager: A Global Perspective”. (Monthly Weather Review)
Lott, G.A., 1954. "The World Record 42-minute Holt, Missouri, Rainstorm". Monthly Weather Review
Porco et al. 2005. “Imaging of Titan from the Cassini Spacecraft”. (Nature)
Rannou et al. 2021. “Convection behind the Humidification of Titan’s Stratosphere”. (The Astrophysical Journal)
Winter et al. 2024. “Storm Ciarán – an Exceptionally Severe Windstorm in the Channel Islands”. (Weather)
How to cite: Moisan, E., Chatain, A., and Spiga, A.: Modeling convective methane clouds on Titan with a regional model, Europlanet Science Congress 2026, The Hague, The Netherlands, 7–11 Sep 2026, EPSC2026-543, https://doi.org/10.5194/epsc2026-543, 2026.


