
 1,1,2,2,1
- 1School of Physics & Astronomy, University of Leicester, Leicester, UK (oliver.king@leicester.ac.uk)
- 2Northumbria University, Newcastle, UK
- 3Universidad Adolfo Ibáñez, Santiago, Chile
JWST has recently completed an unprecedented campaign, observing the ice giants Uranus and Neptune repeatedly over the course of several months. Over this campaign (GO 7570, PI: Stallard), each planet was observed ~200 times (Neptune in November and December 2025; Uranus in January and February 2026) with the NIRSpec/IFU instrument (Figure 1), providing 2.8-5.2 µm spatially resolved spectroscopy (R=2700, 0.1”/pixel). This has created a comprehensive dataset of the evolution and variation of the atmospheres of these ice giants, over timescales ranging from ~10 minutes to ~1 month. This presentation provides a first look at the dynamic and evolving cloud systems in the neutral atmospheres of Uranus and Neptune, as observed by this JWST campaign.
Tracking of cloud drift, morphology and brightness variations: We use the dataset to track the locations and evolution of several clouds over the month-long period of observations of each planet. Fitting the longitudinal drift of each cloud allows us to calculate zonal wind velocities at discrete latitudes, where initial analysis of the Uranus data appears generally consistent with previous studies (e.g., Sromovsky et al., 2005). However, tracking of individual clouds shows significant dynamic evolution of clouds over ~day long timescales – for example, the prominent cloud at 35°N on Uranus (Figure 2) appears to rapidly intensify and fade in brightness multiple times over the dataset. Other clouds show a range of behaviours, with some fading completely, and others seeming to disappear, only to reappear after several days in the same location. We are also able to study the variation in spatial structure and extent of clouds, with some appearing to oscillate slightly in location (around a consistent zonal drift), while others may be changing in size and shape.
Spectral analysis and vertical structure: The power of the JWST/NIRSpec instrument allows us to go beyond tracking the locations and spatial extents of the clouds by also studying their spectral properties. Different wavelengths in the 2.8-5.2 µm spectral range probe different depths in the atmospheres of Uranus and Neptune, allowing us to infer the evolution of 3D structure of ice giant clouds using this dataset. We can isolate the spectrum for each identified cloud feature, compare it to the typical background spectrum for that latitude, and then track how the cloud’s spectrum (and therefore its vertical extent) varies over time. Preliminary results suggest that the clouds may vary more slowly at longer wavelengths, suggesting that they may be longer lived at the lower altitudes that these wavelengths are most sensitive to. Similarly, there are some more subtle and faint cloud features which are only visible at longer wavelengths (> ~4µm), suggesting that some cloud features may only be present at these lower altitudes/higher pressures.
The powerful combination of temporal, spatial and spectral information provided by this JWST dataset enables a detailed study of cloud features in the neutral atmospheres of the ice giants, tracking how clouds dynamically move, evolve and change in all three dimensions.
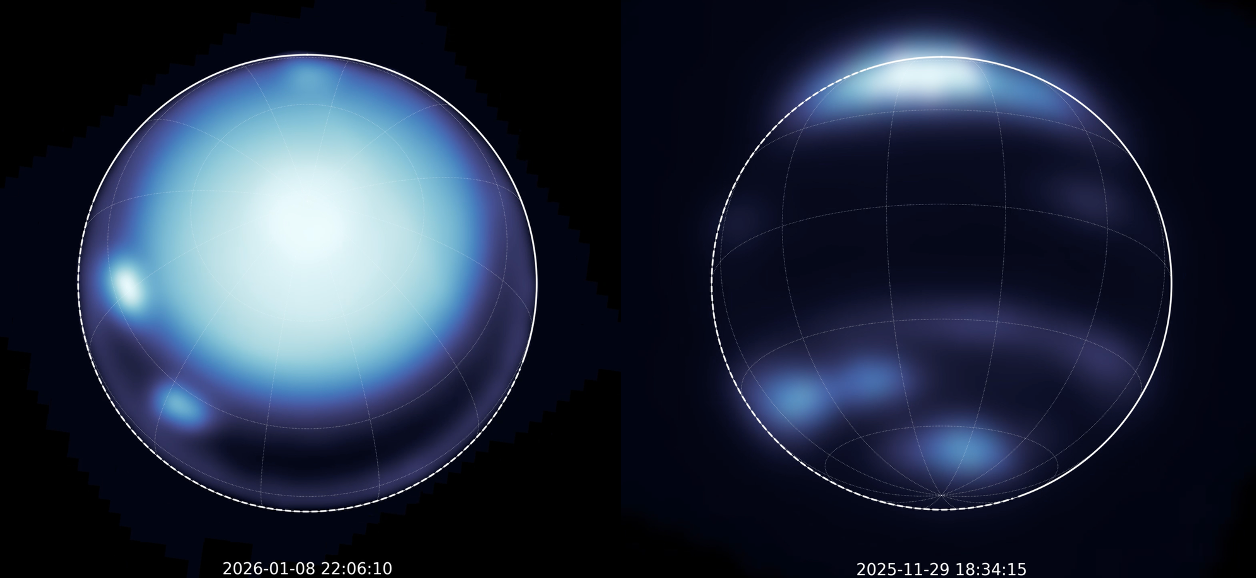
Figure 1: Images of Uranus (left) and Neptune (right) at 2.9µm, showing examples of cloud features observed in this dataset. Over the whole campaign, ~200 observations were captured of each planet, providing fully spatially resolved 2.8-5.2µm spectra across the discs of Uranus and Neptune.
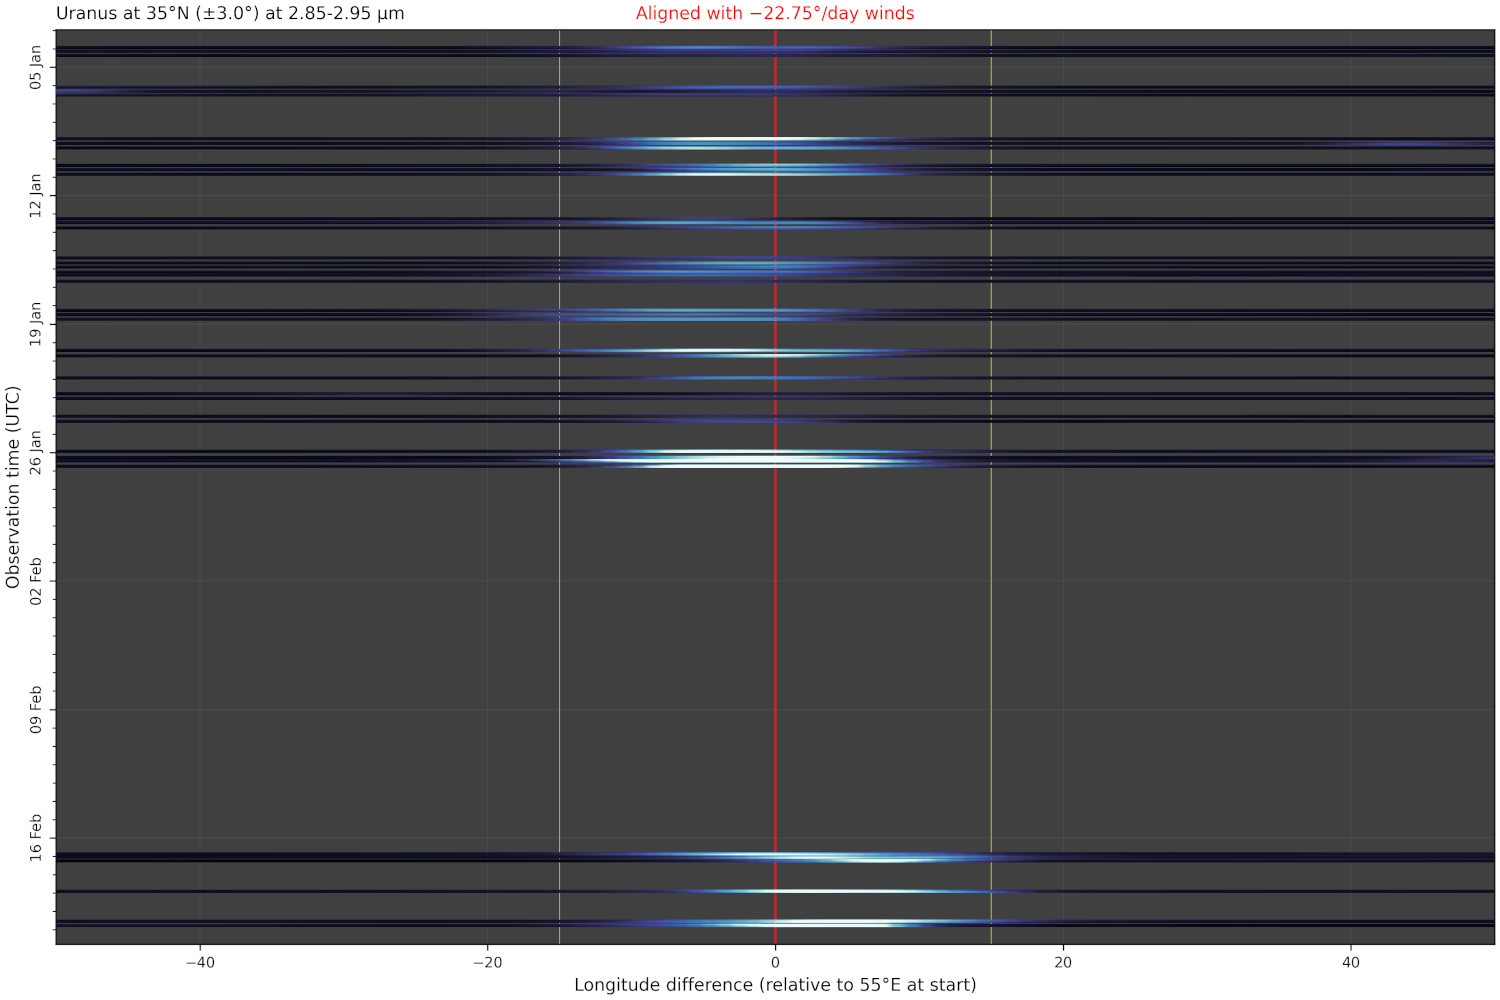
Figure 2: Example cloud tracking keogram, showing the variation of the 35°N cloud on Uranus. The longitudes for each successive observation have been shifted with a -22.75°/day zonal wind, consistent with the observed drift rate of this cloud. Over the course of the observations, the cloud appears to vary significantly in brightness and potentially oscillate slightly in longitude around the constant drift rate (red line).The yellow lines show the approximate longitudinal extent of the feature.
How to cite: King, O., Fletcher, L., Stallard, T., Melin, H., Roman, M., and Toogood, S.: JWST’s observations of dynamic cloud systems on Uranus & Neptune, Europlanet Science Congress 2026, The Hague, The Netherlands, 7–11 Sep 2026, EPSC2026-551, https://doi.org/10.5194/epsc2026-551, 2026.


