
 1,4,5,
- 1Université Versailles Saint-Quentin, IPSL, LATMOS, Guyancourt, France (emmanuel.marcq@latmos.ipsl.fr)
- 2SWRI, Boulder, CO, USA
- 3Sciencecurve.Space
- 4University of Tokyo, Tokyo, Japan
- 5LIRA, Observatoire de Paris PSL, Meudon, France
Sulphur dioxide (SO2) is arguably the most variable trace gas at Venus’ cloud top, with observable column density variations spanning about 2-3 orders of magnitude over spatial extents ranging from a few hundred of kilometers to planetary scale, and over time scales ranging from about an Earth day to several decades [1, 3-7, 4, 5]. Orbital investigations from ESA’s Venus Express (2006-2014), and JAXA’s Akatsuki (2015-2025) have provided long term measurements series of cloud top SO2, but suffer from instrumental limitations in terms of size, weight, power, and spectral resolution when compared to ground instrumentation.
As a complement of the orbital monitoring with inevitable gaps in time between active space missions, as well as considering the known variability of SO2, Encrenaz et al. [3-7] have been running a monitoring campaign using the high-resolution (R ~ 105) mid IR spectrometer TEXES [2], a guest instrument hosted at the IRTF telescope in Hawaii. During most Venusian quadrature events from 2012 up to the present day, they have recorded hyperspectral cubes of Venus near 7.4 µm, 8.6 µm and 19 µm, probing altitudes ranging from 57 to 67 km, within the upper clouds of Venus. Using simple weak line ratios of SO2/CO2 on one hand, and HDO/CO2 on the other hand, they confirmed the striking variability of SO2 over short timescales (a few terrestrial hours) and spatial extents of about 1000 km (so called “SO2 plumes”), in comparison with the spatially uniform HDO maps used here as a proxy for H2O. Long-term variations of HDO were nevertheless evidenced, exhibiting complex correlations with SO2 [5].
We have now undertaken the reprocessing of the whole TEXES data set, along two main directions of improvement. First, we shall map the spectral cubes onto a suitable and consistent coordinate system (latitude, longitude, local solar time) to assess SO2 variability more accurately than using only the existing full disk images. Then, we shall develop a radiative transfer model that should allow for more accurate retrievals of minor species, possibly allowing for limited temperature and SO2 vertical profiling within the upper cloud. We shall present here our preliminary results, and plan to use this pipeline for future TEXES observations that the team will lead.
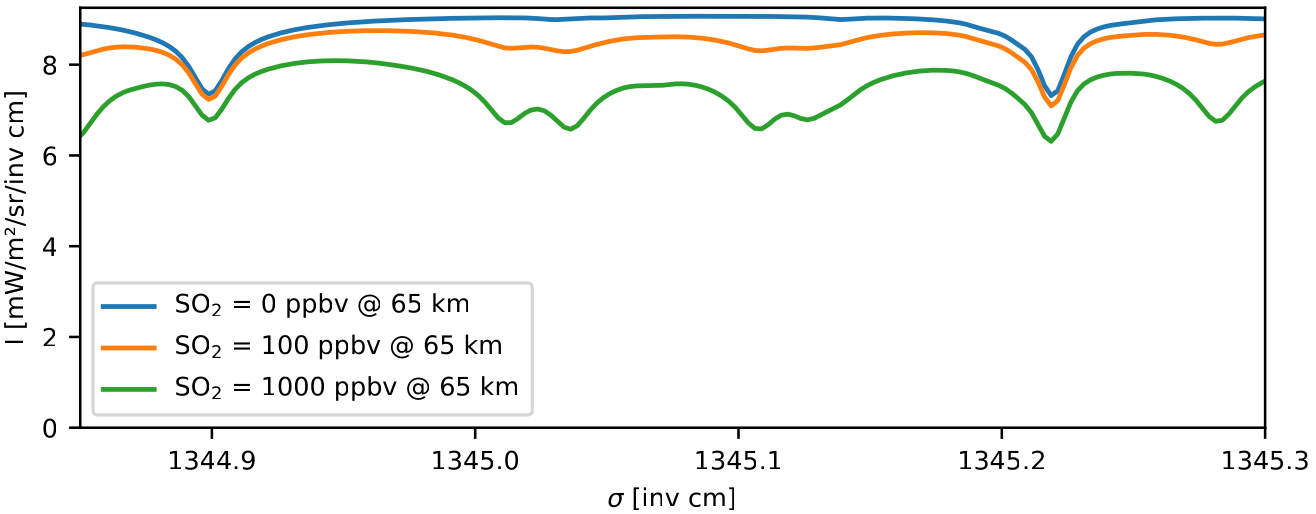 Figure 1: Synthetic spectrum with 5 ppm of H2O at 65 km and variable amounts of SO2. Besides SO2 spectral lines, a CO2 line can be seen near 1345.25 cm-1, as well as a HDO line near 1344.9 cm-1
Bibliography
-
[1] Esposito et al., Science (1984)
-
[2] Lacy et al., PASP(2002)
-
[3] Encrenaz et al., A & A (2012)
-
[4] Marcq et al., Nature Geosci. (2013)
-
[5] Marcq et al., Icarus (2020)
-
[6] Encrenaz et al., A & A (2023)
-
[7] Encrenaz et al., A & A (2025)
How to cite: Marcq, E., Verbaenen, E., Greathouse, T., Roos-Serote, M., Aoki, S., Bézard, B., and Encrenaz, T.: Monitoring of sulphur dioxide observed in the upper clouds of Venus by TEXES/IRTF in the thermal IR, Europlanet Science Congress 2026, The Hague, The Netherlands, 7–11 Sep 2026, EPSC2026-560, https://doi.org/10.5194/epsc2026-560, 2026.


