
 1,2,1,1,4,
- 1Istituto Nazionale di Astrofisica – Istituto di Astrofisica e Planetologia Spaziali (INAF-IAPS), Via del Fosso del Cavaliere, Rome, Italy (federico.colaiuta@inaf.it)
- 2Sapienza University of Rome, Piazzale Aldo Moro, 00185 Rome, Italy
- 3Dipartimento di Scienze della Terra, Università degli Studi di Firenze, Florence, Italy
- 4School of Physical Sciences, The Open University, Robert Hooke Building, Kents Hill, Milton Keynes, United Kingdom
Introduction: Water on the Moon remains one of the major topics in lunar science, particularly in the context of future crewed missions and the need to assess the abundance and potential extractability of lunar resources. Within this framework, the Mairan crater region (~41.6°N, 44.5°E; Figure 1a) represents a particularly interesting case study, owing to previously reported hydrogen anomalies [1] and to the rare availability of spatially and temporally overlapping imaging spectroscopy datasets acquired by the Chandrayaan-1/Moon Mineralogy Mapper (M³) in both global-mode and target-mode observations [2,3].
Methods and data: We analyzed high-quality M³ observations acquired during the OP1B and OP2A mission phases [3], corresponding respectively to global-mode data collected at ~08:15 LST and target-mode data acquired at ~15:40 LST. These datasets were selected to ensure optimal radiometric stability [4] and to enable a robust comparison of morning and afternoon spectral conditions across the Mairan crater region. The reflectance spectra were first photometrically corrected using the standard M³ team pipeline [5] and subsequently smoothed with a Savitzky–Golay filter. To minimize the influence of thermal residuals, we applied and compared three independent correction strategies: (i) a data-driven empirical method [6], (ii) a semi-empirical channel-ratio approach calibrated in the laboratory [7], and (iii) a roughness-aware thermal model partly based on the framework [8].
To investigate surface composition, optical maturity, hydration, and their possible local-scale interrelationships, we computed a suite of spectral indices and performed non-linear spectral unmixing over the 0.7–2.3 µm range [9]. This approach allowed us to further characterize compositional variability and the relative enrichment in darkening and reddening agents, such as nanophase metallic iron, using LSCC spectra as the reference spectral library [10]. The OH/H₂O abundance was estimated through the Effective Single-Particle Absorption Thickness parameter (ESPAT), which is linearly correlated with OH/H₂O content [11] and was retrieved using Hapke’s radiative transfer model [12].
For the target-mode observations, we additionally applied a K-Means cluster-based analysis to mitigate signal-to-noise limitations [10] and to better distinguish spectrally and geologically distinct terrain units. The number of clusters identified via the elbow-criterion is equal to seven (Figure 1).
Finally, we extended the spectral unmixing analysis to continuum-removed spectra in the 2.5–3.0 µm range. This step was designed to exploit the finer spectral sampling of the target-mode data and to investigate the possible origin of the structural-OH signature identified in the mid-afternoon observations.
Results and conclusions: Our analysis reveals a pronounced diurnal variability of the OH/H₂O signature across the Mairan region. Estimated abundances decrease from ~451 ppm in the early morning to ~100 ppm over the Procellarum Terrain and ~89 ppm over the Mairan Peninsula in the mid-afternoon, corresponding to an overall reduction of ~60–80%. This decrease is associated with a spectral evolution from a broad, composite hydration feature under colder morning conditions to a sharper absorption centered near ~2.75 µm in the afternoon (Figure 2). The persistence of this band after the application of three independent thermal-correction approaches supports the presence of a stable, structurally bound OH component in the uppermost regolith.
Spectral unmixing of the 2.5–3.0 µm region suggests that this residual mid-afternoon structural-OH is predominantly exogenous, with irradiated basalts and Apollo samples [13] emerging as the main spectral endmembers and no clear evidence for significant endogenous contributions. Within the Mairan Peninsula units, the ~2.75 µm band depth appears to increase with the abundance of npFe⁰ retrieved via spectral unmixing (Figure 3), possibly indicating that mature, glassy, amorphous, and/or defect-rich regolith components provide favorable sites for retaining implanted protons against thermal desorption. Although the limited number of clusters prevents a robust correlation analysis, this trend points to a potential link between solar-wind-derived OH stability and regolith microstructure. Overall, hydration in the Mairan region appears widespread and potentially multi-phase in the early morning, whereas by mid-afternoon it becomes more selectively retained as structurally bound OH controlled by exogenous processes and local regolith properties.
Acknowledgments: The authors acknowledge support from the Space It Up project, funded by the Italian Space Agency and the Italian Ministry of University and Research. Contract n. 2024-5-E.0 – CUP n. I53D24000060005.
References:
[1] Lawrence, D. J. et al. (2022) Journal of Geophysical Research, Planets, 127(7).
[2] Pieters, C.M. et al. (2009) Science, 326(5952), 568-572.
[3] Green, R.O. et al. (2011) Journal of Geophysical Research, Planets, 116(E10).
[4] Clark, R.N. et al. (2024) The Planetary Science Journal, 5(9).
[5] Besse, S. et al. (2013) Icarus 222(1).
[6] Clark, R.N. et al. (2011) Journal of Geophysical Research, Planets, 116(E6).
[7] Li, S. & Milliken, R.E. (2016) Journal of Geophysical Research, Planets, 121(10).
[8] Wohlfarth, K. et al. (2023) Astronomy & Astrophysics, 674(A69).
[9] Hesse, M. et al. (2021) Remote Sensing 13(22), 4702.
[10] Taylor, L. A. (2001) Journal of Geophysical Research: Planets, 106(E11).
[11] Li, S. & Milliken, R.E. (2017) Science Advances, 3(9).
[12] Hapke, B. (1984) Icarus, 59(1), 41-59.
[13] Yeo, L.H. et al. (2025) Journal of Geophysical Research, Planets, 130(E3).
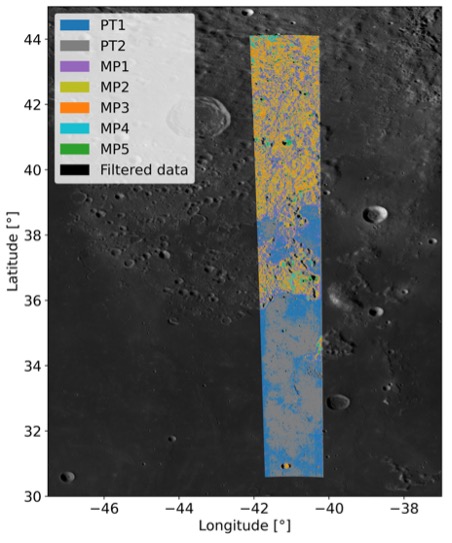
Figure 1. Clusters identified from the K-Means analysis of principal components retrieved through PCA decomposition of target-mode data, characterizing the eastern part of the ROI.
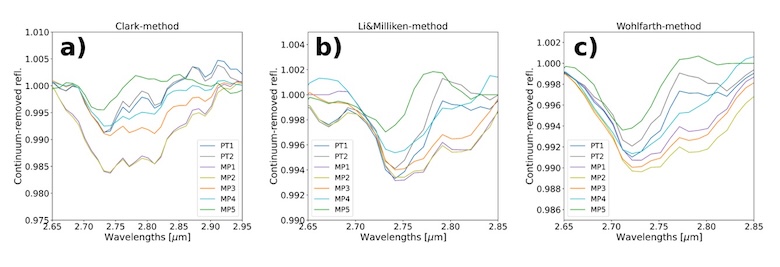
Figure 2. Hydroxyl absorption bands for the clusters identified in Figure 1 using the three thermal removal approaches applied in this study.

Figure 3. OH-band depth as a function of the abundance of npFe⁰ retrieved through 0.7–2.3 µm spectral unmixing. The trend obtained with the Clark method (a) is ambiguous, potentially due to an underestimation of thermal emission [7,8]. In contrast, the trends derived using the empirical approach [7] (b) and the roughness-informed model [8] (c) are comparable and consistent with a linear relationship, as indicated by the χ² values reported in panels (b) and (c).
How to cite: Colaiuta, F., Tosi, F., Zambon, F., Pratesi, G., Anand, M., and Boruah, M. K.: Revealing the Surface Composition and Hydroxyl Variability near Mairan Crater with Moon Mineralogy Mapper (M3) Data Combined with Spectral Unmixing Techniques, Europlanet Science Congress 2026, The Hague, The Netherlands, 7–11 Sep 2026, EPSC2026-625, https://doi.org/10.5194/epsc2026-625, 2026.


