
- 1Planetary Science Institute, Tucson, United States (shill@psi.edu)
- 2Space Sciences Laboratory, UC Berkeley, United States (mikewong@ssl.berkeley.edu)
Introduction
Recent observations of Jupiter by HST for the first time used the F645N filter, which is sensitive to ammonia absorption. In combination with the methane sensitive FQ619N filter, both effective cloud-top pressure and ammonia mole fraction can be retrieved using image ratio techniques. Here we present initial results from observations in the last quarter of 2025, focusing on Equatorial Zone (EZ) features. The EZ is important because it exhibits a wide variation in ammonia and cloud structure so that different atmospheric depths and dynamical processes can be probed. The northern EZ exhibits longitudinally periodic features related to a trapped global atmospheric wave there. The wave manifests itself in features including 5µm hot-spots, cloud plumes, and anticyclonic gyres slightly to the south of the other two features. Overall, the EZ is enriched in ammonia, generally more so north of the equator. The North Equatorial Belt (NEB), adjacent to the EZ, is highly depleted in ammonia with little longitudinal variation. Our goals are to 1) Determine whether the measured horizontal spatial variations in ammonia mole fraction represent true physical variations or are simply reflective of measurements of a spatially uniform profile at different cloud pressures and 2) To distinguish the ammonia and cloud properties associated with visually recognizable features and tying them to physical processes.
Discussion
Using the band-approximation technique we compute the cloud pressure, PCld, and ammonia mole fraction, fNH3, at each mapped latitude and longitude [1, 2]. In addition, we compute the Altitude Opacity Index (AOI, R889/R275) and Color Index (CI, R395/R631) of each location [3]. The spatial sampling of the maps is 0.05° x 0.05°. In addition, we create tricolor images for visual context (RGB: 673, 502, 395 nm) and to locate deeper clouds and higher hazes (RGB: 673,727, 889 nm) [4]. We restrict our analysis to specific groups of features near the sub-observation point and apply an empirical flattening function to the data to mitigate mild limb darkening effects that occur within 30° of the central meridian.
Two approaches are taken to feature evaluation. First, features of interest are identified by a combination of visual inspection and traditional image and data segmentation techniques. Regions of Interest (ROIs) are generated either by bounding boxes in latitude and longitude drawn around the areas believed to best represent the features or by the raw segmented feature boundaries. Then, clustering analysis is performed graphically and statistically, comparing the samples bounded by the ROIs to each other and to the parent population of the entire mapped area. The ammonia mole fraction and cloud pressure data are visualized in Fig. 1 and show statistically distinct clusters for including 5µm hot-spots, cloud plumes, and anticyclonic gyres. In addition, we look at normalized residuals between fNH3 and PCld to determine where excesses and deficits of ammonia exist beyond what would be expected with a linear relationship between ammonia and cloud pressure. Finally, we look at moving box correlations to see whether within localized areas small-scale variations in cloud pressure yield positive, negative, or neutral correlations with ammonia mole fraction. Finally, we examine color correlations and overlying hazes using the color index and altitude opacity index.
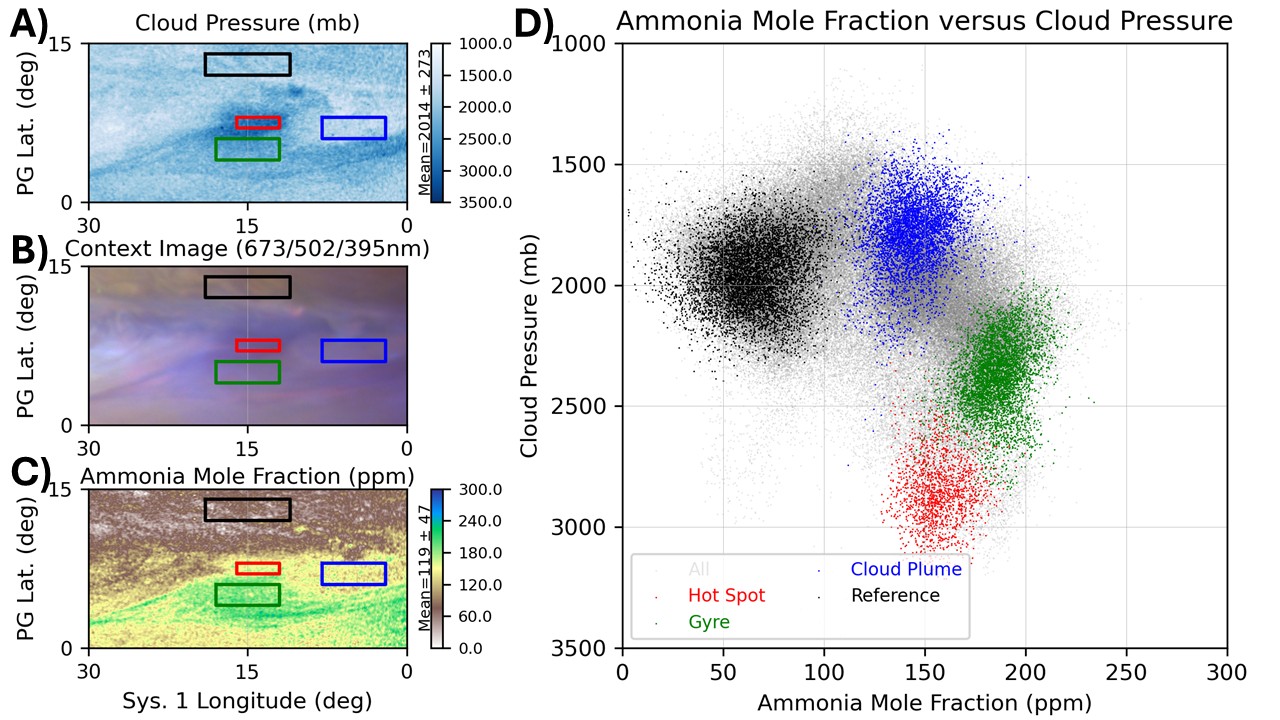
Figure 1. Using HST demonstrates the ability to map cloud-top pressure, PCld, and ammonia mole fraction, fNH3, using high-resolution imaging without full spectra (A, C) while providing visual context (B). The band-approximation method [1] is used (described in the text) and a portion of the northern EZ is shown. Boxed areas highlight feature types related to the EZ planetary wave discussed in the text. D) Scatter plot of PCld versus fNH3 for features shown in Fig. 1 (hot-spot, cloud plume, gyre, and the NEB used as a reference) showing clearly separated clustering.
Second, an unsupervised Machine Learning (ML) approach using a Gaussian Mixture Model (GMM) is applied to the reflectivity data, the retrieved parameters, and the indices to determine if the human identified regions of interest do or do not correspond to objectively determined clusters in the data. If they do, then this is a strong confirmation of the traditional perception and interpretation of data. If the clustering differs significantly from traditional analysis, this can point to either a weakness in the ML model, or potentially new physics about the relationships between ammonia and cloud pressure for different features. Evaluation of variations in the GMM models and performance with the number of clusters prescribed will be necessary for model optimization. Initial trials with the GMM using just fNH3and PCld show that it seems to identify major features and conditions similar to those identified by a traditional means.
Future Work
Next steps include the improvement of the limb correction for the HST data to address observation time offsets between some of the filter data. We will further develop both the traditional and ML methods and codes so that the full HST data set, including upcoming observations this fall, can be analyzed with a uniform methodology. Finally, we will look for features appearing at multiple viewing angles in the data, which will allow us to use limb darkening to our advantage to explore vertical profiles of aerosols and ammonia.
References
- Hill, S.M., et al., Spatial Variations of Jovian Tropospheric Ammonia via Ground-Based Imaging. Earth and Space Science, 2024. 11(8): p. e2024EA003562.
- Irwin, P.G.J., et al., Clouds and Ammonia in the Atmospheres of Jupiter and Saturn Determined From a Band-Depth Analysis of VLT/MUSE Observations. Journal of Geophysical Research: Planets, 2025. 130(1): p. e2024JE008622.
- Sánchez-Lavega, A., et al., Colors of Jupiter's large anticyclones and the interaction of a Tropical Red Oval with the Great Red Spot in 2008. Journal of Geophysical Research (Planets), 2013. 118: p. 2537-2557.
- Wong, M.H., et al., Deep Clouds on Jupiter. Remote Sensing, 2023. 15: p. 702.
How to cite: Hill, S., Tiktin, L., and Wong, M.: HST Observations of Jupiter’s Ammonia and Cloud Pressure: Initial Results, Europlanet Science Congress 2026, The Hague, The Netherlands, 7–11 Sep 2026, EPSC2026-698, https://doi.org/10.5194/epsc2026-698, 2026.


