
 5,
5,- 1LATMOS/IPSL, Sorbonne Université, UVSQ, CNRS, Paris, France (alice.legall@latmos.ipsl.fr)
- 2School of Earth and Atmospheric Sciences, Georgia Institute of Technology, Atlanta, GA 30332, USA (indujaa@gatech.edu)
- 3Department of Earth, Environmental, and Planetary Science, Washington University in St. Louis, St. Louis, MO 63130, USA (paul.byrne@wustl.edu)
- 4Institute of Northern Engineering, University of Alaska Fairbanks, Fairbanks, AK 99775 (rrherrick@alaska.edu)
- 5Department of Earth, Planetary, and Space Sciences, University of California, Los Angeles, 595 Charles E. Young Dr. E, Los Angeles, CA 90095, USA (jlm@epss.ucla.edu)
- 6Southwest Research Institute, 1301 Walnut Street, Boulder CO, 80302, USA (jessup@boulder.swri.edu)
Introduction and motivation
The surface of Venus, our closest yet strikingly different planetary neighbor, has not been observed from orbit for 30+ years, since the Magellan mission, whose radar operated at 2.4 GHz (12.6 cm wavelength). This long observational gap will soon end thanks to the selection, in 2021, of two new radar missions : NASA’s VERITAS mission with VISAR (7.9 GHz, 3.8 cm) and ESA’s Envision mission with VenSAR/EuroSAR (3.2 GHz, 9.5 cm).
VenSAR/EuroSAR, contrary to VISAR, includes a passive radiometry mode designed to measure the microwave thermal emission from the surface of Venus. In its radiometry mode, as a baseline, it will operate in a nadir or near-nadir viewing geometry but opportunistic off-nadir horizontal and vertical (H&V) polarized measurements will be performed in specific regions of interest (RoIs).
Among these RoIs are several regions, primarily located at high elevations, that exhibit anomalously low emissivity in Magellan observations. These values have been interpreted as evidence for extremely high dielectric permittivity (up to ~80) [e.g., 1,2] linked to the presence of very unusual minerals (e.g., ferroelectric substances [e.g., 3,4]), due to the cold trapping of exotic volatile species, or yet unidentified weathering reactions. Alternatively, low emissivity may result from strong small-scale roughness or from a low-loss substrate of moderate permittivity where volume scattering dominates [1]. Off-nadir polarized radiometry from EnVision will help discriminate between these scenarios by constraining effective permittivity and separating volume scattering from roughness effects.
In this work, we analyze the limited polarized radiometry data from the Magellan mission to prepare for the scientific exploitation of the Envision VenSAR/EuroSAR polarimetric radiometry experiments. We focus on observations over Ovda and Beta Regios, two prominent examples yet completely different of highland regions characterized by anomalously low emissivity, with Ovda being tessera-dominated and Beta being volcano-dominated.
Magellan radiometry data and method
The Magellan radar mapped the surface of Venus at 12.6 cm over three cycles from September 1990 to September 1992. Data were acquired from a near-polar elliptical orbit, primarily in H-polarization, at incidence angles of 15°-45°, using a left-looking geometry during cycles 1 and 3 and a right-looking geometry during cycle 2. By mission end, ~98% of the surface had been mapped in both active and passive modes.
In its passive operating mode, the Magellan radar functioned as a microwave radiometer, recording the surface brightness temperature, which can be directly converted into emissivity. To first order, emissivity is controlled by the permittivity of the surface, itself primarily related to the bulk composition and density of the surface material. It can therefore be used to discriminate between different surface units.
Planetary surface materials typically exhibit permittivities between 3 and 10. On Venus, Magellan H-polarized emissivity data suggest that the lower end of this range corresponds to low-density rock powders [5], while the extensive plains show values of 4.0–4.5, consistent with moderately dense basaltic material. As previously mentioned, Magellan also identified several high-elevation regions with anomalously low emissivity, generally interpreted as evidence for unusually high permittivity.
Though the Magellan data were collected primarily in H-polarization, a small number of orbits were collected with V polarization. Co-located H and V data can be used to derive the Degree of Polarization (DoP), defined as
where and denote the horizontally and vertically polarized emissivities, respectively. The DoP is generally less sensitive to surface roughness than either individual emissivity component and can be used to provide an independent estimate of the permittivity through comparison with emissivity models (Fig. 1).
For this work, (i) we identified all available co-located H- and V-polarized radiometry observations, (ii) rasterized these data onto a common spatial grid with a resolution of 0.1° in latitude and longitude (about 10 km at the equator), (iii) constructed maps of the DoP (Fig. 2a), and (iv) estimated the surface permittivity for each pixel by inverting the White and Cogdell (1973) model [6] (Fig. 2b). This model relates the DoP to permittivity and large-scale surface roughness (expressed as rms slope) for rough planetary surfaces, more specifically Kirchhoff-like surfaces without small-scale roughness or volume scattering effects. The retrieved permittivity values can then be compared with the H-polarized emissivity measurements to quantify the extent to which the Venusian surface departs from an ideal Kirchhoff surface.
Results and future work
Fig. 1 shows that the measured DoP follows the expected trend with local incidence angle for permittivities of approximately 3-4, while also revealing regions of high permittivity. Fig. 2a displays the DoP map obtained from co-located polarized measurements acquired over Ovda Regio. Elevated DoP values are clearly associated with Ovda Regio, indicating higher local permittivity and confirming the expected correlation between low H-polarized emissivity and high DoP. Fig. 2b presents the retrieved permittivity values as a function of altitude in Ovda Regio. It confirms the presence of exceptionally high permittivity values in this region as well as the decrease of the permittivity at the highest elevations. Similar results will be shown and discussed for Beta Regio and compared to the backscatter values measured in the active mode of the radar.
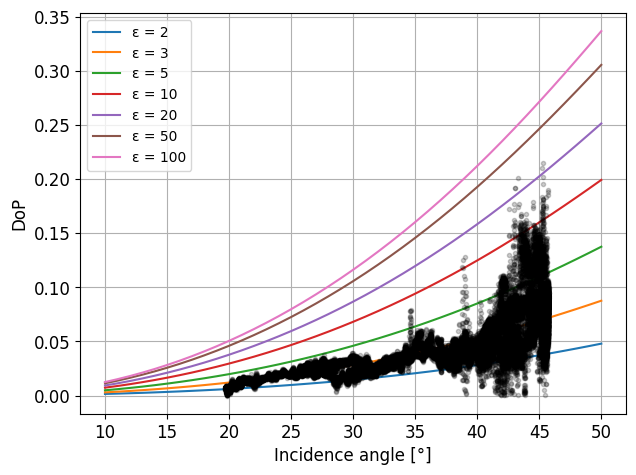
Fig. 1: Measured DoP (black dots) as a function of the incidence angle compared to predictions from the White and Cogdell (1973) model for different values of permittivity ε and a rms slope of 15°.
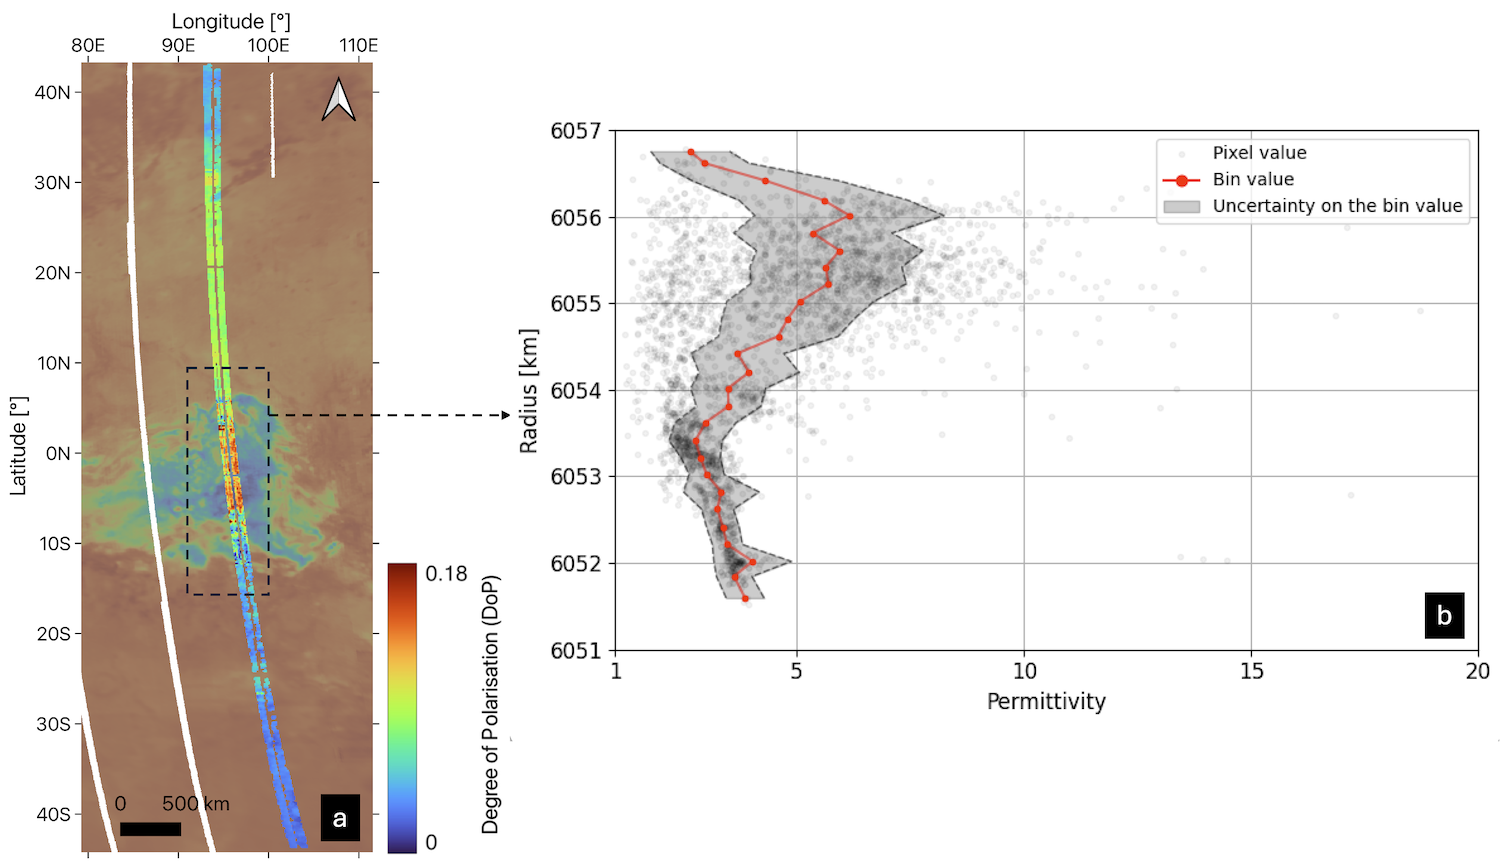
Fig. 2: (a) Map of the DoP around Ovda Regio overlaid on the Magellan H-polarized emissivity mosaic. (b) Estimated permittivity as a function of the altitude in the Ovda Regio (for an assumed rms slope of 15°).
1. Arvidson et al., 1991, New Series 252, 270- 275
2. Pettengill et al, 1992 J. Geophys. Res. 97(E8):13067–13090
3. Shepard et al., 1994, Geophys. Res. Lett. 21-6, 469-472
4. Treiman et al., 2016, Icarus 280, 172-182
5. Campbell and Campbell, 1992, J. Geophys. , 97, 16293-16314
6. White and Cogdell, 1973, Moon 6, 235–249
How to cite: Le Gall, A., Menard, R., Lanoix, L., Ganesh, I., Byrne, P., Herrick, R., Margot, J.-L., and Jessup, K.: Polarized microwave radiometry observations of Ovda and Beta Regios : Insights into Venus’ surface composition and texture, Europlanet Science Congress 2026, The Hague, The Netherlands, 7–11 Sep 2026, EPSC2026-799, https://doi.org/10.5194/epsc2026-799, 2026.


