
 1,2,3,2
- 1CNRS DR04 - Sorbonne Universite, Laboratoire de Météorologie Dynamique, Paris Cedex 5, France (peng.han@lmd.ipsl.fr)
- 2Planetary Atmosphere Group, Institute for Basic Science, Daejeon,South Korea
- 3Yonsei Univ. Seoul, South Korea
Introduction
The Venus Planetary Climate Model (Venus PCM) is a full-physics atmospheric model designed to simulate the thermal structure and circulation of Venus from the surface to the upper atmosphere. The model couples the dynamical core with a radiative transfer scheme that allows the temperature field to be computed self-consistently[1]. The solar radiation module of the Venus PCM was updated using a two-stream scheme from the Generic PCM, allowing a full coupling between solar heating rates, cloud particles and atmospheric composition. The thermal infrared transfer is treated using a Net Exchange Rate matrix formalism[2]. This infrared scheme computes radiative exchanges between atmospheric layers, the surface, and space over the 1.7–250 μm spectral range, allowing radiative heating and cooling rates to be evaluated consistently within the Venus PCM[3]. The opacity calculation includes molecular absorption, cloud opacity, and continuum/CIA contributions, with cloud optical properties commonly based on the Haus cloud model retrieved from Venus Express and Venera observations[4]. For this framework, studying the Venus lower atmosphere is particularly important because uncertainties on opacity and continuum absorption in several windows strongly affect the radiative exchange between the deep atmosphere and the cloud layer.
Control parameters of cloud layer and deeper atmosphere
Particular attention was given to the opacity in the infrared windows between 2 and 10 μm, as well as in the 18-30 μm region, in the far wing of the 15-μm band of CO₂, since these spectral intervals regulate the radiative exchanges between the deep atmosphere, the cloud base, and the overlying cloud layer, and therefore strongly influence the simulated temperature profile from the cloud convective region to the surface. However, after updating the CO₂–CO₂ CIA and CO₂ line-shape treatments[5,6], the modeled opacity in these windows remains insufficient to reproduce the observed thermal structure, leading to excessive radiative cooling and underestimated temperatures in the lower atmosphere.
Temperature structure in the cloud
The temperature at the cloud base mostly depends on the amount of solar energy absorbed in the middle cloud and below, as this energy is balanced by thermal emission mostly to space in the 10-30 μm spectral region at the top of the convective layer (interface between upper and middle cloud, as shown in the Figure 1).
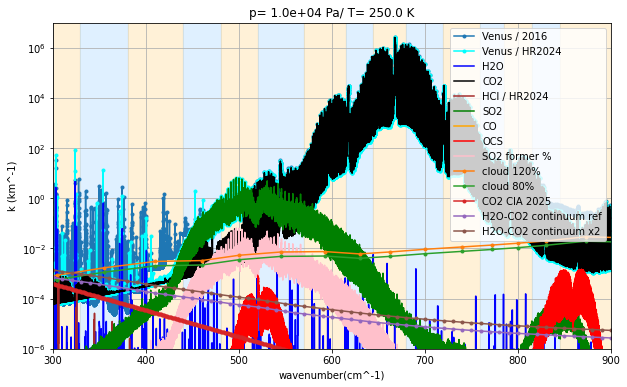
Figure 1. This figure compares the spectral contributions of different opacity sources at the level 1x10⁴ pa and 250k (nearly the top pf the convective layer), including the 2016 reference dataset, the updated HR2024 dataset, individual gas absorptions, cloud extinction, and CIA/continuum terms. Gas lines dominate the strong absorption regions, while clouds and continuum absorption provide smoother background opacity. The shading color on the background represents the narrowbands used in the radiative transfer modules.

Figure 2. Net infrared flux per narrowband (positive upward),which illustrates the energy exchange from layer to layer in every narrowbands. Left plot: corresponding to the Figure1 SO2 curve (green line) Right plot: Figure 1 SO2 former curve (pink line)
To evaluate the sensitivity of radiative transfer in the 18-30 μm spectral window, we performed a series of sensitivity experiments in which the SO₂ abundance, cloud optical thickness, and H₂O mixing ratio were adjusted within observationally constrained ranges. These tests were designed to isolate the relative influence of key opacity sources on the thermal structure of the Venus atmosphere, with particular emphasis on the potential temperature response within the cloud layer and near the cloud base.
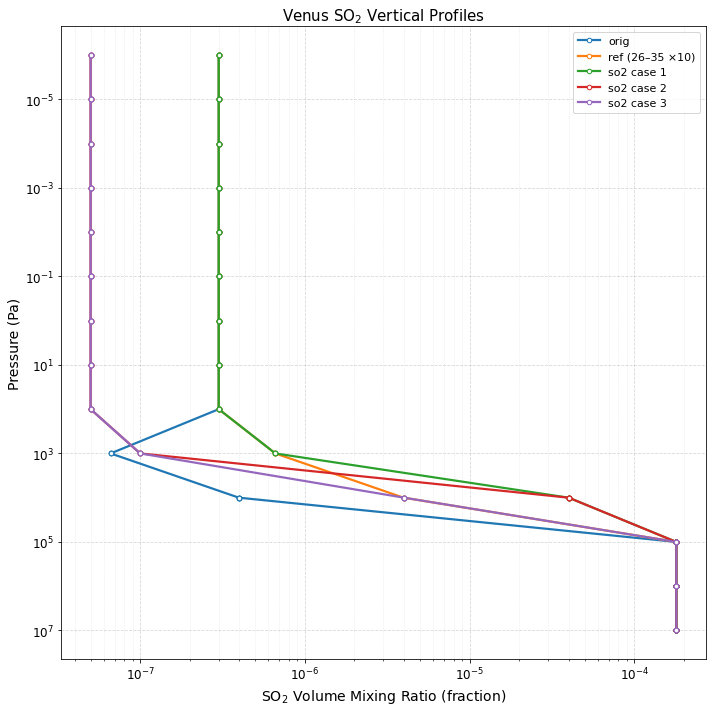

Figure 3. Potential temperature of different SO2 concentration cases
Stability in the stable layer below the cloud
With the obtained shape of the opacity in the 2-10 micron spectral region, energy exchanges between lower layers and the cloud base are too efficient in the stable layer (30-50 km), leading to under-estimated temperatures in the deep atmosphere. To further investigate the origin of this excessive radiative coupling, we tested the sensitivity of the model to the H₂O–CO₂ continuum absorption and to different vertical distributions of H₂O volume mixing ratio below the clouds. The results indicate that H₂O plays a major role in controlling the radiative stability of the deep atmosphere. In particular, doubling the H₂O continuum reduces the transparency of the 5–10 μm window and increases the potential temperature under the cloud base by approximately 30K. Similarly, increasing the H₂O abundance in the sub-cloud region modifies the net infrared flux and weakens the excessive energy exchange between the deep atmosphere and the cloud layer. These experiments suggest that even moderate changes in H₂O opacity can produce a significant response in the thermal structure below the clouds.
The influence of other relevant sources of opacity and comparison with latest reasearch have been explored: HCl and CO2 dimer CIA in 3-4 micron window, CO in 2.3 micron window[7][8]. These three spectral regions are key to control the radiative exchanges between the deep atmosphere and the cloud base and therefore represent critical targets for improving the representation of lower-atmosphere stability in the model.
References
[1] Garate-Lopez, I., & Lebonnois, S. (2018). Icarus, 314, 1-11, doi : 10.1016/j.icarus.2018.05.011
[2] Eymet, V.,et al. (2009). Journal of Geophysical Research: Planets, 114(E11), doi : 10.1029/2008JE003276
[3] Lebonnois, S.,et al. (2015). Journal of Geophysical Research: Planets, 120(6), 1186-1200, doi : 10.1002/2015JE004794
[4] Haus R, Kappel D, Arnold G.(2015). Planetary and Space Science, 117:262-294. doi:10.1016/j.pss.2015.06.024
[5] Tran, H et al. (2011). Journal of Quantitative Spectroscopy and Radiative Transfer, 112(6), 925-936, doi : 10.1016/j.jqsrt.2010.11.021
[6] Tran, H et al. (2024). Icarus 422, 116265, doi: 10.1016/j.icarus.2024.116265
[7] Takahashi et al. (2023). Journal of the Meteorological Society of Japan 101, 39–66, doi: 10.2151/jmsj.2023-003.
[8] Takahashi et al. (2024). Journal of the Meteorological Society of Japan, 102, 469–483, doi: 10.2151/jmsj.2024-025.
How to cite: Han, P., Lebonnois, S., Kang, H., and Lee, Y. J.: Radiative control of Venus atmosphere temperature structure, Europlanet Science Congress 2026, The Hague, The Netherlands, 7–11 Sep 2026, EPSC2026-806, https://doi.org/10.5194/epsc2026-806, 2026.


