
 ,,,,,
,,,,,- Istituto di Astrofisica e Planetologia Spaziali, Istituto Nazionale di Astrofisica, Roma, Italy (monica.rasmussen@inaf.it)
Introduction
Oxia Planum (Fig. 1) is a region of Mars located on the margin between the old, heavily cratered highlands of Arabia Terra (Noachian-aged) and the younger, smoother lowlands of Chryse Planitia (Hesperian-aged). From orbit it shows several geomorphological records of past widespread water–rock interactions, including fractured, layered, clay-bearing deposits with high astrobiological potential [1, 2, 3]. For this reason, Oxia Planum has been selected as the landing site for the ESA Rosalind Franklin Mission (RFM). The main goal of the RFM is to search for past (and/or present) traces of life, particularly in the Martian shallow subsurface where material of astrobiological interest is better preserved. To achieve this, the RFM rover is equipped with a drill capable of collecting, for the first time for a mission on Mars, samples down to a depth of 2 meters, and with a suite of instruments designed to discriminate biosignatures in the samples, gathering supporting geological context information [4].
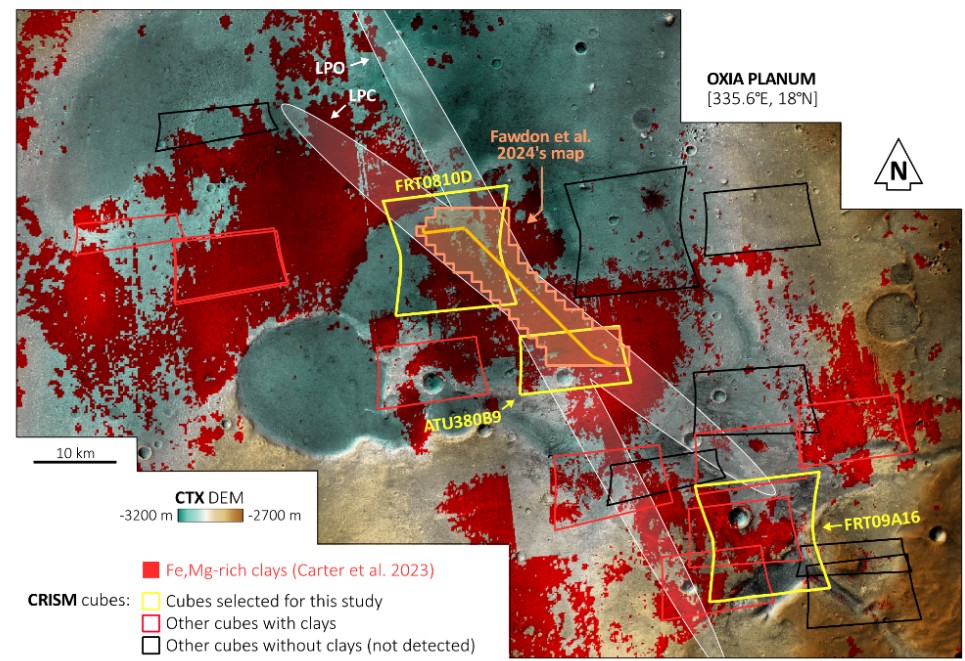
Figure 1: Oxia Planum, Mars with CTX basemap colored by elevation. The white ellipses represent the current landing ellipses, and the orange polygon in center represents the outline of the geologic map of the region [5], with the map’s cross-section added in orange. Note that two cubes selected for study overlap with the geologic map while one cube for study is towards the delta and outside the previously mapped area.
Here, we focus on selected regions of interest (ROIs) within the Oxia Planum landing area (Fig. 2) to investigate how clay distribution relates to other geologic features. We incorporate an Oxia Planum survey of fractures mapped at 1:1250 scale in spaced windows (e.g., blue squares in Fig. 2) which provides the general fracture characteristics of multiple units. Within ROIs, we repeat this fracture mapping to connect the geomorphological and spectral analysis with bedrock fracture behavior to more fully characterize the rocks, and contribute to strategies for guiding the selection of drilling sites.
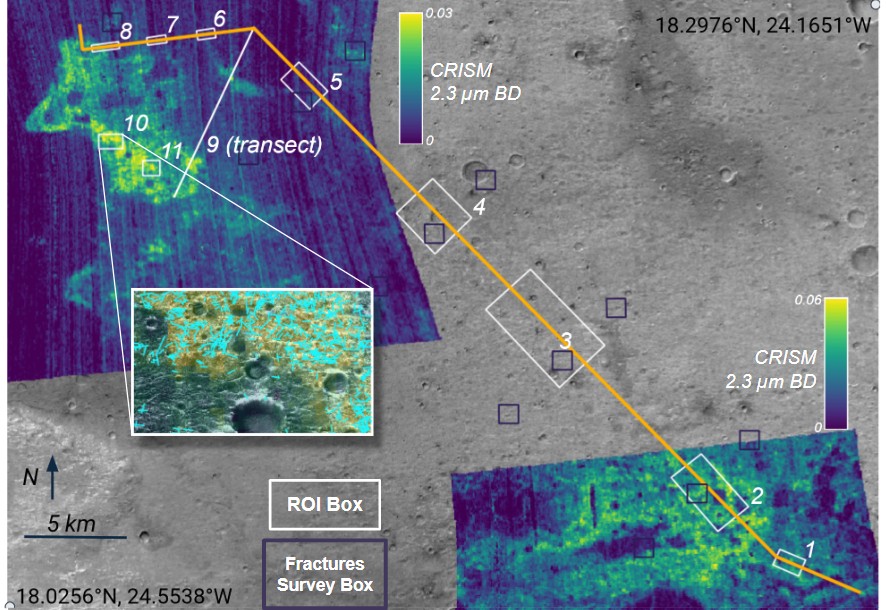
Figure 2: CRISM spectral maps of the 2.3 micron band depth [3] where yellow tones represent high Fe,Mg-phyllosilicate signatures, with CTX basemap as background and the geologic cross-section [5] overlain in orange. The ROIs are shown and labeled in white. Dark blue squares represent areas where regional fracture analysis has been performed to aid in extending the geologic mapping to unmapped areas. Inset of ROI 10 shows the fractures which have been mapped (blue) on HiRISE imagery (shown), and exhibit a strong correlation with clay-rich areas.
Data and Methods
ROIs were chosen based on (1) mapped contacts between bedrock units [5], (2) stratigraphic exposures within mounds and/or crater walls, (3) association with the geologic cross-section [5], and/or (4) high likelihood of encountering phyllosilicates (Fe,Mg-rich clays), based on CRISM cube analysis [3]. The southernmost CRISM cube of interest, FRT09A16 (Fig. 1), is located near the delta containing sediments derived from the highlands, thus providing a key insight into the stratigraphic relationships and depositional modes of the units farther downslope. Within ROIs, we created meter-scale resolution digital terrain models (DTMs) using the NASA Ames Stereo Pipeline and HiRISE stereopairs, tied to MOLA elevations.
Fracture mapping was performed on HiRISE images which were manually georeferenced to improve their correlation with CRISM data. Mapping at 1:2000 scale (minimum resolvable fracture size approximately 10m) provides comparable data to the fracture survey, providing a dataset that aids in expanding geologic units beyond the current bounds of the map [5]. Detailed mapping at 1:1000 scale, following [8], has sufficient detail to analyze fracture topology, improving unit characterization and providing insight into fracture formation mechanisms [e.g., 9].
Preliminary results and Discussion
Figure 3 compares the DTM created from HiRISE using the NASA Ames Stereo Pipeline [6] with the MADNET DTM [7] created through machine learning, both of which are based on HiRISE images. The example shows the subdued elevation changes of the MADNET DTM, where the elevation decrease from west to east is partially inherited within the crater rim elevations. The Ames Stereo Pipeline DTM shows a more accurate crater depth-to-width ratio of approximately 0.1, with the crater rim maintaining a realistic cross-sectional shape and the elevation change mostly impacting the surrounding landforms.
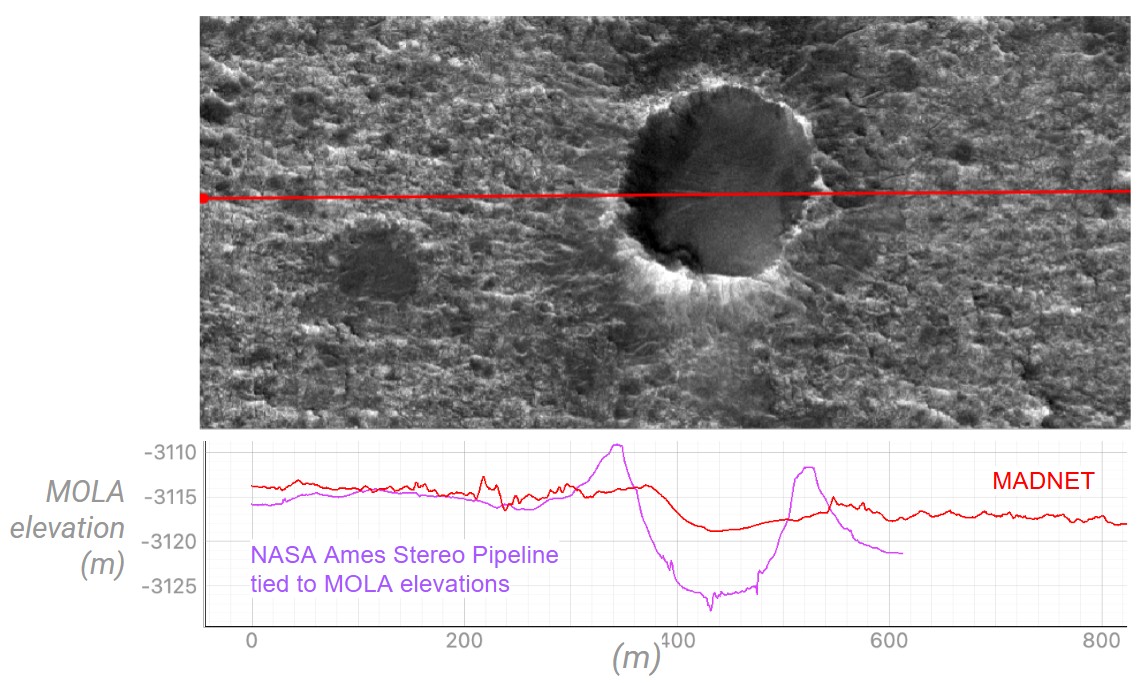
Figure 3: Example DTM quality comparison at a crater near transect 9 (Fig. 2), with the MADNET DTM [7] shown in red and the DTM from Ames Stereo Pipeline [6] shown in purple (this work).
Fracture mapping performed across the broader area shows that the phyllosilicate clays exhibit a higher number (fracture density) and sum length (fracture intensity) of fractures per area, relative to low-clay areas that are also mapped as bedrock units. Preliminary results suggest that this trend is consistent within the ROIs. In the southernmost ROIs which the geologic map does not cover, CTX brightness and CRISM clay signatures are used to identify the clay-rich bedrock groups. We then manually assign unit designations based on comparison with the stratigraphic relationships, fracture characteristics, and geomorphological behavior of the units in mapped regions, leveraging the fracture survey to inform unit extents.
By combining multiple datasets (CTX, CRISM, HiRISE) with different scientific approaches (spectral, fracture, and geomorphological analysis) we provide further context for RFM. Although orbital data only provides information on the surface and limited subsurface exposures, using a combination of geologic approaches allows us to propose realistic subsurface scenarios, critical for mission success in drilling the near subsurface.
Acknowledgements: This work is supported by the ASI-INAF Mars Exploration agreement 2023-3-HH 0 and the European Space Agency (ESA) SKP IDS, F.O.1.05.04.33.13.
References
[1] Mandon L. et al., 2021, Astrobiology, 21(4), 464–480. https://doi.org/10.1089/ast.2020.2292.
[2] Quantin‐Nataf, C., et al., 2021, Astrobiology, 21(3), 345–366. https://doi.org/10.1089/ast.2019.2191.
[3] Brossier, J., et al., 2022, Icarus, 386, 115114. https://doi.org/10.1016/j.icarus.2022.115114.
[4] Vago, J., et al., 2017, Astrobiology, 17(6–7), 471–510. https://doi.org/10.1089/ast.2016.1533
[5] Fawdon, P., et al., 2024, Maps 20 (1), 2302361, https://doi.org/10.1080/17445647.2024.2302361
[6] Beyer, R. A., et al., 2018, Earth and Space Science, 5, 537–548. https://doi.org/10.1029/2018EA000409
[7] Tao, Y., et al., 2021, Remote Sensing, 13(21), 4220, https://doi.org/10.3390/rs13214220
[8] Apuzzo A. et al., 2025, Planetary and Space Science, Volume 267, 2025, 106169, https://doi.org/10.1016/j.pss.2025.106169
[9] Peacock, D., et al., 2026, Earth-Science Reviews, 277, 105461, doi: https://doi.org/10.1016/j.earscirev.2026.105461
How to cite: Rasmussen, M., Altieri, F., Frigeri, A., Brossier, J., Trisic Ponce, J., Saggese, V., and De Sanctis, M. C.: Characterizing clay-rich regions of Oxia Planum, Mars, through geomorphological and fracture analysis, Europlanet Science Congress 2026, The Hague, The Netherlands, 7–11 Sep 2026, EPSC2026-829, https://doi.org/10.5194/epsc2026-829, 2026.


