Multiple terms: term1 term2
red apples
returns results with all terms like:
Fructose levels in red and green apples
Precise match in quotes: "term1 term2"
"red apples"
returns results matching exactly like:
Anthocyanin biosynthesis in red apples
Exclude a term with -: term1 -term2
apples -red
returns results containing apples but not red:
Malic acid in green apples
hits for "" in
Network problems
Server timeout
Invalid search term
Too many requests
Empty search term
TP4

This session is now established for >10 years, and typically attracts a good amount of contributions reflecting the diversity of missions and science questions related to the exploration of Mars' surface and interior.
Session assets
Keywords:
Eberswalde crater, aeolian bedforms, atmospheric circulation, environmental changes.
Introduction
Aeolian bedforms on Mars record past atmospheric circulation. Dune turnover times of tens to hundreds of thousands of years (Fenton and Richardson, 2001) mean that individual bedform generations can reflect the obliquity cycles that drove climate transitions during the Late Amazonian (Laskar et al., 2004). Where multiple generations are preserved and their relative ages established through stratigraphic superposition, successive wind regimes can be reconstructed. Eberswalde Crater (23.5°S, 326.5°E, ~65 km; fig. 1) contains a well-preserved Noachian fluvial delta (Malin and Edgett, 2003; Pondrelli et. al, 2008) whose complex topography interacts with atmospheric circulation, producing a diverse aeolian bedform record and making it a particularly informative site for studying regional wind regimes and local topographic effects.
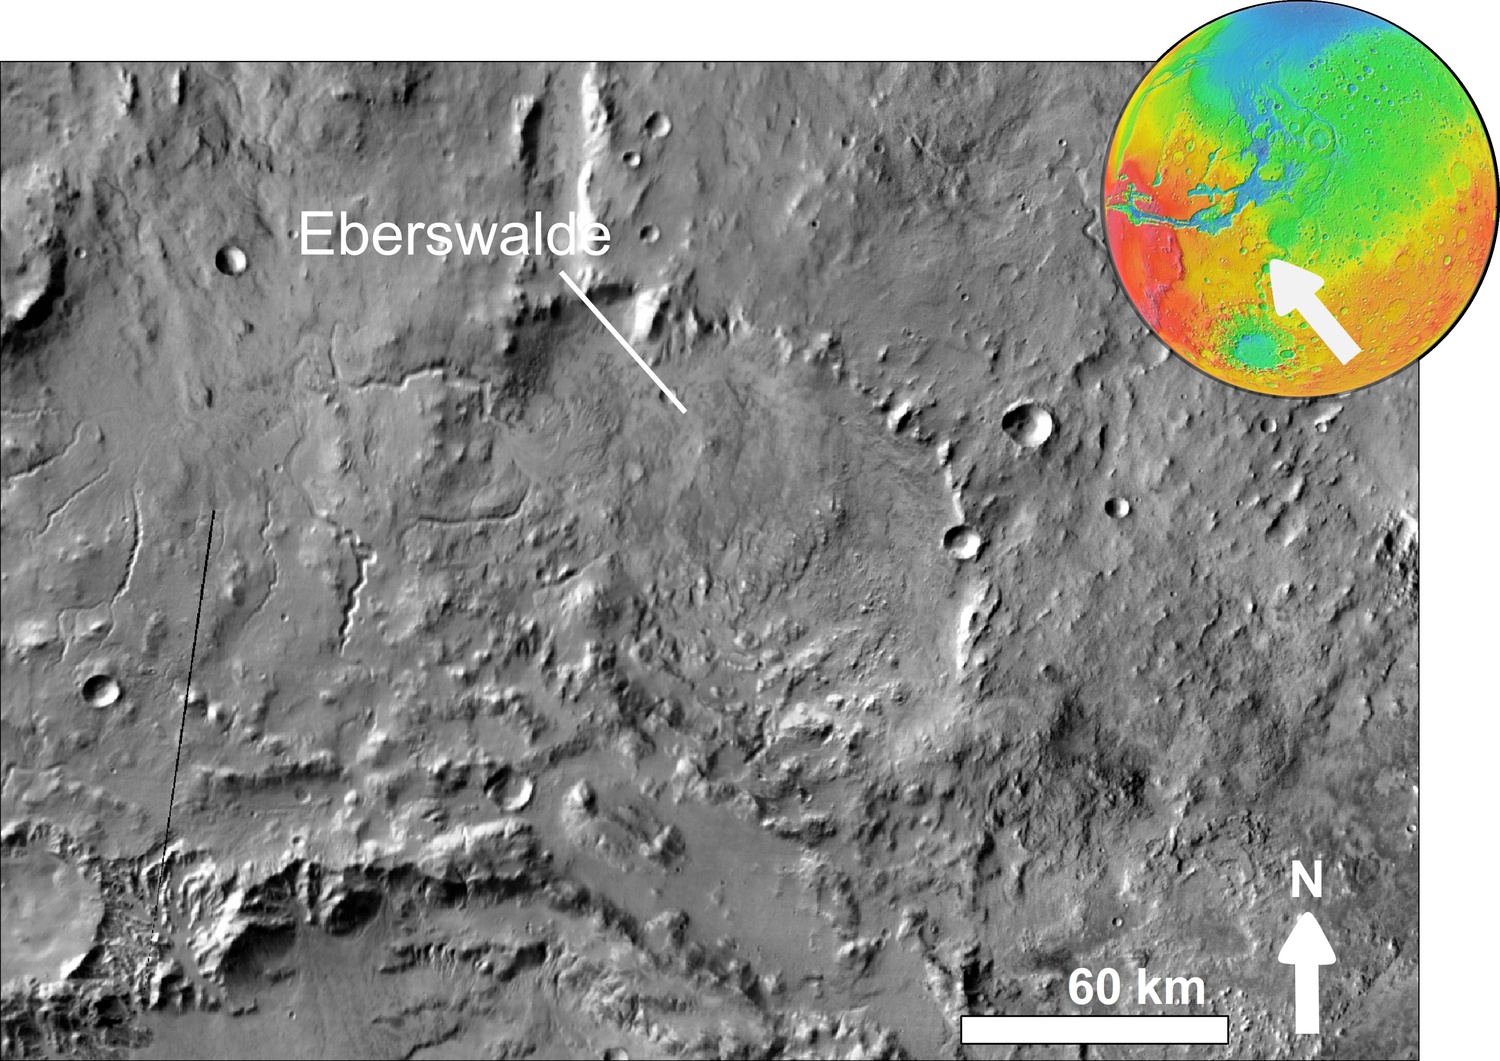
Figure 1. Regional context of Eberswalde Crater (THEMIS infrared mosaic; inset: MOLA topography).
Data and Methods
Mapping was carried out in QGIS v3.40 using HiRISE images (~25 cm/px; McEwen et al., 2007), CTX mosaics (~6 m/px) as basemap (fig. 2), and DEMs from HiRISE stereo pairs (~1 m/px) for 8 areas (A–H); 7 areas (I–Q) used HiRISE 2D only. Each bedform crest was digitized manually; parameters include height, crest length, wavelength, sinuosity, wind direction, topographic influence, type, and generation. Four morphogenetic types (dunes, megaripples, barchan dunes, star dunes) and four generations (G1–G4, oldest to youngest) were identified through crosscutting relationships; 242 bedforms assignable by type but not by generation (ND category), due to absence of crosscutting relationships or multidirectional morphology. Wind directions were reconstructed from stoss–lee side asymmetry (certain) or crest orientation and context (probable); multidirectional bedforms excluded. Present-day winds were extracted from MCD v6.1 (Forget et al., 1999; Millour et al., 2018) at Eberswalde for four solar longitudes.
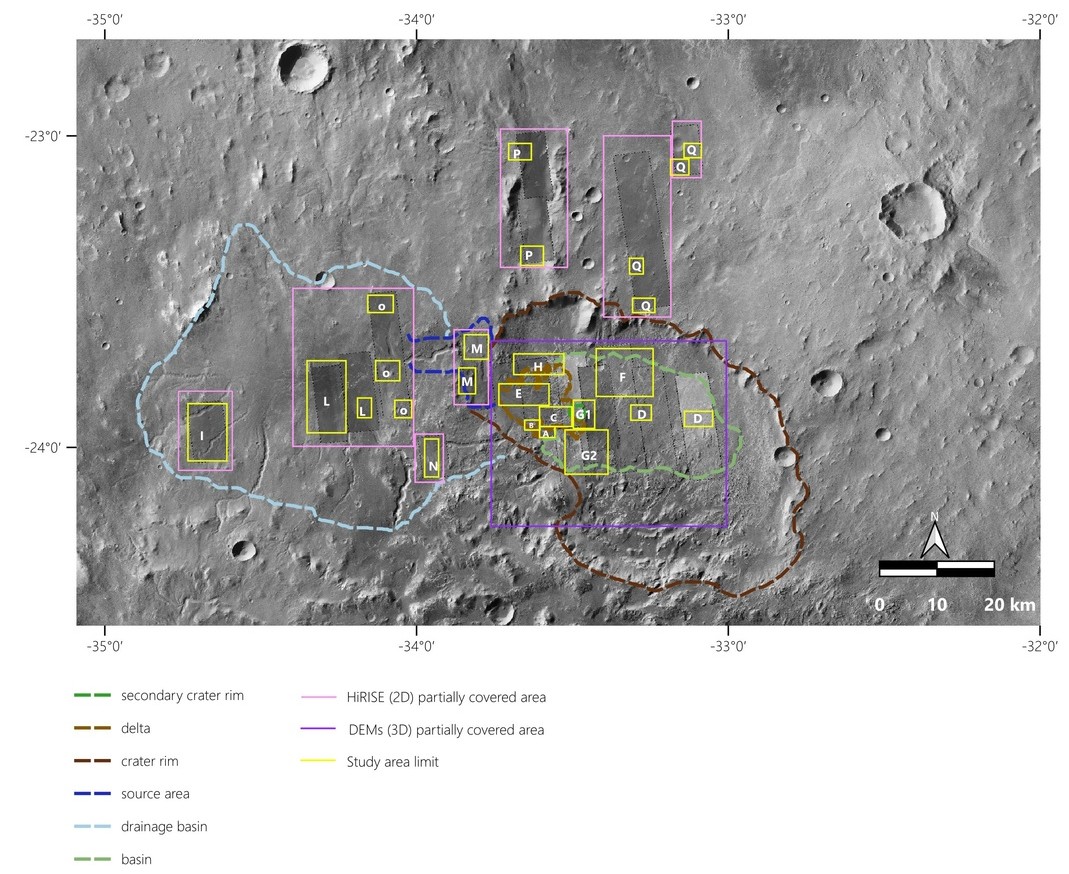
Figure 2. Locations of all 15 study areas on CTX mosaic. Purple: HiRISE stereo DEM images (A–H); pink: HiRISE 2D images (I–Q). Note: the same letters without subscripts correspond to the same area and morphological location (excluding Area G).
Results
1,923 bedforms were mapped across 15 study areas in five morphological depositional settings: delta, basin, drainage basin, source area, and crater plateau. G2 dominates (913, 58%), followed by G1 (618, 40%), G4 (85, 5%), and G3 (36, 2%). Nineteen stratigraphic relationships were identified. The G1→G2 transition is confirmed in 12 of 15 areas (fig. 3), demonstrating a regional atmospheric event. The full G1→G2→G3→G4 sequence is documented in Area F (fig. 3G); G3 also cuts G2 in Area M (fig. 3F); in Area E (fig. 3E), G3 cuts G1 without intervening G2. In Area H (fig. 3H), G4 probably overlies star dunes (ND), implying the multidirectional regime pre-dates the G4 easterly phase.
Inter-area temporal correlation relies on wind direction coherence rather than direct stratigraphic continuity, following standard practice in Martian aeolian stratigraphy (Silvestro et al., 2012). Wind directions reveal a systematic anticlockwise rotation (fig. 4, 5): G1 shows SE–S orientation (mean ~145–163°); G2 is bimodal SW to E (mean ~178°); G3 and G4 are dominated by easterly directions (~90°). The MCD annual mean (161° SSE) matches the G1 regime (fig. 6); the SSE/NW bimodal pattern provides a physical basis for star dune formation, locally amplified by delta lobe and crater rim topography (Edgett and Blumberg, 1994; Courrech du Pont et al., 2024). The G3/G4 easterly direction is absent from all MCD seasons, suggesting local topographic channelling or a circulation shift. Bedform size varies depending on location morphological position: delta areas yield the largest G1 bedforms (~252 m mean crest length), consistent with abundant reworked fluvio-lacustrine sediment; the source area (M) shows anomalously small G2 megaripples (23.2 m), reflecting high sediment flux; and crater plateau areas show reduced sizes consistent with lower sediment availability.
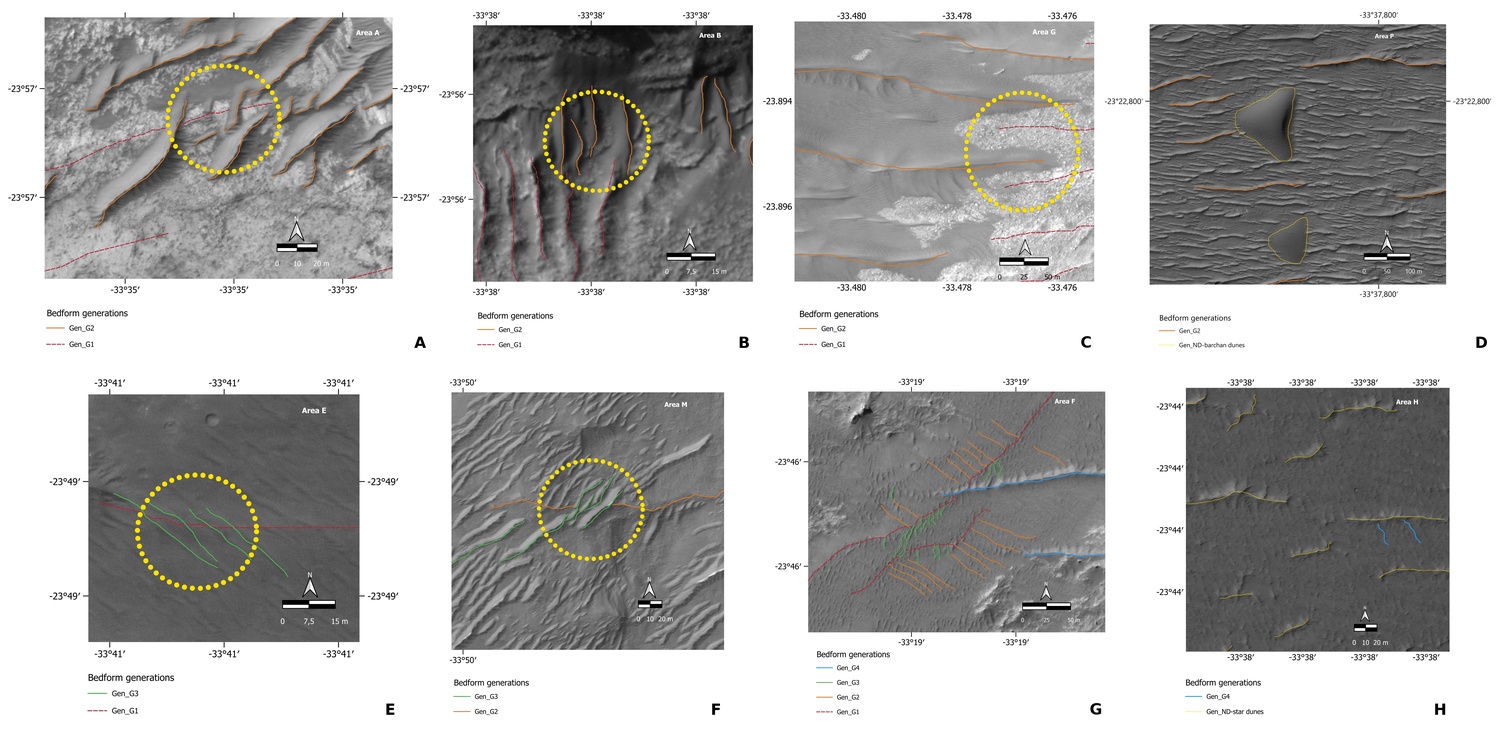
Figure 3. Stratigraphic superposition: A-B-C. G2 cuts G1; D. barchan dunes cut G2; E. G3 cuts G2; F. G3 cuts G1; G. full sequence G1→G2→G3→G4; H. G4 overlies star dunes. Yellow circle: key crosscutting contact..
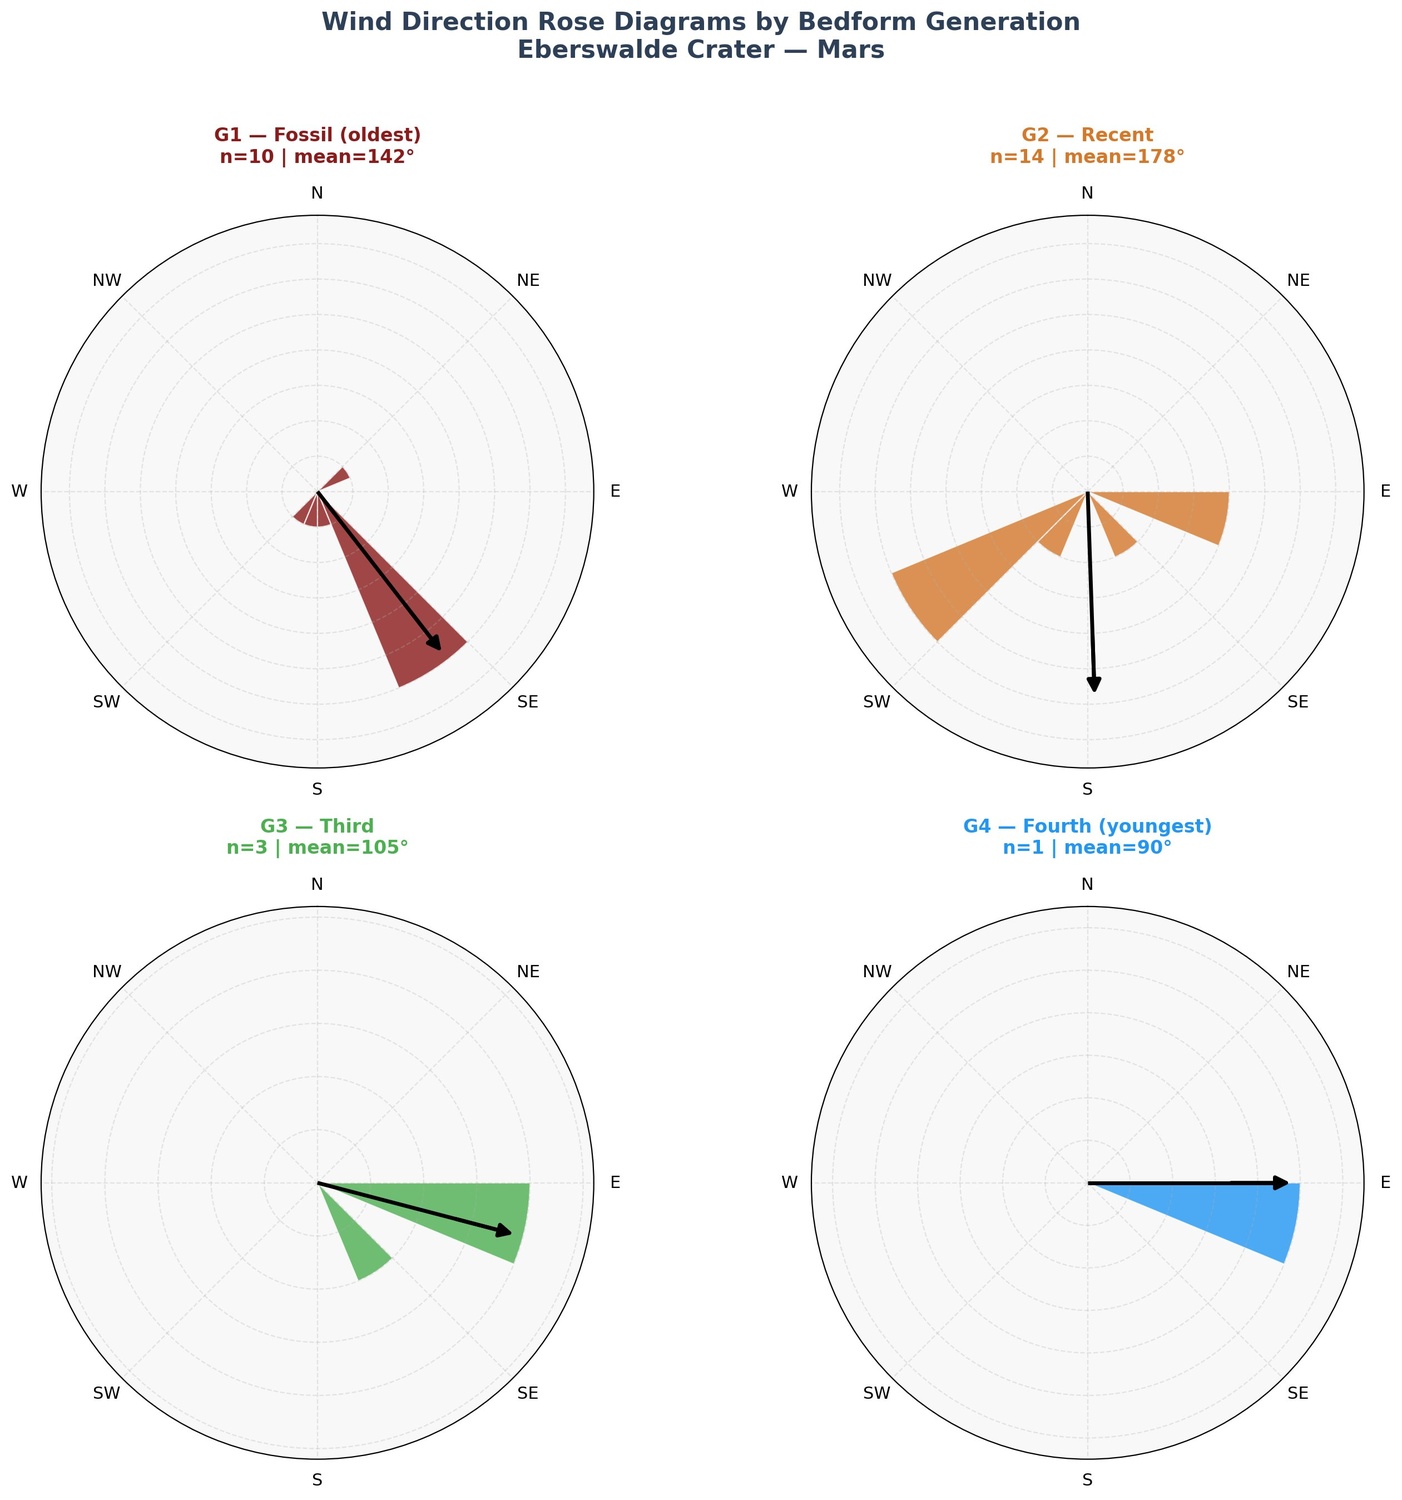
Figure 4. Rose diagrams of transport directions (G1–G4). Anticlockwise rotation from SE/S (G1) through SW/E (G2) to E (G3/G4) is visible.
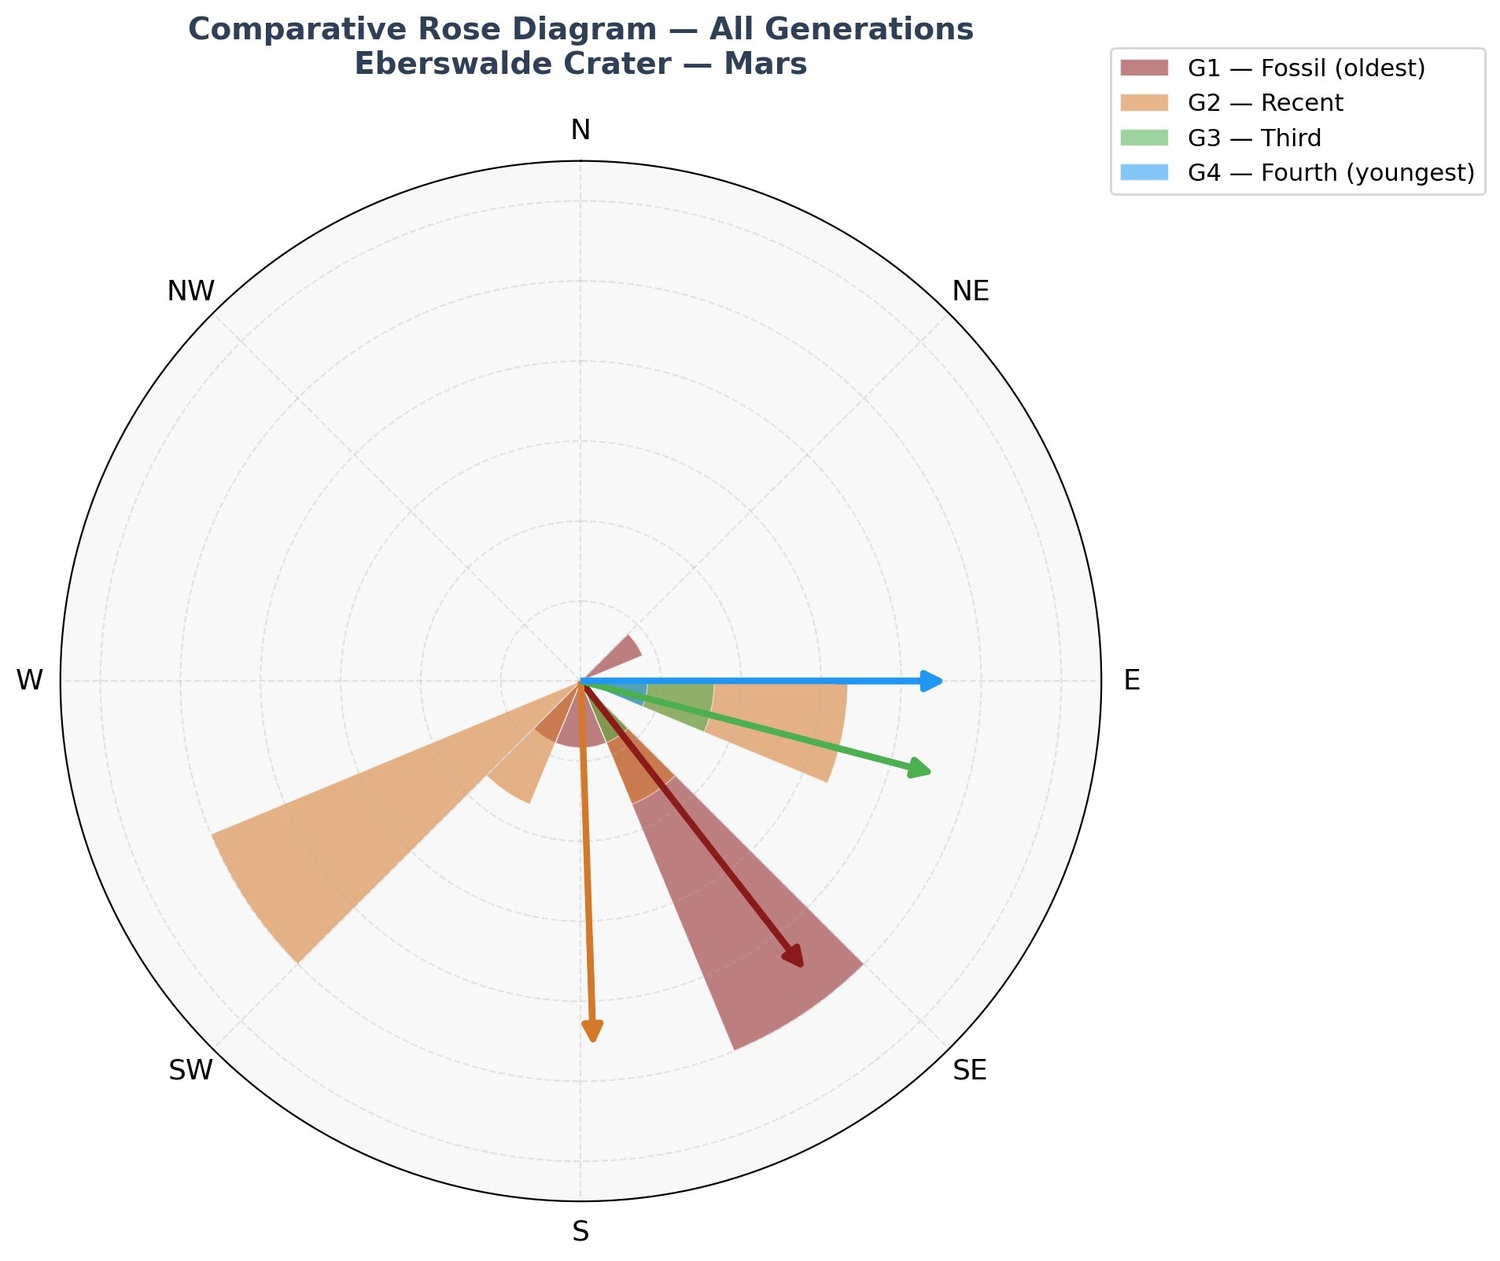
Figure 5. Comparative rose diagram showing the anticlockwise rotation.
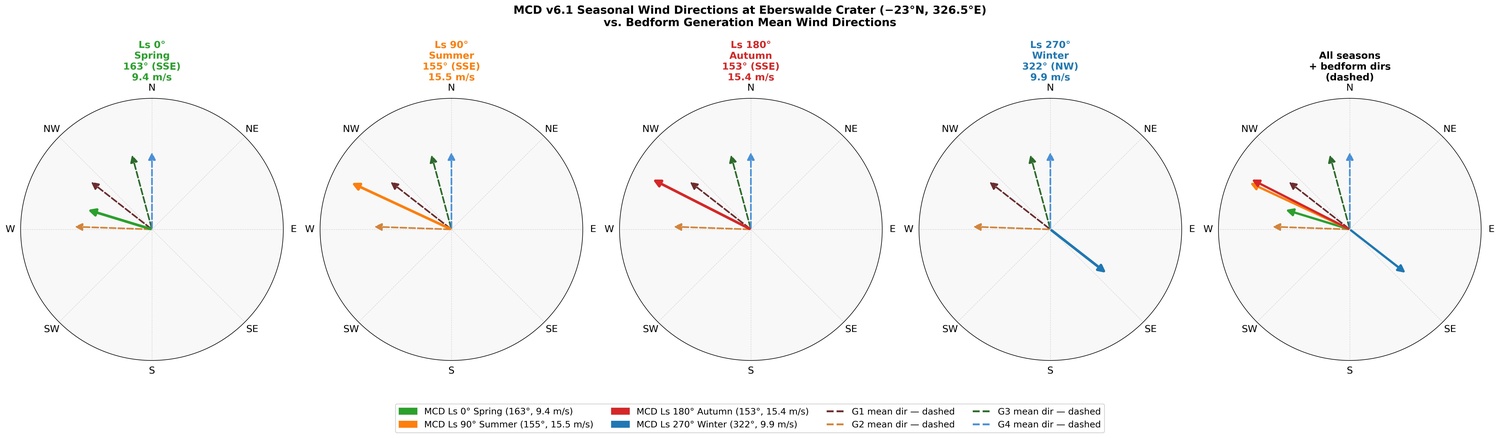
Figure 6. MCD v6.1 seasonal winds (solid) vs. bedform generation means (dashed). G3/G4 easterly direction (~90°) is absent from all seasons.
Discussion and Conclusions
The anticlockwise rotation from SE/S (G1) through SW/E (G2) to E (G3/G4) is consistent with an obliquity-driven weakening of the meridional Hadley circulation and strengthening of the zonal easterly component. We tentatively correlate G1 with the pre-ice-age Late Amazonian (>2.1 Ma), when higher obliquity sustained vigorous meridional winds; G2 with the Martian ice age (~2.1–0.4 Ma), when a transitional wind regime prevailed; and G3/G4 with the post-ice-age interglacial (<0.4 Ma), when declining obliquity weakened the Hadley cell and easterly winds became dominant (Laskar et al., 2004; Head et al., 2003) This interpretation is analogous to aeolian sequences at Utopia Planitia (Liu et al., 2023) and supports obliquity variations as the primary driver of Late Amazonian atmospheric changes. The fossil delta adds topographic complexity and promotes bedform preservation, and Eberswalde preserves a wind record spanning ~2 Ma of Martian atmospheric circulation history.
References
Courrech du Pont et al. (2024), Earth-Sci. Rev. 255.
Edgett & Blumberg (1994), Icarus 112. https://doi.org/10.1006/icar.1994.1197
Fenton & Richardson (2001), JGR 106. https://doi.org/10.1029/2000JE001407
Forget et al. (1999), JGR 104, 24155–24175.
Head et al. (2003), Nature 426. https://doi.org/10.1038/nature02114
Laskar et al. (2004), Icarus 170. https://doi.org/10.1016/j.icarus.2004.04.005
Liu et al. (2023), Nature 620. https://doi.org/10.1038/s41586-023-06206-1.
Malin & Edgett (2003), Science 302. doi:10.1126/science.1090544.
McEwen et al. (2007), JGR 112. doi:10.1029/2005JE002605. E05S02.
Millour et al. (2018), ESAC Workshop.
Pondrelli et al. (2008), Icarus 197, 429-451.
Silvestro et al. (2020), JGR Planets. doi:10.1029/2020JE006446.
Silvestro et al. (2012), E.S.P.L.37, 1424–1436. https://doi.org/10.1002/esp.3286
Acknowledgements
This study was carried out within the Space It Up project funded by the Italian Space Agency, ASI, and the Ministry of University and Research, MUR, under contract n. 2024-5-E.0 - CUP n. I53D24000060005
How to cite: Piscopo, A., Pondrelli, M., Marinangeli, L., and Cavalazzi, B.: Analysis of aeolian bedforms at Eberswalde crater and preserved delta, Mars: a possible record of Late Amazonian wind regimes transition, Europlanet Science Congress 2026, The Hague, The Netherlands, 6–11 Sep 2026, EPSC2026-254, https://doi.org/10.5194/epsc2026-254, 2026.
Mars aeolian studies commonly compare mapped surface features such as dunes, ripples, and wind streaks with atmospheric model outputs in order to infer formative wind regimes. In practice, these comparisons are often based on only the strongest modelled winds, typically the upper 5% of wind speeds, under the assumption that sediment transport and streak formation are dominated by rare high-wind events. However, the extent to which this assumption is universally valid across different Martian environments remains poorly tested. Here, we investigate whether restricting analyses to the top 5% of modelled winds provides the most representative comparison with observed aeolian orientations across three contrasting regions on Mars: Mawrth Vallis, Ares Vallis, and Syrtis Major.
We use mesoscale simulations produced with the Laboratoire de Météorologie Dynamique Mars Mesoscale Model [1], forced using the Open access to Mars Assimilated Remote Soundings (OpenMARS) assimilated atmospheric boundary conditions [2], and compare modelled wind direction distributions against mapped dune slip faces and wind streaks derived from CTX imagery [3]. We quantify correspondence between observed and modelled directional distributions using Earth Mover’s Distance metrics [4]. Our results suggest that the common approach of focusing on the strongest modelled winds is broadly appropriate at two of the study sites, where the upper tail of the wind distribution provides the closest agreement with mapped aeolian orientations. However, results from the third site reveal a substantially more complex relationship between surface feature orientation and atmospheric circulation. The complexity of the local environment appears to exert a stronger control on the observed aeolian record, implying that site-specific atmospheric dynamics must be considered when interpreting surface wind indicators.
These findings suggest that while threshold-based approaches remain useful, applying a universal “fastest winds create the landforms” assumption across Mars may not always be appropriate, oversimplifying the relationship between atmospheric circulation and aeolian landscape evolution.
[1] Spiga, A. and Forget, F. (2009) JGR-Planets, 114(E2) [2] Holmes, J. A. et al. (2020) Planet. Space Sci., 188, 104962 [3] Dickson, J. L. et al. (2024) Earth and space Sci., 11(7) [4] Rubner, Y., Tomasi, C., and Guibas, L. J. (2000) Int. J. Comput. Vis., 40(2), 99–121.
How to cite: Patel, M. R., Favaro, E. A., Rajendran, K., and Holmes, J. A.: Are Mars Aeolian Features Controlled by the Strongest Winds? A Mesoscale Modelling Investigation, Europlanet Science Congress 2026, The Hague, The Netherlands, 6–11 Sep 2026, EPSC2026-1134, https://doi.org/10.5194/epsc2026-1134, 2026.
Introduction
Olympia Undae, in the north circumpolar region of Mars, is one of the largest dune fields on the planet and a key site for investigating the interaction between aeolian transport, sediment availability and local relief. Dune morphology in this region records both the regional circumpolar circulation and local perturbations caused by topographic obstacles [1,2]. In addition to its dune field, Olympia Undae contains non-impact landforms including Simple Domes (SD) and Irregular Structures (IS), which locally modify airflow and sediment redistribution [3–5] (Fig. 1). These edifices provide natural markers to analyse how topography controls dune distribution and inferred near-surface wind regime.
Data and methodology
This study focuses on the 6 Simple Domes and 5 Irregular Structures identified in Olympia Undae [3–5]. The analysis combines MOLA topography, HRSC/MOLA digital terrain models, orbital imagery, and GIS-based morphometric analysis using tools such as JMARS [3–5]. Dune distribution on and around each structure was compared with local altitude and slope in order to evaluate the topographic control on sediment accumulation and mobility.
The methodology is based on a structured analysis of elevation (h) and slope (S) derived from HRSC/MOLA DEM data, organised on a spatial grid (latitude–longitude) (Fig. 2), allowing the extraction of morphometric gradients and their relationship with dune occurrence.
Two diagnostic parameters are defined and applied: the critical altitude and the limiting slope. The critical altitude corresponds to the elevation above which dunes become scarce or absent and is computed from altitude gradients (dh/dx) using percentile thresholds (typically absent and identify significant topographic transitions associated with changes in wind behavior. The limiting slope represents the maximum terrain inclination allowing dune mobility and is derived from slope distributions using a similar percentile-based approach. This value is defined by identifying from which slope values of moving dunes surfaces are usually uncommon under normal conditions [5].
Both parameters are calibrated using dune distribution and morphology, including crest orientation and dune type, and their spatial relationship with HRSC/MOLA-derived elevation and slope data, allowing a direct link between topographic forcing and inferred wind regime.
Results
The results show that dune distribution around the SD and IS of Olympia Undae is markedly asymmetric and strongly controlled by local topography. As expected, dunes preferentially accumulate on low-slope flanks and sheltered sectors, whereas summit areas and more exposed sectors tend to be dune-free or to show reduced sediment cover. This confirms that the edifices locally modify near-surface airflow and sediment transport pathways [5].
IS-01 is one of the catalogued Irregular Structures shown in Fig. 1 [3,4]. With an overall relief of approximately 423 m, it clearly illustrates this pattern (Fig. 3). Above an altitude of –4727.8 m, the presence of dunes decreases sharply, defining a critical threshold. The same structure shows a limiting slope of about 1.021° [5]. However, summit slopes are below 1°, indicating that the lack of dunes cannot be explained by slope alone. Instead, this is interpreted as the effect of wind interaction and turbulence over the summit, which prevents sediment accumulation, whereas the flanks favour belts of linear dunes [5].
Other edifices confirm that the topographic effect is systematic, although expressed differently according to morphology. In IS-04, the calculated values are –4742.2 m for critical altitude and 1.485° for limiting slope [5]. Because of its irregular shape and internal slope variability, part of the structure remains covered by dunes. Its surface includes linear dunes aligned NW–SE, barchans in transition to barchanoids, and curved dune patterns that suggest local variations in wind intensity and direction superimposed on the dominant circumpolar flow [1,2,5] (Fig 4).
The SD also records this coupling between topography and wind. In SD-01, transverse dunes, barchanoids and barchans occur on different sectors of the edifice. The main inferred wind direction is NW–SE, in agreement with the regional circumpolar circulation, while a secondary NE–SW component is indicated by oblique crests in the eastern and southern sectors [1,2,5]. The relief appears to promote sectorial sediment trapping and differential erosion.
Summary and Conclusions
The simple domes and irregular structures of Olympia Undae act as local topographic obstacles capable of reorganising dune distribution and modifying the local expression of the regional wind regime. The combined use of critical altitude and limiting slope provides a useful framework to identify where dunes can form and where sediment transport is inhibited by wind–topography interaction [5].
The observed asymmetries in dune occurrence, the concentration of mobile dunes below critical thresholds, and the contrast between exposed summit areas and sediment-rich flanks indicate that local relief exerts a first-order control on aeolian redistribution at the scale of individual edifices. The results support the interpretation that dune patterns around the SD and IS of Olympia Undae can be used to infer local atmospheric circulation in the Martian polar environment [1,2,5].
References
[1] Ewing, R. C., Peyret, A. P. B., Kocurek, G., and Bourke, M.: Dune field pattern formation and recent transporting winds in the Olympia Undae dune field, north polar region of Mars, J. Geophys. Res. Planets, 115, E08005, 2010.
[2] Rubanenko, L., Gunn, A., Pérez-López, S., Fenton, L. K., Ewing, R. C., Soto, A., and Lapôtre, M. G. A.: Global surface winds and aeolian sediment pathways on Mars from the morphology of barchan dunes, Nat. Astron., 7, 1037–1047, 2023.
[3] Sánchez-Bayton, M., Herraiz, M., Martin, P., Sánchez-Cano, B., Tréguier, E., and Kereszturi, A.: Morphological analyses of small and medium size landforms in Scandia Cavi and Olympia Undae, Northern Circumpolar Region of Mars, Planet. Space Sci., 210, 105389, 2022.
[4] Sánchez-Bayton, M., Herraiz, M., Martin, P., Sánchez-Cano, B., Tréguier, E., and Kereszturi, A.: Morphometric and topographic data of small and medium size landforms in the Northern Circumpolar Region of Mars, Data in Brief, 43, 108417, 2022.
[5] Sánchez-Bayton Sánchez, M.: Zona Circumpolar Norte de Marte: Análisis Físico y Morfológico de Estructuras Pequeñas y Medianas en Scandia y Olympia Undae mediante Datos de Sensores Remotos de ESA Mars Express, Mars Global Surveyor y Mars Reconnaissance Orbiter, PhD thesis, Universidad Complutense de Madrid, Universidad Complutense de Madrid, 2025.
How to cite: Sánchez-Bayton, M., Herraiz, M., Martin, P., Sánchez-Cano, B., and Kereszturi, A.: Topographic forcing of dune distribution and local wind regime around simple domes and irregular structures in Olympia Undae, Mars, Europlanet Science Congress 2026, The Hague, The Netherlands, 6–11 Sep 2026, EPSC2026-218, https://doi.org/10.5194/epsc2026-218, 2026.
Introduction:
The Hadriacus Cavi are an ~50km long chain of up to 700 m deep depressions, located near the northern rim of Hellas Basin in Mars’ southern highlands1. They are set between high relief mountains to the south, and lower, low relief sedimentary plains to the north. The Cavi themselves record successions of alternating pale and dark layers, probably deposited during the early to middle Noachian, that together are 100s of meters thick2, and generally dip ~1° north-northwest3. Previous work by Skinner et. al. (2021) identified a layer within a 20 km2 region in the western extent of the Cavi containing bedforms which they interpreted to be buried fluvial channels2. It is currently unknown how widespread these channels are throughout the Cavi, or whether they occur in layers other than the one identified by Skinner et al., (2021). Investigating these unknowns will inform our understanding of the fluvial history of early Mars and may reveal more information about the possibility of a past ocean in Hellas basin4.
Methods:
We have used CTX (6m/pixel), HiRISE (25-50 cm/pixel) and CaSSIS (colour; ~4m/pixel) orbital images and Digital Elevation Models (DEMs) in a GIS-based approach. Using ortho-rectified images draped over a series of 1m/pixel HiRISE DEMs we have analysed the regional geology in 3D, creating linework to mark unit boundaries, fluvial structures and other features in the GIS. The wider sedimentary succession in the Cavi was documented, covering an area of ~500 km2, extending into areas beyond that where fluvial structures were first identified2. We have identified multiple potential fluvial structures across the Cavi, based on their morphology, texture and setting and have also documented distinct stratal packages and repeating tonal and textural patterns of strata that extend across the region. The dimensions of the potential fluvial structures and the strata that host them were measured, and we documented any internal structures visible in HiRISE images. We have also begun to measure the dip directions of the strata using 3D GIS tools and to make stratigraphical columns of key areas across the Cavi that will allow us to contextualise the different exposures and channel bearing units.
Preliminary results and interpretation:
We have identified that the fluvial channel deposits postulated by Skinner et al. (2021) extend both laterally and vertically across the Cavi and sit within at least three distinct sedimentary packages. Stratigraphically, these new channels occur both above and below the layer identified by Skinner et al. (2021). The layers are separated by tens to hundreds of metres vertically, and crop out in a series of brighter, steeply dipping cliffs (~40° 3) separated by darker, gently sloping terraces. That they crop out so far from each other stratigraphically suggests that, rather than a single continuous period of fluvial activity, the region experienced multiple episodes of fluvial activity and deposition.
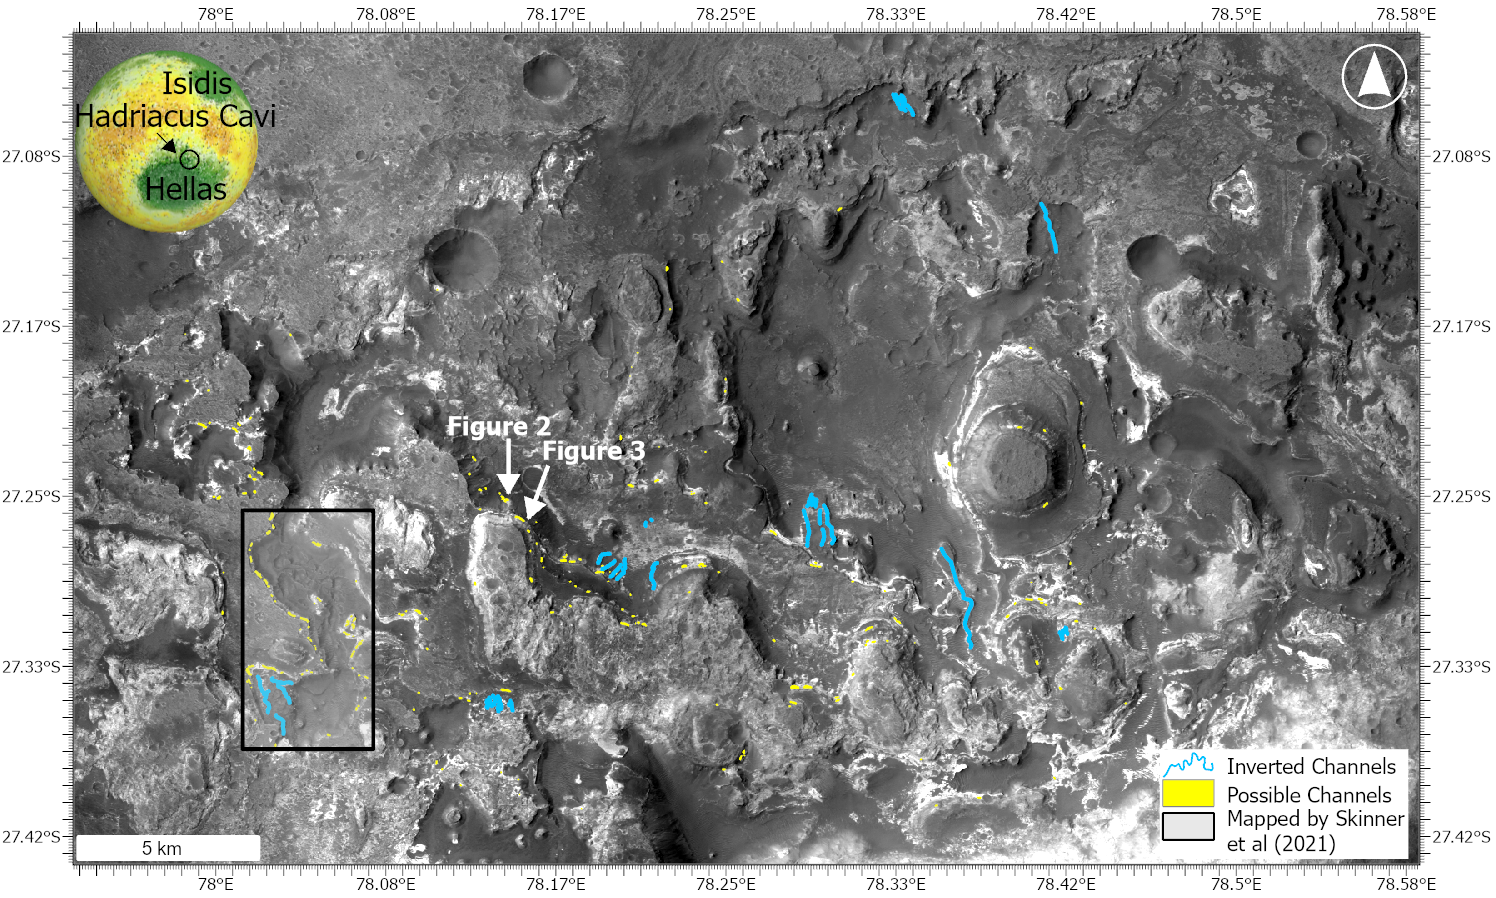
Figure 1: Map of Hadriacus Cavi with inset globe of Mars for context. Yellow polygons indicate possible channel features, blue lines indicate inverted channels. Locations of figures 2 and 3 marked.
Between the fluvial periods, other types of deposition might have dominated, although it is possible that there are other fluvial features which are not currently. We note at least two types of deposit: i) generally flat-topped, curved-bottom features which we interpret as channel deposits2; ii) several examples of a series of dipping layers truncated by flat surfaces that conform to regional bedding at the top and bottom which we interpret as lateral accretion surfaces recording channel migration.
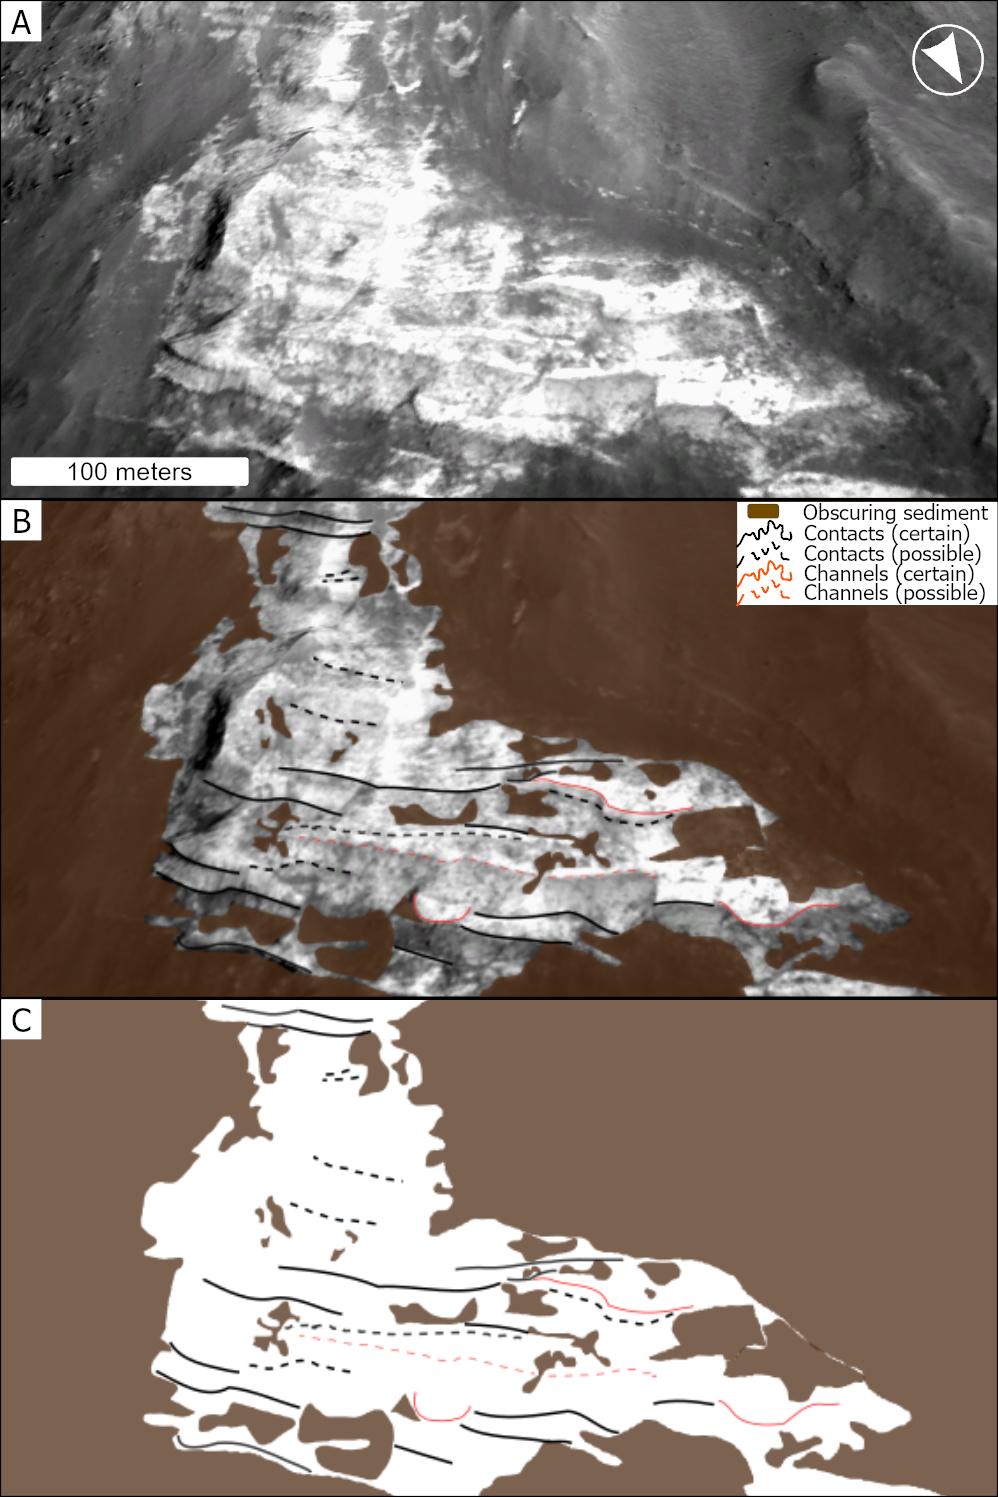
Figure 2: An oblique view of a section of cliff within the Cavi. A) image. B) image and markup denoting fluvial features and sedimentary layers. C) markup only.
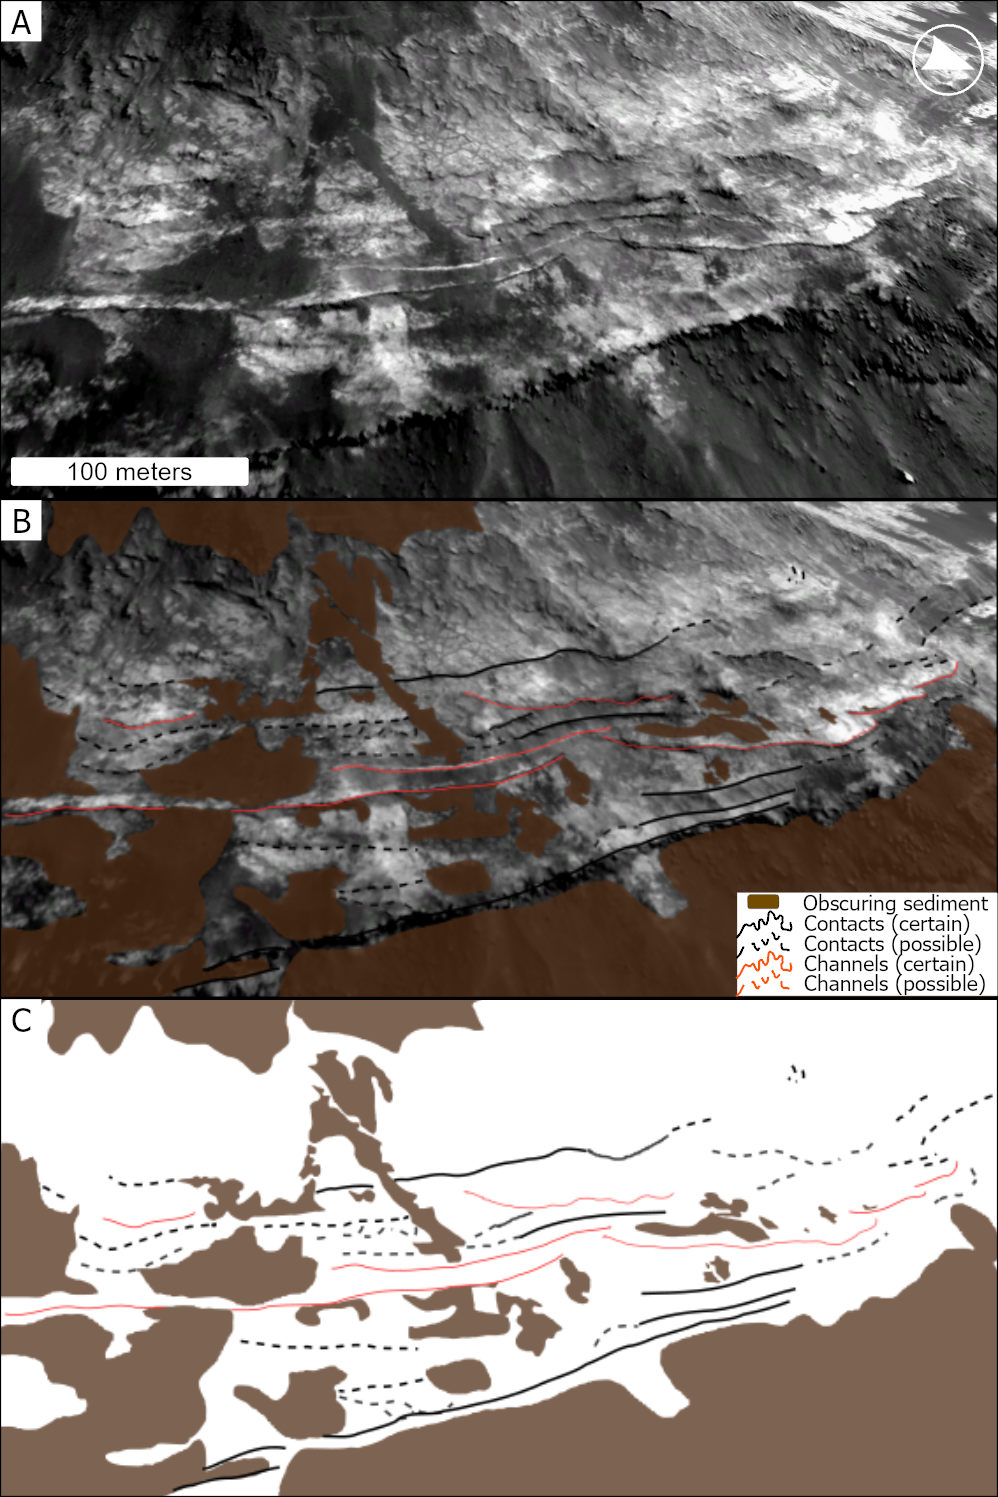
Figure 3: An oblique view of a section of cliff within the Cavi. A) image. B) image and markup denoting locations of fluvial features and sedimentary layers. C) markup only.
The fluvial features are found predominantly in brighter layers and are more common to the west of the study region, though this may be due to higher quality exposures with less overlying cover-material. For the same reason, most channel forms are found in cliffs in the south of the Cavi, those in the north are obscured, shadowed and generally of lower relief than the cliffs to the south. To the east, the bottom of the Cavi pits reveal layers from higher parts of the stratigraphy than seen in the pits to the west, so some of the channel bearing layers (if present) are below ground in the east. We also note the presence of inverted channels in the landscape which occur at the same stratigraphical level as some channels seen in cross section. These can be found across the Cavi and tend to crop out at the same stratigraphical level as the ‘fluvial layer’ first identified by Skinner et al. (2021), supporting the idea that the channel forms are deposits from ancient river systems.
Preliminary conclusions:
We have studied a region more than 500 km2 searching for fluvial channel forms. The channels we have identified are much more laterally extensive and crop out in more strata than those identified previously, being found across the entire 50 km long southern extent of the Cavi. This indicates that the fluvial system or systems which formed these features was more laterally extensive than previously described. One or more larger meandering fluvial systems would explain the diversity in channel form and the range in orientations of various channel forms that we see in the Cavi. Our observations point to either multiple periods of fluvial activity in this region or a long period of fluvial activity. These deposits indicate sustained deposition prior to the more recent processes that have since led to excavation of the Cavi.
References: [1] Smith, D. E. et al. (1999) Science, 284, 1495–1503. [2] Skinner, J.A. et al. (2021) Icarus. 354, 114071. [3] Skinner, J.A. et al., (2017) 48th LPSC, p.2694 [4] Wilson, S.A. et al. (2007) JGR, 112, E8
How to cite: Losekoot, A., Balme, M. R., Fawdon, P., and Coe, A. L.: The Fluvial History of Hadriacus Cavi, Mars, Europlanet Science Congress 2026, The Hague, The Netherlands, 6–11 Sep 2026, EPSC2026-478, https://doi.org/10.5194/epsc2026-478, 2026.
The Perseverance rover landed on Mars in 2021 in Jezero crater, which contains evidence of an ancient lake. Deltaic deposits are preserved at the inlet of this paleolake, and connected to an ancient fluvial network via a valley dissecting the crater rim, named “Neretva Vallis” (Figure 1a). Between sols (i.e., Martian days) 1169 and 1244 of the mission (June to August 2024), the rover explored light-toned deposits in Neretva Vallis, informally named the “Bright Angel formation” (Figure 1b). This formation attracted significant interest after the discovery of rocks interpreted as fluvio-lacustrine mudstones containing organic compounds, as well as reduction spots (mm-scale nodules and redox fronts enriched in Fe-phosphates and Fe-sulfides) interpreted as potential biosignatures (Hurowitz et al., 2025).
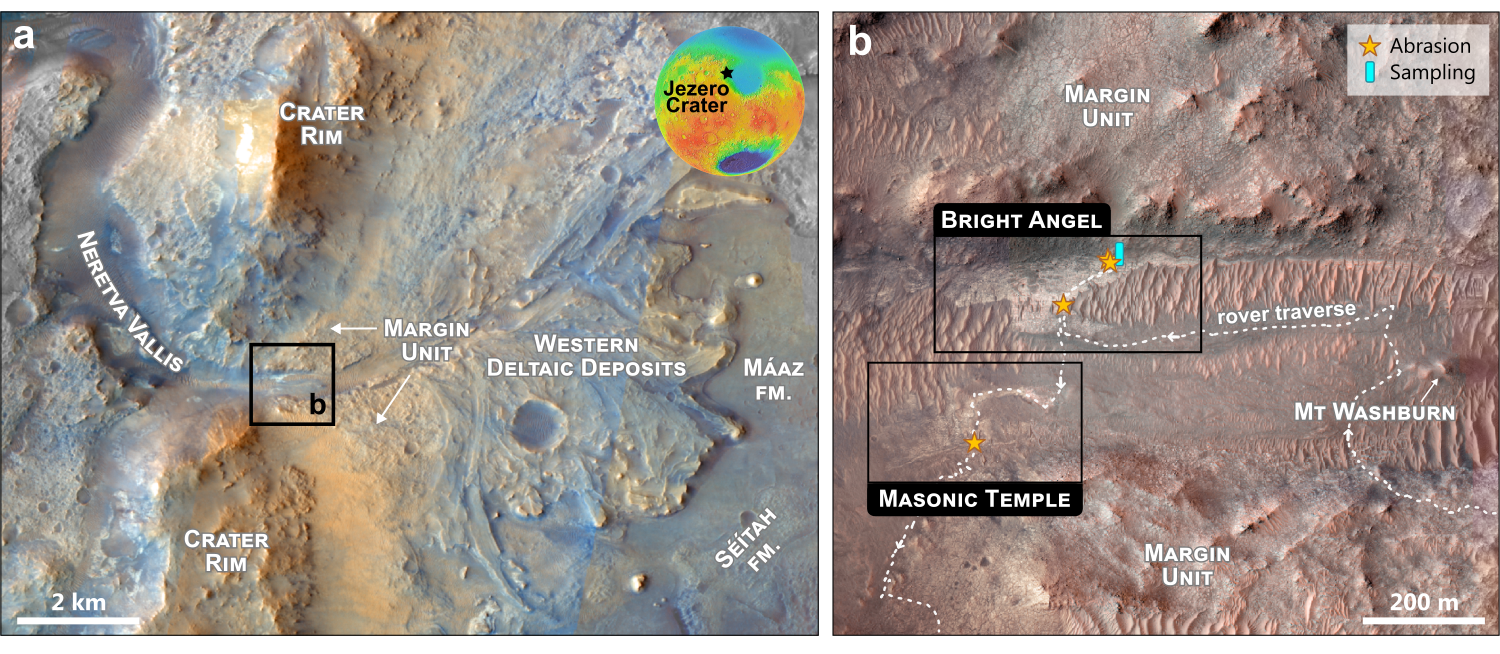
Figure 1. Context for the Bright Angel formation exposed at the Bright Angel and Masonic Temple localities. (a) Colour and Stereo Surface Imaging System (CaSSIS; Thomas et al., 2017), Context Camera (CTX; Malin et al., 2007) and (b) High Resolution Imaging Science Experiment (HiRISE; McEwen et al., 2007) enhanced-color composite basemaps over Western Jezero crater.
Here, we characterize the elemental and mineralogical composition of the Bright Angel formation using complementary datasets from Perseverance instruments to further constrain past water-rock interactions and diagenetic evolution. Our analysis integrates: elemental composition from SuperCam Laser-Induced Breakdown Spectroscopy (LIBS; Wiens et al., 2020; Maurice et al., 2021) and from the Planetary Instrument for X-Ray Lithochemistry (PIXL; Allwood et al., 2020), as well as mineralogy from SuperCam Visible and near-infrared reflectance, SuperCam Raman spectroscopy (Wiens et al., 2020; Maurice et al., 2021), and deep ultraviolet Raman spectroscopy using the Scanning Habitable Environments with Raman and Luminescence for Organics and Chemicals (SHERLOC; Bhartia et al., 2021) instrument.
We confirm that most of the stratigraphy of the exposed bedrock consists of mudstones with a composition distinct from previously investigated formations at Jezero crater, which exhibited mafic to ultramafic compositions. In contrast to other units, the Bright Angel formation is enriched in Al-silicates and Ca-sulfates, broadly lacks olivine and its alteration products, and exhibits high Al and very low Mg contents. Preliminary interpretation of the associated mineral assemblages suggest diverse and prolonged fluid activity, consistent with enhanced diagenesis and hydrothermal processes:
- Elevated Chemical Index of Alteration values (up to ~80) indicate open-system weathering, either acquired in situ or inherited from pre-deposition processes
- The co-occurrence of illite (and/or a mixed-layer illite/aluminous smectite phase) and fluorite suggests hydrothermal processes at moderately elevated temperatures (>~85°C), assuming that these minerals are not detrital. This warm-temperature scenario could favor an abiotic origin for sulfate reduction in the reduction spots; however, these temperatures may have occurred independently of sulfur reduction, leaving the biogenic hypothesis still possible
- Jarosite and akaganeite in the upper stratigraphy attest to episodic circulation of oxidizing and saline fluids
Overall, the degree of alteration and diagenesis recorded by the Bright Angel formation may be inconsistent with a late post-delta origin, leaving open the possibility that it represents one of the oldest sedimentary units explored by Perseverance, preserving key constraints on Noachian aqueous environments.
References
- Allwood, A.C. et al., 2020. PIXL: Planetary Instrument for X-Ray Lithochemistry. Space Science Reviews 216, 134. https://doi.org/10.1007/s11214-020-00767-7
- Bhartia, R. et al., 2021. Perseverance’s Scanning Habitable Environments with Raman and Luminescence for Organics and Chemicals (SHERLOC) Investigation. Space Science Review 217, 58. https://doi.org/10.1007/s11214-021-00812-z
- Hurowitz, J.A. et al., 2025. Redox-driven mineral and organic associations in Jezero Crater, Mars. Nature 645, 332–340. https://doi.org/10.1038/s41586-025-09413-0
- Malin, M.C. et al., 2007. Context Camera Investigation on board the Mars Reconnaissance Orbiter. Journal of Geophysical Research: Planets https://doi.org/10.1029/2006JE002808
- Maurice, S. et al., 2021. The SuperCam Instrument Suite on the Mars 2020 Rover: Science Objectives and Mast-Unit Description. Space Science Reviews 217, 47. https://doi.org/10.1007/s11214-021-00807-w
- McEwen, A.S. et al., 2007. Mars Reconnaissance Orbiter’s High Resolution Imaging Science Experiment (HiRISE). Journal of Geophysical Research: Planets https://doi.org/10.1029/2005JE002605
- Thomas, N. et al., 2017. The Colour and Stereo Surface Imaging System (CaSSIS) for the ExoMars Trace Gas Orbiter. Space Science Reviews 212, 1897–1944. https://doi.org/10.1007/s11214-017-0421-1
- Wiens, R.C. et al., 2020. The SuperCam Instrument Suite on the NASA Mars 2020 Rover: Body Unit and Combined System Tests. Space Science Reviews 217, 4. https://doi.org/10.1007/s11214-020-00777-5
How to cite: Mandon, L., Mangold, N., Forni, O., Dehouck, E., Beck, P., Beyssac, O., Schröder, S., Phua, Y. Y., Hurowitz, J., Jones, A., Moreland, E., Clavé, E., Johnson, J., Fouchet, T., Manelski, H., Simon, J., Siljeström, S., Broz, A., Cousin, A., and Wiens, R.: Complex diagenetic history of organic-bearing sedimentary rocks in Neretva Vallis, Mars, Europlanet Science Congress 2026, The Hague, The Netherlands, 6–11 Sep 2026, EPSC2026-356, https://doi.org/10.5194/epsc2026-356, 2026.
Introduction: The Martian surface hosts an extensive geologic record indicative of widespread surface water during the 'valley network-forming era' (~3.7–3.5 Ga [1]). However, the climatic conditions required to incise the eponymous valley networks (VNs) remain poorly constrained. Proposed end-member solutions range from a long-lived 'warm and wet' climate with regular rainfall [2,3] to a 'cold and dry' climate with episodic snowmelt events [4,5]. The primary reason for this uncertainty is the wide range of unconstrained model parameters, exacerbated by a lack of quantitative ground-truth observations for model validation. In an attempt to compare VN erosion and climate conditions, previous studies have performed simple comparisons between model precipitation maps and the location of VNs [6,7]. However, these approaches have thus far led to poor spatial correlations.
On Earth, the relationship between erosion and precipitation is well documented [8,9], albeit complex. However, quantitative precipitation-discharge-erosion models have seen limited application in deciphering the climate history of Mars. Here, we bridge the gap between climate simulations and geomorphic observations by integrating a mechanistic understanding of precipitation, runoff, and erosion.
Methods: We use the hydrological toolbox WhiteboxTools [10] to run flow accumulation analysis: a simulation of the flow at each elevation grid cell to its steepest downslope neighbor. We use the digital elevation model (DEM) from the Mars Orbiter Laser Altimeter (MOLA; ~463 m/pixel [11]) to simulate flow directions. In the resultant flow accumulation map, each pixel represents the number of cells (or area) upstream of that point. Standard flow accumulation methods assume that precipitation is spatially constant. We refine this by using global precipitation maps from existing Mars climate model outputs [6,7,12,13] as weights (Fig. 1a-d). In the resulting 'precipitation-weighted' flow accumulation map (Fig. 1e), each pixel represents the cumulative precipitation rates of the upstream pixels, i.e., the discharge, Q, at each point, assuming no losses in conversion between precipitation and discharge.
The relationship between erosion and precipitation on Earth is generally quantified through the stream power law [14], which states that the erosion rate is nonlinearly proportional to channel slope, S, and precipitation-sourced discharge Q, given a constant rock erodibility. Applying this to the Martian context, we compare our modeled global discharge maps to observed erosion, assuming steady erosion rates. We first measure channel slope, S, as the mean channel gradient between the second point upstream and second point downstream of each pixel, based on the MOLA DEM. Using a global map of eroded depths of VNs [15], we generate a planetwide, pixel-wise comparison of model discharge and channel slope, Q × S, to measured VN depth, d, along mapped stream lines (e.g., Fig. 2). Using this framework, we test the question: which climate models yield a good fit to the geomorphic record, as evidenced by positive correlations between observed eroded depths and a model's flow map (i.e., large valley depths, d, occur in areas of high model discharge, Q)? Through this intercomparison, we determine which climate scenarios within the explored parameter space (n = 91) yield the best fit.
Results and Discussion: We find that the best-performing climate scenario [13] uses a pre-Tharsis paleotopography [16] and a global water inventory of 500 m global equivalent layer (GEL), achieving a Spearman’s rank correlation of ρ = 0.325 (Fig. 2). In climate model outputs, the Tharsis plateau typically causes westerly surface winds to be orographically lifted, leading to a 'rain shadow' east of Tharsis. Previous studies have speculated that poor agreement between precipitation from climate models and the surface record could be a result of Tharsis' rain shadow [6,13]. The growth of Tharsis likely induced a reorientation of Mars with respect to its spin axis, known as TPW. However, the timing of Tharsis' emplacement [17] and associated TPW (e.g., [18,19]) remains under debate. We find that 9 of the top 10 best-performing climate scenarios use a putative pre-Tharsis paleotopography. Our results thus suggest that the erosional record is most compatible with global VN incision prior to, or contemporaneous with, Tharsis' emplacement and associated TPW.
References: [1] Fassett, C. I. et al. (2008) Icarus 195, 61–89. [2] Craddock, R. A. et al. (2002) JGR: Planets 107, 21-1-21–36. [3] Pollack, J. B., et al. (1987) Icarus 71, 203–224. [4] Wordsworth, R. et al. (2013) Icarus 222, 1–19. [5] Squyres, S. W. et al. (1994) Science 265, 744–749. [6] Wordsworth, R. D., et al. (2015) JGR: Planets 120, 1201–1219. [7] Steakley, K., et al. (2019) Icarus 330, 169–188. [8] Ferrier, K. L., et al. (2013) Nature 496, 206–209. [9] Marder, E. et al. (2023) Geology 51, 424–427. [10] Lindsay, J. B. (2016) Comp. & Geosci. 95, 75–84. [11] Smith, D. E. et al. (2001) JGR: Planets 106, 23689–23722. [12] Kamada, A. et al. (2020) Icarus 338, 113567. [13] Guzewich, S. D. et al. JGR: Planets 126, e2021JE006825. [14] Leonard, J. S. et al. (2021) JGR: Earth Surface 126, e2021JF006183. [15] Goudge, T. A., et al. (2021) Nature 597, 645–649. [16] Bouley, S. et al. (2016) Nature 531, 344–347. [17] Anderson, R. C. et al. (2001) JGR: Planets 106, 20563–20585. [18] Roberts, J. H. et al. (2007) Icarus 190, 24–31. [19] Matsuyama, I. et al. (2010) JGR: Planets 115, 2156-2202.
Fig. 1(a)-(d) Global precipitation maps showing representative examples from [6,7,12,13]. (e) Modeled discharge map for a single Martian basin given the climate scenario in (d), overlaid on MOLA DEM. Blue outline shows a closed-basin lake which the VNs drain into.
Fig. 2: Global comparison of observed valley erosion depth, d, against modeled discharge, Q, and channel slope, S, for the best-performing climate scenario [13]. Dashed line indicates line of best fit.
How to cite: Koh, Z.-W., Mitchell, W. H., Goudge, T. A., and Stucky de Quay, G.: Deciphering Early Mars Climate Conditions from Valley Network Erosion, Europlanet Science Congress 2026, The Hague, The Netherlands, 6–11 Sep 2026, EPSC2026-608, https://doi.org/10.5194/epsc2026-608, 2026.
Introduction: Extensive valley networks on Mars record some of the strongest evidence for ancient, sustained water flow on the surface [1]. Encoded in the morphology of these valley networks are quantitative constraints on paleohydrology and, by extension, habitable atmospheric conditions on early Mars [2]. These constraints include key metrics such as the volume of water required to carve them [3-5] and the aridity of the climate in which they formed [6,7]. Estimates of these values made in previous studies [3-5] rely on current valley morphology. However, valley morphologies are likely to have been altered since their formation (>3.5 Ga). In particular, impacts are destructive geomorphic events that can reshape landscapes [8]. Given the ubiquity and destructive nature of impacts, we hypothesize that: (i) the global record of valley networks is incomplete to a non-negligible extent, (ii) larger fluvial features (e.g., flood canyons) are preferentially preserved over smaller features (e.g., higher-order tributaries), and (iii) drainage densities on Mars may be reduced relative to their initial values.
These hypotheses are motivated by several observations. First, impacts can remove portions of valley networks and have the potential to erase extensive global features such as the ancient Martian shoreline [8]. Second, flood canyons represent 24% of the eroded volume on Mars, but only 3% of the valley length [9]. The disparity between spatial extent and total eroded volume suggests that large features could be more resistant to destruction than their shallower counterparts. Third, drainage densities of Martian valley networks resemble those formed in terrestrial arid climates [6]. Impact events may have reduced drainage density, influencing how we interpret the Martian paleoclimate.
We test these hypotheses by modeling the effects of impact events on valleys, reconstructing the pre-impact distribution of valley depths on Mars, and assessing alterations to eroded volume and drainage density. In addition to shedding light on how craters act as geomorphic agents, our results provide an improved understanding of the relative importance of catastrophic fluvial events, and how valley geometries reflect paleo-climate metrics.
Methods: To quantify the preservation of valley networks on Mars, we create a cratering model to simulate 3.5 billion years of impacts at Mars-like impact rates [10]. We begin with un-cratered (pre-impact) terrain that represents the Martian surface at the end of the valley forming era. We use terrain from an analog site on the Kohala Peninsula, in Hawaiʻi, which contains a wide variety of valley depths, ranging from meters up to a kilometer in depth.
For study site, we calculate the size distribution of impact craters expected on Mars since 3.5 Ga and randomly place them on the terrain. Impactors that form small craters compared to the valley they strike do less damage than a comparatively larger impact. For this reason, our model compares the relative size of the impact crater to the valley to determine whether the valley survives impacting.
We quantify how valley depths are modified in the cratering simulation and apply these results to the measured Martian valley depth frequency distribution to reconstruct the pre-impact frequency distribution. This distribution can then be used to reconstruct the total eroded volume at the end of the valley forming era.
Results: Our model placed ~2.5106 craters ranging from ~10 m to ~3,000 m on sample topography representing Mars. By comparing the topography of emplaced impact craters and valley depths, the model removed portions of the valley networks (Figure 1). In total, ~90% of valley pixels were classified as “destroyed” by the model. In particular, shallower portions of valleys were preferentially removed, supporting Hypothesis ii. For example, the presence of valleys in the western portion of the depth map in Figure 1d is reduced compared to the original depth map in Figure 1b, while the large canyons in the east are almost entirely preserved.
After reconstructing the pre-impact frequency distribution of valley depths, we calculate the global eroded volume of the valley networks to be ~19.5% greater than today’s measured eroded volume. While this is an increase in volume, compared to the overall scale of valley formation, it does not substantially alter our understanding of the extent of the valleys, contrary to Hypothesis i.
Finally, we found an overall decrease in drainage density. Tributaries are the primary drivers of drainage density but they are often shallower than the main trunk. If shallower features are indeed more vulnerable to destruction from impacts, it makes physical sense that drainage density would be reduced. This result supports Hypothesis iii.
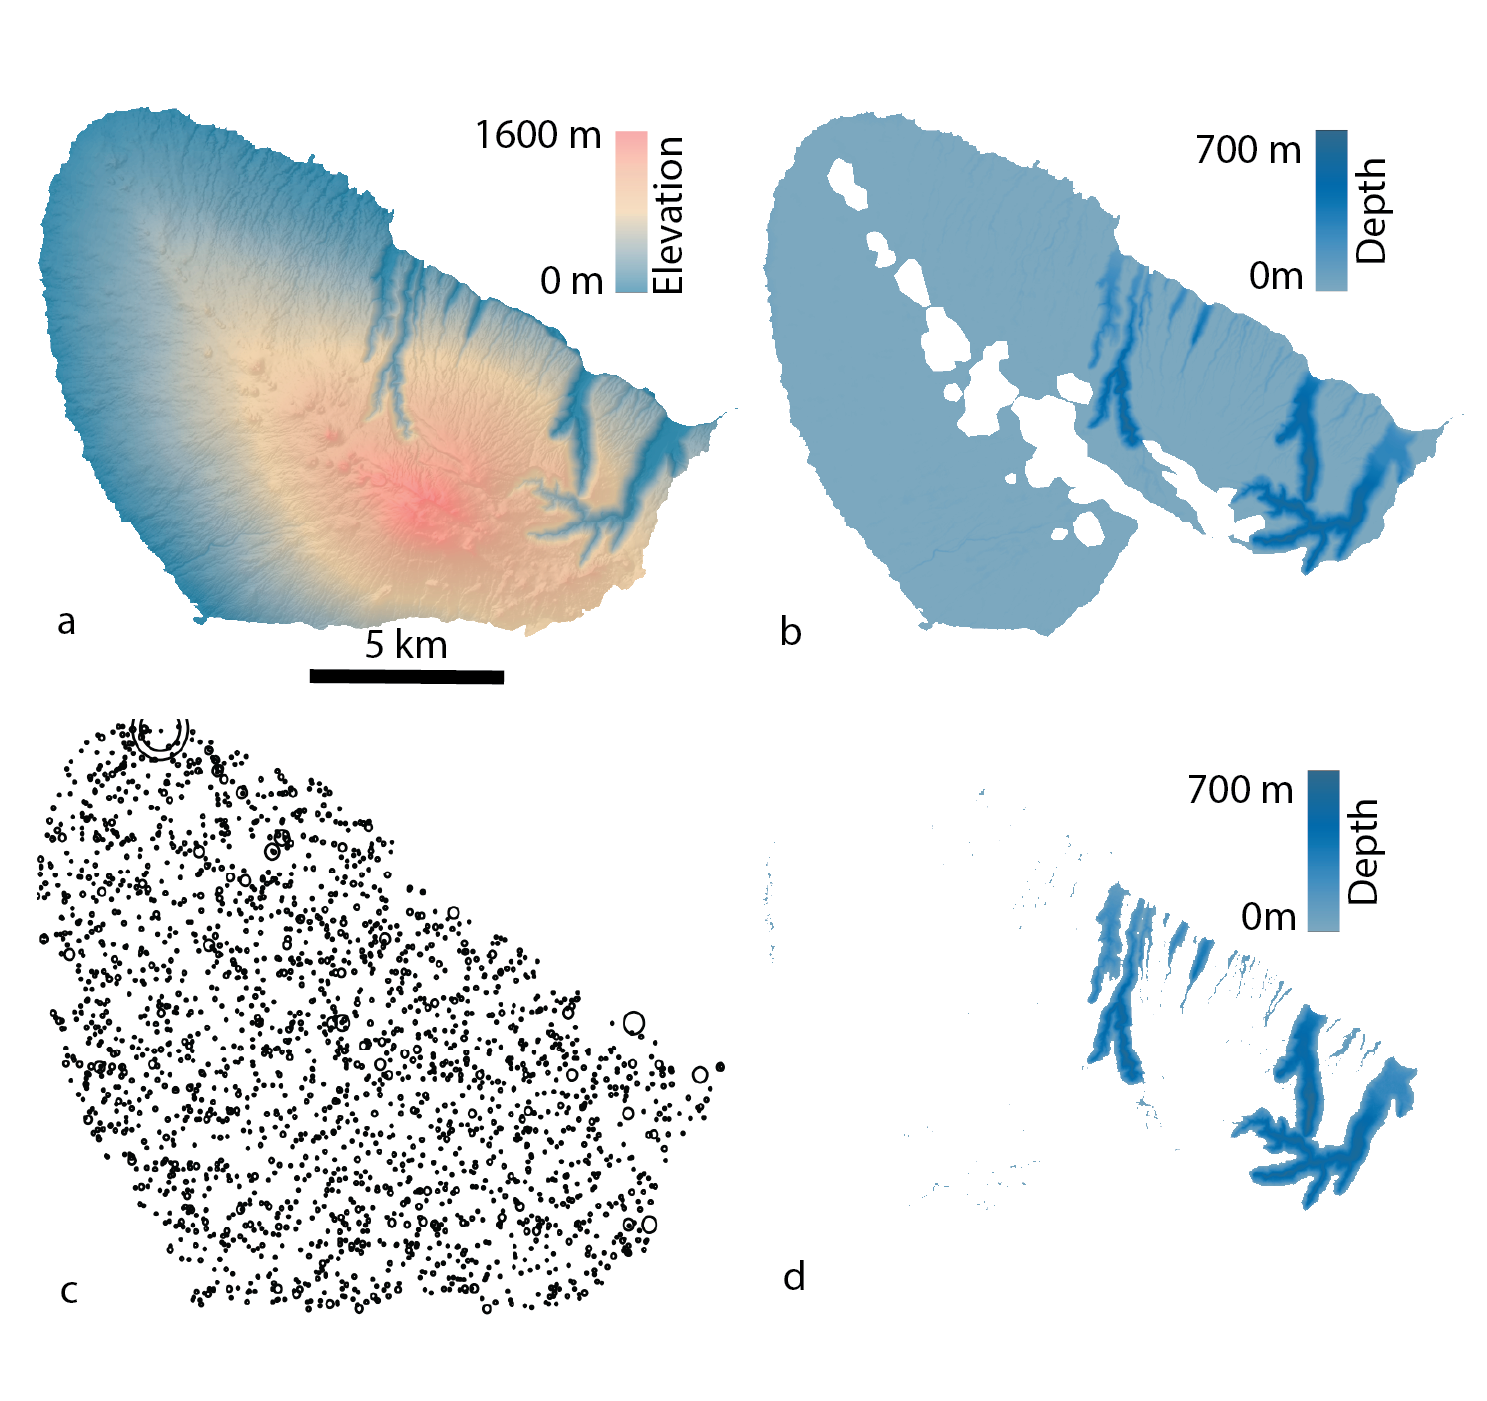
Figure 1: Terrain before and after cratering simulation. (a) Kohala topography hillshade (DEM obtained from USGS); (b) Kohala pre-impact depth map; (c) impact craters (> 0.1 km); (d) Kohala post-impact depth map.
Conclusion: Impact cratering modifies the preservation of Martian valley networks. This result modeled and used to reconstruct their pre-impact eroded volume. Our results show that preservation is depth dependent, with valleys deeper than ~200 m surviving billions of years of impacts, while shallower valleys are preferentially filled in or destroyed.
References:
[1] Hoke, M. R. T. et al. (2011), Earth and Planetary Science Letters, doi:10.1016/j.epsl.2011.09.053.
[2] Kite, E. S., and Conway, S. (2024), Nature Geoscience, doi:10.1038/s41561-023-01349-2.
[3] Rosenberg, E. N. et al. (2019), Icarus, doi:10.1016/j.icarus.2018.07.017.
[4] Rosenberg, E. N., and Head, J. W. (2015), Planetary and Space Science, doi:10.1016/j.pss.2015.08.015.
[5] Luo, W. et al. (2017), Nature Communications, doi:10.1038/ncomms15766.
[6] Carr, M. H., and Chuang, F. C. (1997), Journal of Geophysical Research: Planets, doi:10.1029/97JE00113.
[7] Seybold, H. J. et al. (2018), Science Advances, doi:10.1126/sciadv.aar6692.
[8] Baum, M. et al. (2022), Icarus, doi:10.1016/j.icarus.2022.115178.
[9] Goudge, T. A. et al. (2021), Nature, doi:10.1038/s41586-021-03860-1.
[10] Michael, G. G. (2013), Icarus, doi:10.1016/j.icarus.2013.07.004.
How to cite: Fanson, G., Morgan, A., and Stucky de Quay, G.: Quantifying the Effects of Impact Cratering on the Preservation of Martian Valley Networks, Europlanet Science Congress 2026, The Hague, The Netherlands, 6–11 Sep 2026, EPSC2026-750, https://doi.org/10.5194/epsc2026-750, 2026.
Please decide on your access
Please use the buttons below to download the supplementary material or to visit the external website where the presentation is linked. Regarding the external link, please note that Copernicus Meetings cannot accept any liability for the content and the website you will visit.
Forward to presentation link
You are going to open an external link to the presentation as indicated by the authors. Copernicus Meetings cannot accept any liability for the content and the website you will visit.
We are sorry, but presentations are only available for users who registered for the conference. Thank you.


Studying Noachian times on Mars from both climate and geological evolution is crucial to characterize the habitable conditions of early terrestrial planets. To understand global planet dynamics in its earliest times, assessment of the ancient topography of Mars is required. However, current paleo-topography models are mostly based on idealized assumptions, large-scale isostatic corrections, or limited regional reconstructions, and do not rely on geological analyses to integrate stratigraphic information from buried Noachian terrains. Therefore, the impact of paleo-topography on the early climate and the formation of valley network remains poorly constrained.
For the first time, we present a global reconstruction of the Noachian paleo-surface using constraints from geological mapping (Tanaka et al., 2014), and craters central peaks mineralogy and morphology. First, we removed all the post-Noachian terrains from the Mars Obriter Laser Altimeter topography, including the lowlands from the north hemisphere, the Tharsis province, and post-Noachian impact craters with their inner sedimentary deposits. We also excluded Noachian surfaces extensively reworked by younger tectonic or volcanic events, like Valles Marineris, and the outflow channels.
We used the mineral detections in the central peaks of impact craters and the central peak morphologies to describe the buried terrains and find the boundary between lowest Noachian terrains and shallower post-Noachian deposits. We interpret phyllosilicates detections and massive morphologies as part of the Noachian excavated material, and mafic detections without hydrated minerals associated to layering as post-Noachian samples. By inferring the stratigraphic uplift for each Noachian impact, we provided constraints on the upper and lower bounds of the Noachian surface. The points are interpolated using spherical harmonics to produce smooth global envelopes, and the Noachian paleo-surface is defined by the spatial mean located between the lower and upper envelopes. We accounted for True Polar Wander caused by the formation of the Tharsis bulge, and included isostatic corrections.
Unlike previous products, the reconstructed Noachian paleo-surface links the surface with stratigraphic and mineralogical constraints. This provides a physically grounded estimate of Noachian topography rather than pure corrections of the current topography. Future work will bring new improvements by including the effect of the lithospheric flexure due to the surface loading. The final dataset is designed to be used as an input for modelling climate, hydrology, bathymetry, and landscape evolution through time. We expect our Noachian paleo-surface to allow even more realistic models of early Mars, and a robust reassessment of the environmental conditions during the formation of valley networks.
Tanaka, K. L. et al. (2014). The digital global geologic map of Mars: Chronostratigraphic ages, topographic and crater morphologic characteristics, and updated resurfacing history. Planetary and Space Science, 95, 11-24.
How to cite: Millot, C., Quantin-Nataf, C., Salles, T., and Arnould, M.: Reconstructing the Noachian paleo-surface of Mars, Europlanet Science Congress 2026, The Hague, The Netherlands, 6–11 Sep 2026, EPSC2026-990, https://doi.org/10.5194/epsc2026-990, 2026.
Abstract
Understanding the hydrological evolution of early Mars is essential for interpreting geomorphological evidence of past liquid water, including valley networks, paleolakes, sedimentary deposits and possible northern oceans (for a review see Carr and Head, 2010). While Global Climate Models (GCM) can simulate atmospheric circulation and precipitation/evaporation patterns, they remain computationally limited to study climatic timescales. On the other hand, hydrological models generally rely on prescribed climatic conditions or are applied at regional scale. Because of this, the coupled long-term evolution of Martian climate and hydrology remains poorly understood.
Here we present a coupled climate-hydrology framework based on the Generic Planetary Climate Model (PCM; see the wiki in the references) and the Planetary Evolution Model (PEM, Clément et al., 2026). The PEM is designed to simulate the long-term evolution of surface reservoirs by asynchronous coupling with the PCM. The PEM evolves the long-term climate state from annual tendencies periodically provided by the PCM which computes the full climate physics. New PCM integrations are triggered when the evolving state deviates significantly from the climatic conditions under which the tendencies were derived. This strategy reduces computational cost and bridges the gap between detailed short-term climate simulations and planetary-scale long-term evolution.
The PEM includes a global high-resolution hydrology model (Gauvin et al., 2026) that evolves perennial liquid water reservoirs on the surface (e.g., lakes and oceans). This module computes the formation, disappearance, overflow and merging of lakes according to topography and PCM precipitation/evaporation tendencies. The resulting perennial water distribution is given back to the PCM to update the tendencies, allowing climate and hydrology to interact iteratively.
This work aims to explore how climatic forcing controls the spatial organization and hydrological connectivity of perennial surface water reservoirs on early Mars. As a first application, we consider idealized simulations using prescribed climate scenarios to analyze how precipitation/evaporation patterns influence the redistribution, persistence and connectivity of lakes and runoff systems. We investigate the role of topography in the stability of precipiation-fed reservoirs and runoff-fed reservoirs as well as the transition between isolated lacustrine systems and regionally connected drainage networks. Our results provide key insights into the climate scenarios required to reproduce the fluvial features observed on Mars (e.g., Barnhart et al., 2009; Carr and Head, 2010; Hoke et al., 2011).
This study represents a first demonstration of the PCM-PEM hydrology coupling strategy. Ultimately, this framework will provide a new tool to investigate the co-evolution of climate, hydrology and geomorphology on Mars over geological timescales.
References
Barnhart, C. J., Howard, A. D., and Moore, J. M. (2009). Long‐term precipitation and late‐stage valley network formation: Landform simulations of Parana Basin, Mars. Journal of Geophysical Research: Planets, 114(E1). https://doi.org/10.1029/2008JE003122.
Carr, M. H., and Head, J. W. (2010). Geologic history of Mars. Earth and Planetary Science Letters, 294(3–4), 185–203. https://doi.org/10.1016/j.epsl.2009.06.042.
Clément, J.-B., Forget, F., Vos, E., Lange, L., and Millour, E. (2025). Mars Through Time International Conference, 40.
Gauvain, A., Forget, F., Turbet, M., Clément, J.-B., Lange, L., and Vandemeulebrouck, R. (2025). A Global High-Resolution Hydrological Model to Simulate the Dynamics of Surface Liquid Reservoirs: Application on Mars, EGUsphere [preprint], https://doi.org/10.5194/egusphere-2025-4992.
Hoke, M. R. T., Hynek, B. M., and Tucker, G. E. (2011). Formation timescales of large Martian valley networks. Earth and Planetary Science Letters, 312(1-2), 1-12. https://doi.org/10.1016/j.epsl.2011.09.053.
Wiki of the Generic Planetary Climate Model (PCM) online at https://lmdz-forge.lmd.jussieu.fr/mediawiki/Planets/index.php/Main_Page.
How to cite: Clément, J.-B., Gauvain, A., Metz, C., Forget, F., and Turbet, M.: A coupled climate-hydrology model for the long-term planetary evolution of surface water reservoirs on early Mars, Europlanet Science Congress 2026, The Hague, The Netherlands, 6–11 Sep 2026, EPSC2026-1071, https://doi.org/10.5194/epsc2026-1071, 2026.
Introduction
Mars’ Amazonian period (3 Gyr to present) is thought to have been cold and hyperarid, with a limited role of liquid water in modifying the surface. Mars’ mid-latitude regions host thousands of buried glaciers (termed ‘viscous flow features’), which formed within the last 10s-100s Myr, during the mid-to-late Amazonian period [e.g., 1]. These glaciers are thought to have been deposited by snowfall during Martian ‘ice ages’ driven by cyclical variations in Mars’ orbital obliquity. It has long been assumed that the glaciers have remained predominantly cold-based under cold Amazonian climate conditions. A small number of eskers (ridges of glaciofluvial sediment deposited in ice-confined meltwater tunnels) extending from glaciers in the Phlegra Montes and Tempe Terra regions [e.g., 2-4] have been attributed to rare, spatially restricted subglacial melting of their parent glaciers, driven by transient, localized geothermal heating events. This is consistent with their locations within glaciated tectonic grabens in major volcano-tectonic provinces.
Observations and interpretations
Here, we present two key advances based on observations from orbital image and elevation datasets [5]. First, we identify three additional eskers associated with glaciers in Tempe Terra, which, when combined with three identified by previous studies [3,4], indicate regionally widespread occurrences of Amazonian subglacial melting distributed along a 650 km long mountain chain in Mars’ northern mid-latitudes.
Second, two of the newly identified eskers in Tempe Terra are associated with a landsystem consistent with meltwater drainage into a subglacial palaeolake (37.44°N, 86.42°W). The landsystem comprises two major viscous flow features (debris-covered glaciers), two landforms interpreted as eskers, an esker-terminal fan, subglacial channels, a medial moraine, and a quasi-flat-topped deposit interpreted as glaciofluvial sediments deposited in the subglacial lake cavity [5]. It also contains landforms consistent with postglacial erosion and slumping. Impact crater size-frequency distributions on the surfaces of the two major debris-covered glaciers return a minimum age of 130 Myr (late Amazonian). Considering uncertainties, and that the glaciers have retreated to expose the eskers and subglacial palaeolake deposits, we cautiously estimate that esker formation and meltwater drainage into the palaeolake occurred ~130 Myr to 1 Ga (mid-to-late Amazonian) [5].
Implications
The implications of our observations are twofold. First, evidence for at least six occurrences of subglacial melting evidenced by eskers distributed along a 650 km-long mountain chain in Tempe Terra [3-5] likely necessitates a much more spatially extensive heat source than previously expected (e.g., a geothermal hotspot and/or regional climate change), within the last 100s Myr to 1 Gyr.
Second, the landsystem of which two of these eskers are a part implies that formerly thicker and more extensive Amazonian mid-latitude ice masses on Mars were capable of supporting subglacial lakes. Glaciers in Mars’ mid latitudes are prime targets for next-generation missions aiming to search for life [e.g. 6]. Subglacial palaeolake deposits proximal to these glaciers, which have been exposed by ice retreat, would represent high-priority science targets for such missions. Subglacial lakes on Earth support microbial ecosystems under extreme conditions [7], and palaeolake deposits have high potential for preserving biosignatures in the geologic record [8]. Hence, our discovery should motivate an extensive search for glacial palaeolake deposits across Mars’ mid latitudes as an important new class of exploration targets.
References
[1] Levy et al. 2014. Geophys. Res. Lett
[2] Gallagher and Balme 2015 Earth Planet Sci. Lett.
[3] Butcher et al. 2017 JGR Planets.
[4] Woodley et al. 2022 Icarus.
[5] Butcher et al. 2026 In Review.
[6] National Academies of Science Engineering and Medicine 2023 Origins, Worlds, and Life: Planetary Science and Astrobiology in the Next Decade
[7] Christner et al. 2014 Nature
[8] Summons et al. 2017 Astrobiology
How to cite: Butcher, F. E. G., Arnold, N. S., Johnsson, A., Davis, J. M., Woodley, S. Z., Clark, C. D., Ely, J. C., Gallagher, C., Balme, M. R., Lewis, S. R., Livingstone, S. J., and Storrar, R. D.: Candidate subglacial palaeolake deposits associated with Amazonian-aged debris-covered glaciers and eskers in the mid-latitudes of Mars, Europlanet Science Congress 2026, The Hague, The Netherlands, 6–11 Sep 2026, EPSC2026-232, https://doi.org/10.5194/epsc2026-232, 2026.
Introduction:
The Southern Polar Perennial Cap (SPPC) is a prominent surface feature composed of CO₂, water-ice, and dust [1]. It can be broken down into two main sections: the large water-ice outlier and the residual cap (Figure 1a). The water-ice outlier exhibits high seasonal and interannual variability, while the residual cap is comparatively stable [2][3]. Its surface ice morphology has been categorized, reflecting the many complex processes shaping this area of the SPPC (Figure 1b) [4]. However, the relationship between these morphological units and interannual albedo variability remains poorly understood.
This work uses newly developed true-colour mosaics from the Mars Color Imager (MARCI) to identify the extent of the SPPC, classify albedo levels, and identify areas with the greatest annual variability. By correlating these with surface morphology groups, we aim to identify which morphologies are most affected by seasonal processes and the underlying mechanisms driving them.
Figure 1: A) True-colour MARCI mosaic (Ls= 310°–319.9°) with the SPPC (white box), residual cap (blue box, [4]), and water-ice outlier (red box). B) Morphological units of the residual cap [4].
Methods
The MARCI mosaics span Mars Years (MYs) 30, 33, and 36, between Ls= 310° and 332°, with a temporal resolution of 2° of Ls. While offering higher temporal resolution than [4], they cannot resolve morphological details directly. To identify distinct albedo levels, we apply a Gaussian Mixture Model (GMM) to cluster pixel values in the CIELAB colour space. The GMM is trained on temporally averaged mosaics for each Ls date (Figure 2a & b), capturing the general spatial extent of the SPPC while providing a stable reference for interannual comparison. MYs 28, 29, 34, and 35 are excluded due to direct or lagged impacts from the MY 28 and MY 34 Global Dust Storm Events (GDS). An elbow analysis indicates an optimal cluster count of four, with a silhouette score of 0.7 (Figure 2c). Cluster maps from individual MYs are then compared against the averaged reference to identify regions of cluster change.
Figure 2: A) Region of interest (white box, Figure 1a). B) Cluster map (K = 4). C) Bayesian Information Criterion (BIC) showing K = 4 as optimal.
Results/Discussion
For our initial analysis, we focus on the mosaic spanning Ls = 310°–319.9°, which provides the greatest number of overlapping MYs for interannual comparison. Variability is predominantly concentrated on the margins of the SPPC, with the water-ice outlier exhibiting the greatest variability. Within the residual cap, changes are similarly confined to the margins, with little to no variability observed in the interior, a consequence of the coarse spatial resolution of the mosaics.
The largest departure from the average mosaic occurs during MY 28, when the margins of both the residual cap and water-ice outlier show substantial deviation (Figure 3a). The water-ice outlier is reduced to background dust albedo levels, indicating a far more advanced state of sublimation than the multi-year average. Within the residual cap, the most significant change occurs around 83–85° S, 287–303° E, where clusters transition from the brightest to the second-brightest albedo class in MY 28. Notably, MY 28 is the only MY with significant transitions from bright ice to the background dust cluster, indicating a smaller residual cap extent and consistent with previous studies ([2]; Figure 3c).
Figure 3: A) Cluster transition map (average vs. MY 28). B) Transitions overlaid on average mosaic. C) Transition count by MY; MY 28 shows the highest transitions, including the only ice-to-dust transitions.
When examining the surface ice morphologies, we find no consistent trend linking a specific morphology group to the magnitude of cluster transition (Figure 1b & 3a). However, the morphology groups located at the margins of the residual cap, specifically the B group, are observed to change in our analysis. These groups are associated with various forms of pitted morphologies, suggesting that pitted features may be strongly affected by seasonal processes, such as interannual variability in CO₂ ice sublimation.
Conclusion
Applying GMM clustering in CIELAB colour space to MARCI true-colour mosaics provides a quantitative framework for characterizing interannual albedo variability across the SPPC. Variability is concentrated at the margins of the residual cap and the water-ice outlier, with MY 28 representing the most extreme departure from the multi-year average and the only MY in which portions of the residual cap reach background dust albedo levels. Pitted morphologies at the residual cap margins (group B) emerge as the surface types most strongly associated with this variability. Future work will extend the analysis to additional Ls bins to track seasonal evolution and assess correlations with specific atmospheric or surface processes.
References
[1] Cartwright S. F. A. et al. (2023) JGR: Planets, 128(11). [2] Acharya P. et al. (2024) Icarus, 417, 116104. [3] Calvin W. M. et al. (2017) Icarus, 292, 144–153. [4] Thomas P. C. et al. (2016) Icarus, 268, 118–130.
How to cite: Acharya, P. (. and Calvin, W.: Mapping Albedo Change Across the South Polar Perennial Cap: A Multi-Year MARCI Analysis , Europlanet Science Congress 2026, The Hague, The Netherlands, 6–11 Sep 2026, EPSC2026-600, https://doi.org/10.5194/epsc2026-600, 2026.
Introduction: On Mars, various geomorphological and geological processes leave behind distinct morphological evidence on the surface, providing insights into Mars's history (Carr and Head, 2010). However, the understanding of the origin of such features is often perplexing and challenging, especially when different geological processes are interlinked, reinforced, or modified through interactions over time. Various hypotheses and studies exist connecting lava/magma interactions with water and subsurface ice to the origins of volcanic features in general, such as Volcanic Rootless Cones (VRCs) (Edwards et al., 2012; Hamilton et al., 2011; Marcucci et al., 2017; Pieterek and Jones, 2026). Though connecting lava cum impact crater ejecta materials with surface ice melting for the formation of sinuous discontinuous morphological features remains unexplored and not characterised properly on the surface of Mars. This study identifies such features to the south of Daedalia Planum and involves 1) the geomorphic mapping, 2) regional geomorphic characterisation of the landforms, 3) the chronology of geomorphic units and age dating of rampart craters, 4) Mineralogical analysis of CRISM tiles, and 5) Interconnecting inferences of the morphological features with various geomorphic processes observed.
Data and Methods: In this study, the global high-resolution MRO-CTX mosaic (V01 release) images (Dickson et al., 2024), HiRISE (McEwen et al., 2007), ExoMars TGO-CaSSIS color cubes (Thomas et al., 2017), and MO-THEMIS Day/Night images (Christensen et al., 2004) were used for morphological analysis. The MRO-CRISM Hyperspectral TRDRs tiles (Murchie et al., 2007) were utilized for mineralogical analysis, while the MGS-MOLA (Smith et al., 2001), MEX-HRSC (Jaumann et al., 2007), and CaSSIS DTMs (Thomas et al., 2017) were used for topographical analysis.
Results and discussions: Daedalia Planum, predominantly known for its lava flows (Giacomini et al., 2012), also preserves well-documented glacial deposits (Schon and Head, 2012). We observed the presence of layer ejecta or Rampart craters, and the glacial evidence, such as Lineated Valley Fills (LVFs), Ring Mold craters (RMCs), Pitted terrain patterns, ice-sublimation scarps within them, provides substantial evidence for subsurface ice presence in the region, along with other surface processes (Mangold, 2011). Interestingly, such sinuous features are more often found in the proximity of layered ejecta craters and short-lived wide fluvial channels within the region of interest encompassing three volcanic Mons and episodes of lava flows. Among those features within the same volcanic ice interactions mapped unit, we observe the presence of possible Volcanic Rootless Cones (Pieterek and Jones, 2026) in the southern extent of the study area, emphasizing more the role of lava and subsurface ice interactions. A localised presence of an inverted fluvial channel gives more clues on the past water activity (Liu et al., 2021), and the role of differential erosion processes of the indurated channel material owing to the lava-filled induration mechanism (Burr et al., 2010), provided its proximity to the Mons. The Chronology of volcanic ice interaction units indicates a Late Noachian to Early Hesperian period, possibly linking either to ancient (sub)surface ice most likely to have been present at high altitudes during high obliquity cycles (Wordsworth et al., 2013), and age dating of rampart craters reveals 3.4 Gya, further supporting the evidence of potential buried ice layers (Boyce and Mouginis-Mark, 2025). In addition to these, the CRISM (Compact Reconnaissance Imaging Spectrometer for Mars) mineralogical analysis of the rampart crater wall shows an active H20 ice spectral signature as per spectral parameters of (Viviano et al., 2014; Harish et al., 2020), emphasizing the ice/frost activity in the region. Further extended CRISM mineralogical analysis in the intra-crater deposits reveals the presence of phyllosilicates, precisely the hydrous mineral Mg-smectite spectral signature, which substantiates strong aqueous activity.
Conclusion: The morphological record of these interactions preserved in various morphological processes, glacio-volcanic landforms, lava-filled plains, and intra-crater deposits offers a critical understanding of Early Mars to the present. Thus, delivering new insights on interactions of Ice, lava, or impact ejecta-driven surface morphology on Mars.
Acknowledgement: This work has been developed under the ASI-INAF agreement n. 2024-40-HH.0
References:
Boyce, J. M. and Mouginis-Mark, P. J.: Icarus, 425, 116336, doi:10.1016/j.icarus.2024.116336, 2025.
Carr, M. H. and Head, J. W.: Earth Planet. Sc. Lett., 294, 185–203, doi:10.1016/j.epsl.2009.06.042, 2010.
Christensen, P. R., et al.: Space Sci. Rev., 110, 85–130, doi:10.1023/B:SPAC.0000021008.16309.94, 2004.
Dickson, J. L., et al.: Earth Space Sci., 11, e2024EA003555, doi:10.1029/2024EA003555, 2024.
Edwards, B., et al.: J. Geophys. Res., 117, 2011JB008985, doi:10.1029/2011JB008985, 2012.
Giacomini, L., et al.: Icarus, 220, 679–693, doi:10.1016/j.icarus.2012.06.010, 2012.
Hamilton, C. W., et al.: J. Geophys. Res., 116, E03004, doi:10.1029/2010JE003657, 2011.
Jaumann, R., et al.: Planet. Space Sci., 55, 928–952, doi:10.1016/j.pss.2006.12.003, 2007.
Liu, Z., et al.: Earth Planet. Sc. Lett., 562, 116854, doi:10.1016/j.epsl.2021.116854, 2021.
Mangold, N.: Geomorphology, 126, 1–17, doi:10.1016/j.geomorph.2010.11.009, 2011.
Marcucci, E. C., et al.: Bull. Volcanol., 79, 89, doi:10.1007/s00445-017-1176-y, 2017.
McEwen, A. S., et al.: J. Geophys. Res., 112, E05S02, doi:10.1029/2005JE002605, 2007.
Mouginis‐Mark, P. J. and Baloga, S. M.: Meteorit. Planet. Sci., 41, 1469–1482, doi:10.1111/j.1945-5100.2006.tb00430.x, 2006.
Murchie, S., et al.: J. Geophys. Res., 112, E05S03, doi:10.1029/2006JE002682, 2007. [1]
Pieterek, B. and Jones, T. J.: npj Space Explor., 2, 15, doi:10.1038/s44453-026-00031-2, 2026.
Schon, S. C. and Head, J. W.: Earth Planet. Sc. Lett., 317–318, 68–75, doi:10.1016/j.epsl.2011.09.005, 2012.
Smith, D. E., et al.: J. Geophys. Res., 106, 23689–23722, doi:10.1029/2000JE001464, 2001.
Thomas, N., et al.: Space Sci. Rev., 212, 1897–1944, doi:10.1007/s11214-017-0421-1, 2017.
Viviano, C. E., et al.: J. Geophys. Res.-Planets, 119, 1403–1431, doi:10.1002/2014JE004627, 2014.
Weiss, D. K. and Head, J. W.: Icarus, 233, 131–146, doi:10.1016/j.icarus.2014.01.038, 2014.
Wordsworth, R., et al.: Icarus, 222, 1–19, doi:10.1016/j.icarus.2012.09.036, 2013.
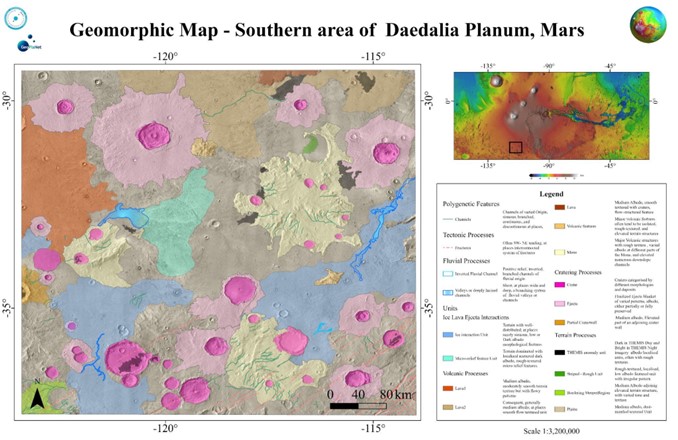
Fig 1: The Geomorphic Map of the study area, Daedalia Planum, Mars.
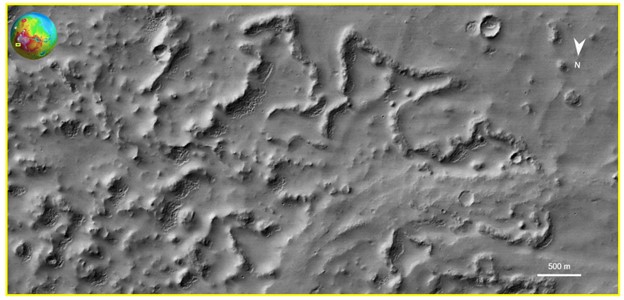
Fig 2: The possible morphological evidence of Ice, lava, and impact ejecta interactions
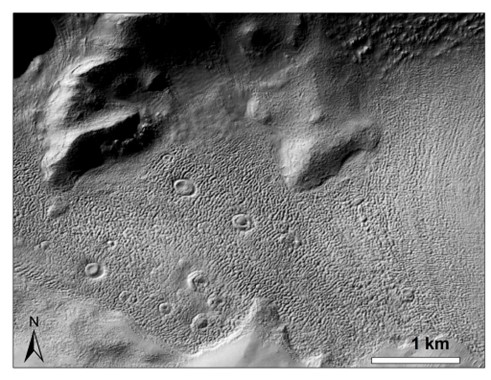
Fig 3: Some of the glacial evidence observed: Ring Mold Craters (RMCs) on Lineated Valley Fill (LVF) within a crater in the study area.
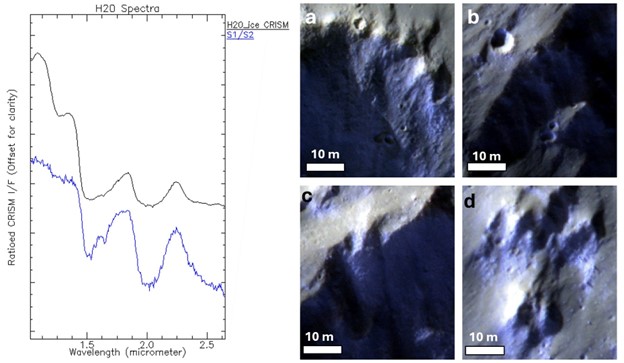
Fig 4: H2O ice spectra observed on a rampart crater ejecta
How to cite: Umar Baig, T., Bertoli, S., Re, C., Tullo, A., Cremonese, G., Baschetti, B., and Costa, N.: New insights on interactions with Ice, lava, and impact ejecta in Daedalia Planum, Mars, Europlanet Science Congress 2026, The Hague, The Netherlands, 6–11 Sep 2026, EPSC2026-1236, https://doi.org/10.5194/epsc2026-1236, 2026.
Introduction: The Mars Missions Analogue Sample Library (ASL) was officially opened in late 2024 at the Natural History Museum in Oslo. The ASL is a coordinated NASA-ESA initiative and was developed to provide the scientific community with carefully selected terrestrial analogues from around the world for engineering, science, curation, and planetary protection needs.
The initial ASL collection was focused on samples, which were collected by NASA’s Mars 2020 Perseverance rover [1]. These first analogue sample sites were suggested by the ‘Rock Sample Team’, an expert science team, which was tasked to help identify field sites from which to collect physically representative Mars analogues. These efforts were then carried forward by the Analogue Team, a sub-group of the MSR Campaign Science Group (MCSG), which was chartered to strategically select natural samples from the field that best represent discrete components of the Jezero samples.
Since the ASL opening in 2024, new samples are being added to the collection with focus on Mars 2020 and ExoMars Rosalind Franklin missions. Updates on the ASL collection and future work will be presented at this meeting.
Mars Missions ASL Collection: The current ASL collection includes: (A) holocrystalline basalts, both aphyric and plagioclase-phyric, from Oregon, USA, (B) carbonate cemented and (C) carbonate-gypsum cemented fine sandstones/siltstones from California, (D) eolian volcanic sands from Iceland, (E) olivine cumulates from Scotland, and (F) clay-rich sedimentary rocks from juvenile deposits in southwest Iceland. The samples were selected to represent samples collected during the crater floor and delta front campaign of the Mars2020 mission. The first five samples were collected during the first field campaign in 2023 [2] and the clay-rich sedimentary rocks during a second field campaign in 2025.
Sample Requests: The ASL collection is curated at and distributed from the Natural History Museum in Oslo in collaboration with the University of Oslo (UiO). This activity is supported by the Norwegian Space Agency (NOSA) and ESA. Requests for analogue samples can be made from the ASL website with the priority of sample allocation flowing from ongoing missions to the scientific community, and then to public relations and outreach. The sample allocation process is managed by the Analogue Sample Allocation Panel (ASAP) with members from NASA, ESA, the University of Oslo and the Natural History Museum Oslo. The ASL also includes comprehensive baseline sample characterization by the Norwegian Geotechnical Institute (NGI), with reports available to the community.
Ongoing and future work: The Analogue Team was tasked to critically evaluate the current collection and identifying any areas that need to be supplemented and continues to create a more robust ASL for the community to work with [3,4]. As a first step, the sedimentary analogue samples were reevaluated. These samples were selected to imitate the grain size, general depositional environment, and cement composition of delta front sedimentary samples in order to provide an analogue for the physical and textural properties of the returned samples. However, they are poor mineralogical or geochemical analogues for Mars. The analogue team subsequently identified two new field sites: One in Iceland and one in Italy to collect (1) a sandstone with basaltic provenance and (2) sandstone to pebble conglomerates with an ultramafic provenance. While the Icelandic samples were collected during the field campaign in 2025, the analogue samples from Tornio Hills will be collected during the 2026 field campaign. The Analogue Team has also re-examined both, the igneous and regolith sample analogs and plans to continuously build the ASL as Perseverance continues to explore the martian surface. Moreover, the ASL is currently extended to host samples relevant to other martian missions, such as the upcoming ExoMars Rosalind Franklin mission, which will explore new terrains. Their addition to the ASL will make the analogue collection more comprehensive. Several sample request have been made since the ASL opening [e.g. 5, 6]. The Mars Missions ASL remains a key resource of strategically selected terrestrial analogue samples for the scientific community.
Acknowledgments: The authors would like to thank the members of the “Rock Sample Team” and the “Analogue Team” for their work and recommendations on terrestrial analogue samples. We also would like to thank the members of the field campaigns 2023 and 2025 for their effort to collect the analogue samples.
References: [1] Thiessen F. et. al. (2024) Met. Soc. 2024, Abstract #6173 [2] Thiessen F. et. al. (2024) 55th LPSC, #1208 [3] Thorpe M. T. et al. (2025), 56th LPSC, #2109 [4] Velbel et al. (2026), 57th LPSC, #1751 [5] Ciocco et al. (2025), EPSC-DPS, #1445, [6] Willcocks et al. (2026), 57th LPSC, #1428.
How to cite: Thiessen, F., Sefton-Nash, E., Ciocco, M., Krzesinska, A., Werner, S., Mueller, A., Harrington, A., Thorpe, M., Velbel, M., Griffiths, L., Mikesell, D., Smith, A., Hays, L., and Kminek, G.: Updates on the Mars Missions Analogue Sample Library, Europlanet Science Congress 2026, The Hague, The Netherlands, 6–11 Sep 2026, EPSC2026-502, https://doi.org/10.5194/epsc2026-502, 2026.
Introduction: The MGS/MOLA topography data of Mars shows a dichotomy between the highly craterised and elevated southern hemisphere compared to the northern smoother and low-altitude terrains1 (Fig. 1A). Many morphological and mineralogical clues today support the existence of a past liquid water ocean in the northern hemisphere of Mars, such as a large sedimentary formation in the North2-3; possible paleo-shorelines following the topographic dichotomy between the two hemispheres4-5; a network of fluvial valleys oriented northward6-7; deposits of an ancient tsunami caused by an impact8 as well as hydrated mineralogy9-12. However, the spatio-temporal extent of this ocean remains poorly constrained. It is argued that such an ocean could have existed until at least 3 Gyr in Mars’ history13. A recent study highlights the morphological resemblance between Olympus Mons, the largest volcano of the solar system on Mars located at the dichotomy, and terrestrial volcanic islands (Canary, Azores, Cape Verde, Hawaii…) today still surrounded by the ocean, which display a 15° basal scarp average slope break14. Could Olympus Mons once have been a volcanic island? Here we further explore this hypothesis by studying the mineralogy and morphology of Olympus Mons using hyperspectral and high resolution imagery data.
Methodology: Here we aim to determine if hydrated minerals can be found around the edifice of Olympus Mons, and thus imply a past interaction of volcanic rocks with water. We used hyperspectral data from the MRO/CRISM spectrometer15 to get insights on the mineralogy of Olympus Mons’ basal scarp (Fig. 1B). Pre-processing16 was followed by a photometric and atmospheric correction, a smoothing pipeline17 and the calculation of spectral parameter maps18 to localize potential hydrated minerals which typically absorb in the near infrared 1.0-2.6 µm range. To better constrain the precise geomorphology of a putative water-volcano contact where hydrated mineralogy is suspected, we also studied the morphology of the basal scarp using MRO/HiRISE images at a resolution of up to 30 cm/pixel19 (Fig. 1B).
Results & Discussion: The flanks and summit caldera of Olympus Mons, above 6 km of altitude and therefore supposedly never in contact with an ocean, spectrally show a highly widespread signal with no remarquable absorption bands on the range of 1.0 to 2.6 µm, interpreted as the iron-rich basaltic primary composition of rocks covered in a high amount of dust at the surface of the volcano. We also find dominant signatures of water ice with strong features at 1.5 and 2.0 µm, in several locations of the volcano flanks and basal scarp. However, we also find spectral signatures that we interpret as signs of hydrated mineralogy in several locations around the volcano. These spectra either show an absorption band around 2.1 µm, similarly to mono-hydrated sulfates, or bands at 2.2 and 2.3 µm, typically found for hydrated phyllosilicates (Fig. 1D). These features occur in the basal scarp (Fig. 1C), precisely where the rock is expected to outcrop under a lower dust cover in steep slope ravines. The scarcity of detections either suggests that the volcano’s mineralogy is barely hydrated, or that the hydrated spectral signatures are mainly hidden by the dust cover even in most places of the basal scarp. In any case, if these detections are not yet a confirmed evidence of an ancient volcano-ocean contact, they could be a sign of volcanic interaction with liquid water in the past of Mars in the region of Olympus Mons.
Conclusions & Perspectives: No in-situ data is today available in the area of Olympus Mons. Hence, to further test if Olympus Mons could have been an ancient volcanic island, we presently analyze a terrestrial volcanic analog that could inform on alteration conditions and processes of volcanic rock in contact with a liquid water ocean. We expect this comparative study to better constrain the observed spectral signatures around Olympus Mons.
Acknowledgments: This work has been financially supported by the National Planetology Program (PNP) of the National Institute of Universe Sciences (INSU-CNRS) and benefited from financial support from the CNES Research Proposal Call (APR).
References: [1] Smith, D. E. et al. (1998) Science 279 (5357): 1686–92. [2] Tanaka K. L. and Scott D. H. (1987) USGS IMAP 1802-C. [3] Carr M. H. and Head J. W. (2003) JGR: Planets 108 (5). [4] Parker J. T. et al. (1993) JGR 98 (E6). [5] Sholes S. F. et al. (2021) JGR : Planets 126 (5). [6] Carr M. H. and Clow G. D. (1981) Icarus, Vol. 4. [7] Baker et al. (1982) Reports of Planetary Geology Program. [8] Costard F. et al. (2017) JGR: Planets 122 (3): 633–49. [9] Poulet F. et al. (2005) Nature 438 (7068): 623–27. [10] Fueten F. et al. (2014) JGR: Planets119 (2): 331–54. [11] Flahaut J. et al. (2015) Icarus 248 (March):269–88. [12] Brossier J. et al. (2024) ResearchGate conference paper. [13] Schmidt F. et al. (2022) PNAS, Vol. 119, No. 4. [14] Hildenbrand A. et al. (2023) EPSL 619. [15] Murchie S. et al. (2007) JGR, 112. [16] Quantin-Nataf C. et al. (2018) Planetary and Space Science 150, 157-170. [17] Bultel B. et al. (2015) IEEE Journal of Selected Topics in Applied Earth Observations and Remote Sensing 8.6, 3039-3049. [18] Viviano-Beck C. E. et al. (2014) JGR: Planets 119 (6): 1403–31. [19] McEwen A. et al. (2007) JGR, 112.
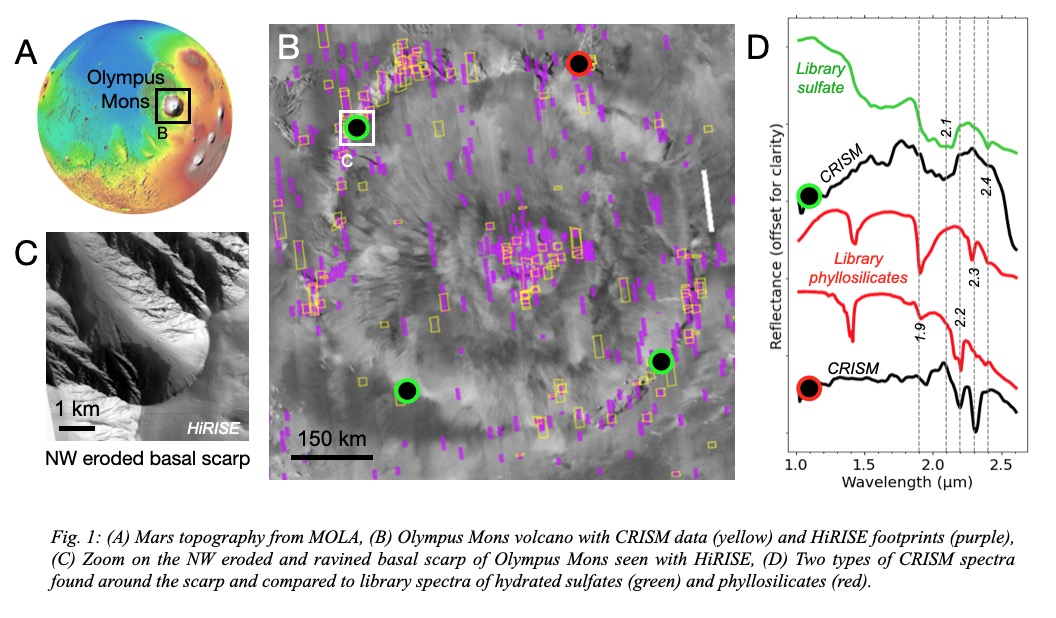
How to cite: Cornillon, A., Bultel, B., and Hildenbrand, A.: Hydrated mineral features suggested around Olympus Mons on Mars using CRISM and HiRISE: implications on water-volcano interactions , Europlanet Science Congress 2026, The Hague, The Netherlands, 6–11 Sep 2026, EPSC2026-56, https://doi.org/10.5194/epsc2026-56, 2026.
Please decide on your access
Please use the buttons below to download the supplementary material or to visit the external website where the presentation is linked. Regarding the external link, please note that Copernicus Meetings cannot accept any liability for the content and the website you will visit.
Forward to presentation link
You are going to open an external link to the presentation as indicated by the authors. Copernicus Meetings cannot accept any liability for the content and the website you will visit.
We are sorry, but presentations are only available for users who registered for the conference. Thank you.
Valles Marineris is a natural cross-section exposing rocks from the ancient Martian crust. The mineralogical composition of these rocks has been studied at the 18 m/pixel spatial scale from orbit using Visible to Short-Wave Infrared (VSWIR) spectroscopy with the Compact Reconnaissance Imaging Spectrometer for Mars (CRISM, MRO, [1]). The oldest Martian crustal blocks are light-toned and associated with spectral absorptions indicative of Low-Calcium Pyroxene (LCP) [2, 3]. Nearby, plagioclase feldspar rich layers have also recently been detected, suggesting the ancient Martian crust may have had a more felsic composition than the basalts found on the surface [4, 5]. In situ data from the rocks exposed in Valles Marineris’ walls would improve our ability to characterize the geologic setting and composition of these ancient terrains and address key questions about the formation of the early Martian crust such as whether the light-toned rocks containing LCP and plagioclase are related to alkaline magmatism, and which formation processes could explain the juxtaposition of both mafic and felsic crustal materials [6].
The study presented below is funded through NASA’s Planetary Science Technology and Analog Research program and aims to advance the scientific and technical basis for a future in situ mission to access the ancient terrains exposed in the walls of Valles Marineris. Specifically, a helicopter equipped with a VSWIR imaging spectrometer could investigate the mineralogical composition of the rocks at a much higher spatial resolution than is currently possible from orbit, resolving key information about their texture and mineralogy which is necessary to distinguish between crustal formation models. Of great interest is the abilities of a helicopter-mounted spectrometer to detect the 1.3 µm spectral absorption associated with plagioclase feldspars [7], which can only be detected if ferrous iron is incorporated in its chemical lattice [8], which can be quickly obscured by darker, mafic minerals [9]. Within whole rocks, plagioclase crystal size [10, 11, 12] and the degree of weathering [12, 13] have been identified as key parameters that affect the detectability of plagioclase absorptions.
In this study, we use spectral datasets collected at multiple spatial resolutions to determine how plagioclase crystal size, distribution, weathering state, and transparency affect the detectability of the 1.3 µm plagioclase absorption at different spatial scales. These results will inform requirements for VSWIR spectral data acquired by future Mars helicopter payloads and help interpret the data they collect. We analyzed hyperspectral datasets of whole plagioclase-phyric basalts from outcrops of the Steens basalt unit collected at several locations in southeast Oregon, including Steens Mountain and Hart Mountain. The Steens basalt unit is part of the Columbia River Basalt Group (CRBG) and is the oldest (~17 Ma) and most mafic member of this Large Igneous Province [14]. Alongside olivine and pyroxene contained in this basalt, it is notable for its dominant microlithic porphyritic texture characterized by centimeter-scale plagioclase phenocrysts [15]. The plagioclase phenocrysts share a similar chemistry (An57–74) throughout the section [15], but they remain diverse in size, shape, and abundance, providing an ideal location to explore how these physical properties affect bulk spectral properties. These basaltic samples were also selected as potential analogs for Martian rocks. Indeed, a plagioclase-phyric basalt has been proposed as one possible lithology for the plagioclase rich layer in Valles Marineris [5].
Rock samples were first imaged as cut slabs and rough surfaces at JPL using the Ultra-Compact Imaging Spectrometer for the Moon (UCIS-Moon) hyperspectral camera that operates between 0.6 and 3.6 µm [16]. The high spatial resolution, of about 80 µm/pixel, allowed identification and spectral characterization of individual plagioclase crystals. To complement laboratory analyses, outcrops at Steens Mountain and Hart Mountain were imaged at the landscape scale using a Headwall SWIR hyperspectral camera operating between 0.9 and 2.6 µm, with a spatial resolution on the order of centimeters per pixel under our acquisition conditions [17].
Here we will present preliminary results from this investigation (Figure 1). At the 80 µm/pixel scale, large plagioclase crystals (ranging from the millimeter scale up to several centimeters >> 80 microns) in these rocks are readily identified by a ~1.3 µm absorption, even in weathered surfaces. The depth and shape of the plagioclase absorption is dependent on surface texture (fresh rough surface vs. saw cut face) and crystal transparency. Spectra are averaged over several pixels, simulating lower spatial resolution data, and the absorption is less readily detected in samples with very small plagioclase crystals than large ones, even if plagioclase on average takes up the same surface abundance within an averaged region. Plagioclase absorptions are also mappable in the outcrop-scale hyperspectral images, and their shape and depth vary throughout the outcrop. These first results demonstrate that airborne sensors operating at tens of centimeter spatial resolutions on Mars could reliably detect plagioclase phenocrysts in steep, natural outcrops. Natural rock textures will generally favor detection relative to cut samples, and large phenocrysts rather than microlites is the dominant control spectral detectability, rather than volumetric abundance. The persistence of plagioclase signatures under weathering is also encouraging for the detection of plagioclase in Valles Marineris using VSWIR spectro-imaging datasets.
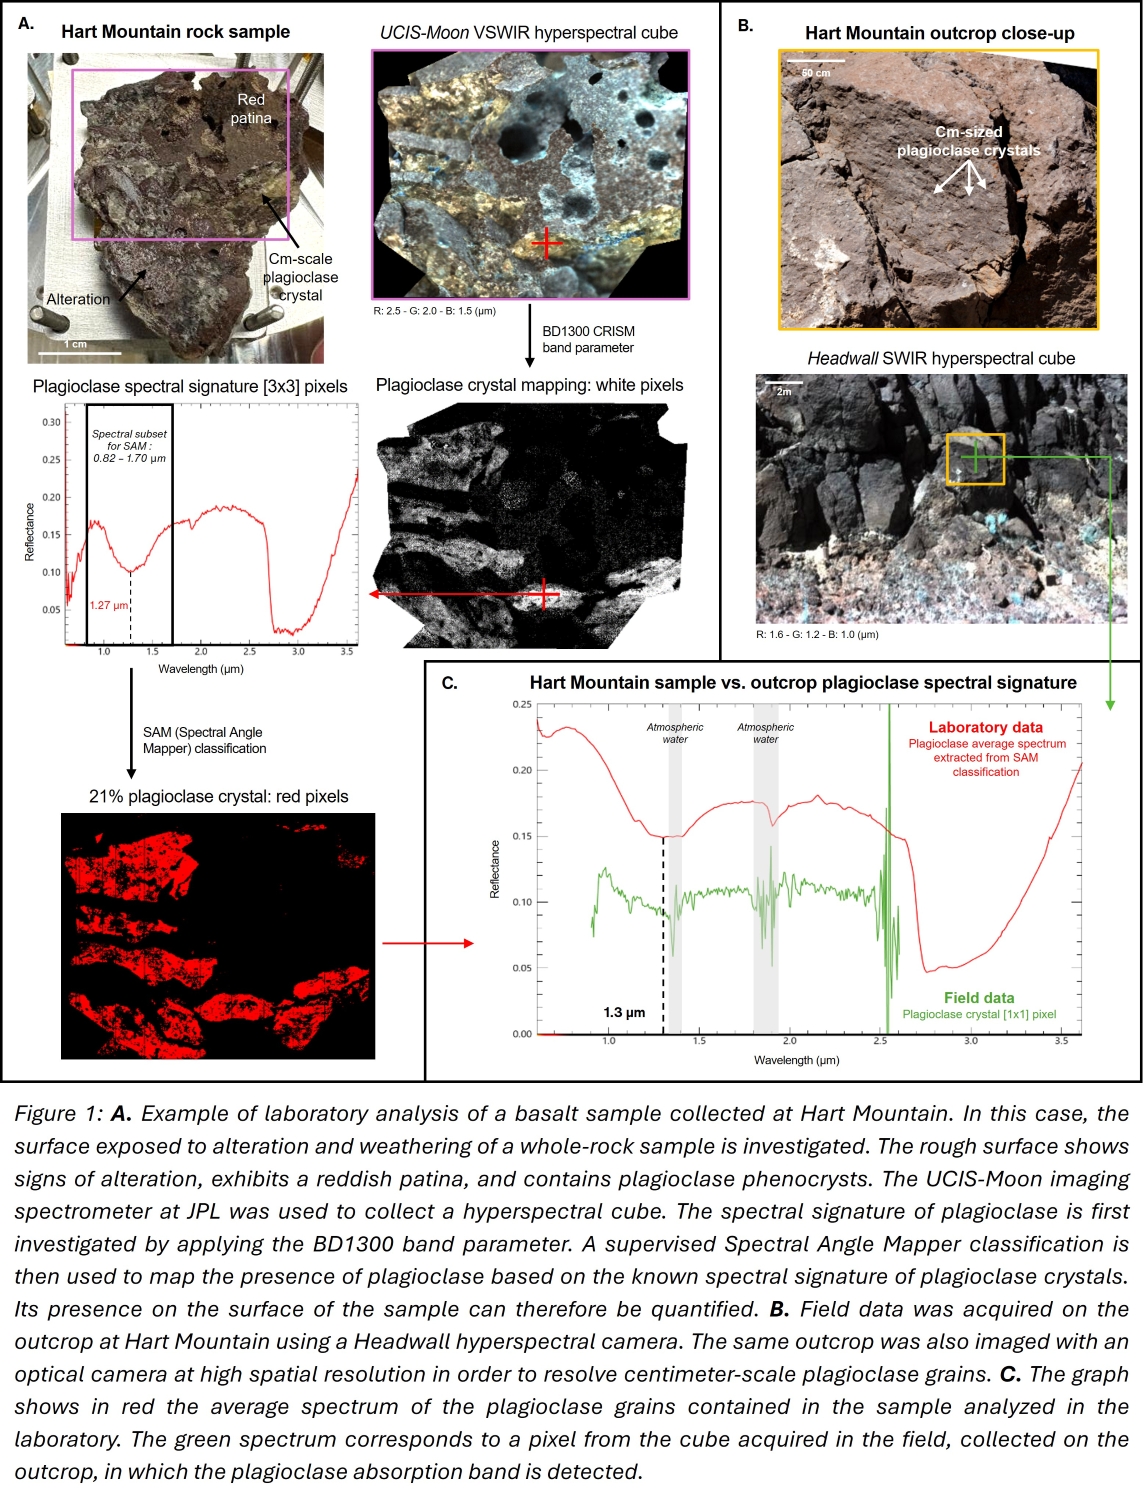
References:
[1] Murchie, S., et al. (2007), J. Geophys. Res., 112, E05S03.
[2] Flahaut, J., et al. (2012), Icarus, 221(1).
[3] Quantin, C., et al. (2012, Icarus, 221(1).
[4] Viviano-Beck, C.E., et al. (2017), Icarus, 284.
[5] Flahaut, J., et al. (2023), Geophys. Res. Lett., 50, e2022GL100772.
[6] Payré, V., et al. (2024), Minerals, 14, 452.
[7] Adams, J.B., and Goullaud, L.H. (1978), Lunar Planet. Sci. Conf. 9th.
[8] Hafner, S.S., et al. (1971), Earth Planet. Sci. Lett., 12.
[9] Crown, D.A., and Pieters, C.M. (1987), Icarus, 72.
[10] Rogers, A.D., and Nekvasil, H. (2015), Geophys. Res. Lett., 42.
[11] Barthez, M., et al. (2023), J. Geophys. Res.: Planets, 128, e2022JE007680.
[12] Barthez, M., et al. (2026), Icarus, 453, 117027.
[13] Mandon, L., et al. (2022), Earth Space Sci., 9, e2021EA001871.
[14] Moore, N.E., et al. (2020), Geochem. Geophys. Geosyst., 21, e2020GC008910.
[15] Moore, N.E., et al. (2018), Geosphere, 14(6).
[16] Haag, J.M., et al. (2020), Proc. of SPIE, 11504(03).
[17] Greenberger, R.N., et al. (2020), J. Geophys. Res.: Planets, 125, e2019JE006218.
How to cite: Barthez, M., Fraeman, A. A., Liu, Y., Ehlmann, B. L., Kamps, O., Levy, J., and Brockers, R.: Constraining plagioclase detectability in potential Martian crust analogs for future helicopter-based imaging spectroscopy, Europlanet Science Congress 2026, The Hague, The Netherlands, 6–11 Sep 2026, EPSC2026-657, https://doi.org/10.5194/epsc2026-657, 2026.
Mapping the global distribution of carbonate minerals on the Martian surface is a prerequisite for understanding the aqueous and atmospheric evolution of Mars, as these minerals represent a principal sink for atmospheric CO₂ and direct tracers of past liquid water activity. To date, the orbital data from CRISM offers our best opportunity for detecting the diagnostic vibrational signatures of these minerals; however, studies have focused almost entirely on the weak short-wave infrared (SWIR) overtone and combination bands near 2.3 and 2.5 µm [1,2]. These features can be spectrally degenerate with co-occurring phyllosilicates and are not always strong enough to reveal smaller or less exposed deposits, leaving a significant fraction of the carbonates undetected.
The strongest spectroscopic signatures of carbonates lie in the mid-wave infrared (MWIR): the fundamental absorptions at 3.4 and 3.9 µm [2]. These features remain largely unexploited in CRISM data, due to the limited spectral range of the instrument, which does not fully cover the 3.9 µm band, and to the superposition of reflected solar radiance and planetary thermal emission in the 3–4 µm window, which renders band depth estimation challenging.
To overcome this issue, we developed a dual-band detection framework based on two independent pipelines processing the SWIR and MWIR parts of the spectrum. While the SWIR pipeline works similarly to conventional detection methods, refining the 2.5 µm overtone absorption, the MWIR pipeline has to deal with the presence of thermal emission. Each pipeline produces a spatially filtered detection map with fully propagated, SNR-anchored uncertainties.
In particular, the MWIR pipeline operates on the atmospherically corrected datacube and treats the observed signal as the sum of a reflected solar continuum, a surface thermal contribution, and channel noise. The solar continuum is estimated using an iteratively reweighted least-squares (IRLS) fit to a band-masked window between 1.8–2.6 µm, which serves as a robust estimator with a well-defined per-pixel noise level, avoiding the limitations that affect classical shoulder-based approaches. Using these residuals, the thermal contribution is estimated by a constrained Planck greybody fit in the 3–4 µm window, with temperature values restricted to a realistic Martian daytime range. Instrumental artifacts are subsequently identified and filtered both at the channel level and in map space before proceeding with the final detection step.
The SWIR pipeline uses a pre-processed atmospherically corrected and denoised datacube, where thermal emission is absent. The 2.5 µm overtone is isolated with an iterative continuum fit and sub-pixel band-centre localisation, while band absorption is quantified via a Gaussian-kernel-weighted band-depth integration. SNR, band-centre location, and amplitude of the detected absorption serve as criteria for distinguishing carbonates from overlapping phyllosilicates and sulphates [3].
As a first demonstration, the framework is applied to a single CRISM observation, FRT000186FA at Nili Fossae, a scene chosen for its close proximity to Jezero Crater, where carbonate presence has been independently established both from orbit [4] and in situ by the Perseverance rover [5,6]. Both pipelines detect a spatially coherent area of elevated absorption,with detection maps consistent in spatial extent and structure.
Figure 1: Band depth integral at 2.5 µm (SWIR pipeline) for CRISM observation FRT000186FA (Nili Fossae).
Figure 2: Band depth integral at 3.9 µm (MWIR pipeline, thermal-corrected) for CRISM observation FRT000186FA (Nili Fossae).
Nili Fossae serves here as a validation benchmark, with the framework designed for systematic application across a geologically diverse sample of CRISM observations, moving toward a more complete carbonate inventory of Mars.
This work is funded by the Italian Space Agency (ASI) [ASI-INAF n.23-3-HH.0]
[1] Harner, P.L., & Gilmore, M.S. (2015). Visible–near infrared spectra of hydrous carbonates, with implications for the detection of carbonates in hyperspectral data of Mars. Icarus 250, 204-214. http://dx.doi.org/10.1016/j.icarus.2014.11.037
[2] Bishop, J.L., et al. (2021). Spectral properties of anhydrous carbonates and nitrates. Earth and Space Science, 8, e2021EA001844. https://doi.org/10.1029/2021EA001844
[3] Plebani, E., et al. (2022). A machine learning toolkit for CRISM image analysis. Icarus 376, 114849. https://doi.org/10.1016/j.icarus.2021.114849
[4] Ehlmann, B.L., et al. (2008). Orbital Identification of Carbonate-Bearing Rocks on Mars. Science 322, 1828-1832. https://doi.org/10.1126/science.1164759
[5] Clavé, E., et al. (2023). Carbonate detection with SuperCam in igneous rocks on the floor of Jezero Crater, Mars. JGR Planets 128, e2022JE007463. https://doi.org/10.1029/2022JE007463
[6] Clavé, E., et al. (2026). In Situ Carbonation of Sedimentary and Igneous Rocks of Ultramafic Composition in Jezero Crater, Mars. JGR Planets 131, e2025JE009107. https://doi.org/10.1029/2025JE009107
How to cite: Saggese, V., Altieri, F., Brossier, J., De Sanctis, M. C., Frigeri, A., and Raponi, A.: Improved Detection of Martian Carbonates from CRISM, Europlanet Science Congress 2026, The Hague, The Netherlands, 6–11 Sep 2026, EPSC2026-819, https://doi.org/10.5194/epsc2026-819, 2026.
Introduction
Oxia Planum (Fig. 1) is a region of Mars located on the margin between the old, heavily cratered highlands of Arabia Terra (Noachian-aged) and the younger, smoother lowlands of Chryse Planitia (Hesperian-aged). From orbit it shows several geomorphological records of past widespread water–rock interactions, including fractured, layered, clay-bearing deposits with high astrobiological potential [1, 2, 3]. For this reason, Oxia Planum has been selected as the landing site for the ESA Rosalind Franklin Mission (RFM). The main goal of the RFM is to search for past (and/or present) traces of life, particularly in the Martian shallow subsurface where material of astrobiological interest is better preserved. To achieve this, the RFM rover is equipped with a drill capable of collecting, for the first time for a mission on Mars, samples down to a depth of 2 meters, and with a suite of instruments designed to discriminate biosignatures in the samples, gathering supporting geological context information [4].
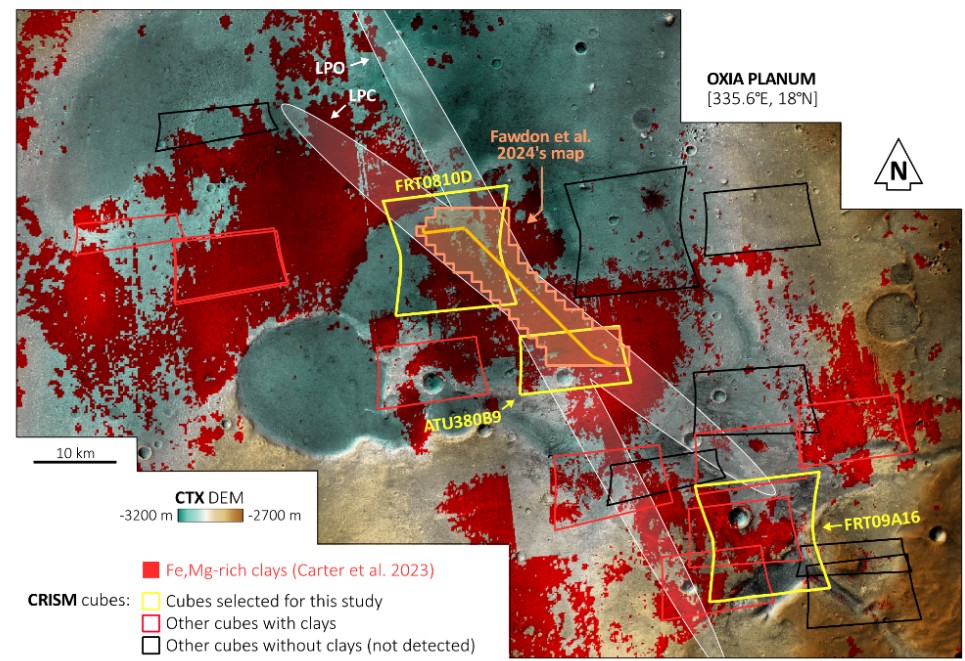
Figure 1: Oxia Planum, Mars with CTX basemap colored by elevation. The white ellipses represent the current landing ellipses, and the orange polygon in center represents the outline of the geologic map of the region [5], with the map’s cross-section added in orange. Note that two cubes selected for study overlap with the geologic map while one cube for study is towards the delta and outside the previously mapped area.
Here, we focus on selected regions of interest (ROIs) within the Oxia Planum landing area (Fig. 2) to investigate how clay distribution relates to other geologic features. We incorporate an Oxia Planum survey of fractures mapped at 1:1250 scale in spaced windows (e.g., blue squares in Fig. 2) which provides the general fracture characteristics of multiple units. Within ROIs, we repeat this fracture mapping to connect the geomorphological and spectral analysis with bedrock fracture behavior to more fully characterize the rocks, and contribute to strategies for guiding the selection of drilling sites.
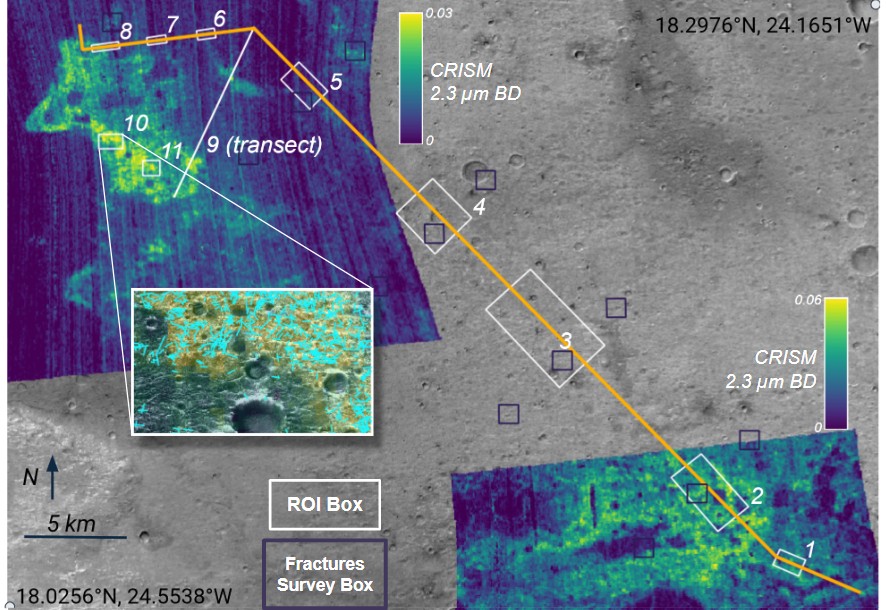
Figure 2: CRISM spectral maps of the 2.3 micron band depth [3] where yellow tones represent high Fe,Mg-phyllosilicate signatures, with CTX basemap as background and the geologic cross-section [5] overlain in orange. The ROIs are shown and labeled in white. Dark blue squares represent areas where regional fracture analysis has been performed to aid in extending the geologic mapping to unmapped areas. Inset of ROI 10 shows the fractures which have been mapped (blue) on HiRISE imagery (shown), and exhibit a strong correlation with clay-rich areas.
Data and Methods
ROIs were chosen based on (1) mapped contacts between bedrock units [5], (2) stratigraphic exposures within mounds and/or crater walls, (3) association with the geologic cross-section [5], and/or (4) high likelihood of encountering phyllosilicates (Fe,Mg-rich clays), based on CRISM cube analysis [3]. The southernmost CRISM cube of interest, FRT09A16 (Fig. 1), is located near the delta containing sediments derived from the highlands, thus providing a key insight into the stratigraphic relationships and depositional modes of the units farther downslope. Within ROIs, we created meter-scale resolution digital terrain models (DTMs) using the NASA Ames Stereo Pipeline and HiRISE stereopairs, tied to MOLA elevations.
Fracture mapping was performed on HiRISE images which were manually georeferenced to improve their correlation with CRISM data. Mapping at 1:2000 scale (minimum resolvable fracture size approximately 10m) provides comparable data to the fracture survey, providing a dataset that aids in expanding geologic units beyond the current bounds of the map [5]. Detailed mapping at 1:1000 scale, following [8], has sufficient detail to analyze fracture topology, improving unit characterization and providing insight into fracture formation mechanisms [e.g., 9].
Preliminary results and Discussion
Figure 3 compares the DTM created from HiRISE using the NASA Ames Stereo Pipeline [6] with the MADNET DTM [7] created through machine learning, both of which are based on HiRISE images. The example shows the subdued elevation changes of the MADNET DTM, where the elevation decrease from west to east is partially inherited within the crater rim elevations. The Ames Stereo Pipeline DTM shows a more accurate crater depth-to-width ratio of approximately 0.1, with the crater rim maintaining a realistic cross-sectional shape and the elevation change mostly impacting the surrounding landforms.
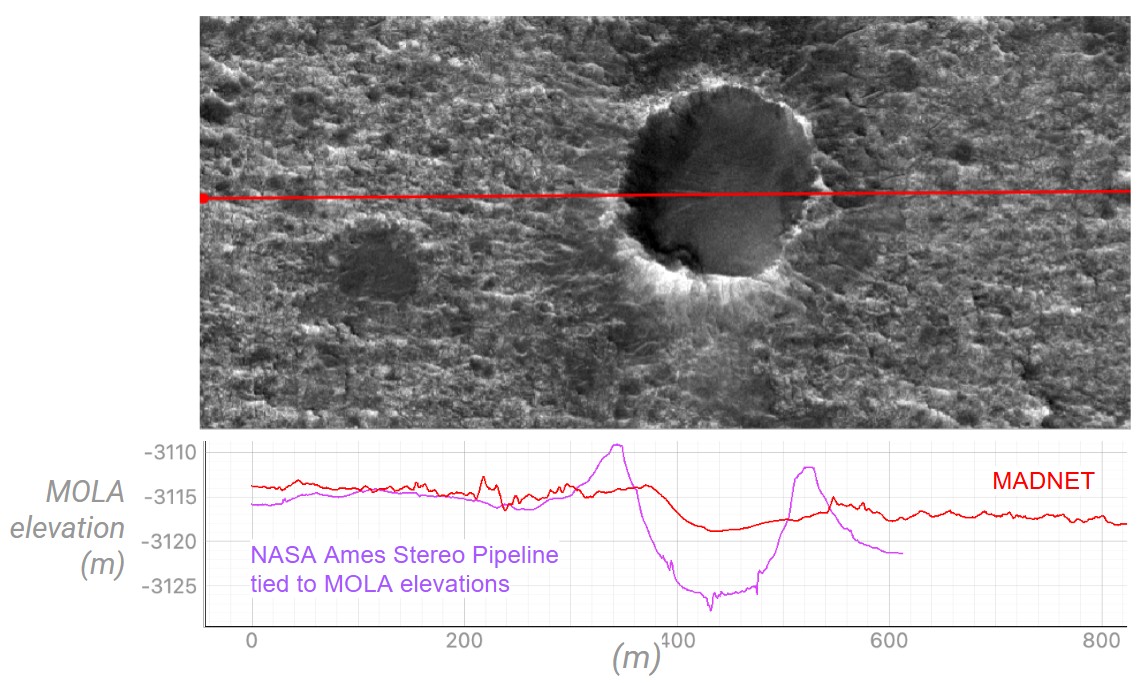
Figure 3: Example DTM quality comparison at a crater near transect 9 (Fig. 2), with the MADNET DTM [7] shown in red and the DTM from Ames Stereo Pipeline [6] shown in purple (this work).
Fracture mapping performed across the broader area shows that the phyllosilicate clays exhibit a higher number (fracture density) and sum length (fracture intensity) of fractures per area, relative to low-clay areas that are also mapped as bedrock units. Preliminary results suggest that this trend is consistent within the ROIs. In the southernmost ROIs which the geologic map does not cover, CTX brightness and CRISM clay signatures are used to identify the clay-rich bedrock groups. We then manually assign unit designations based on comparison with the stratigraphic relationships, fracture characteristics, and geomorphological behavior of the units in mapped regions, leveraging the fracture survey to inform unit extents.
By combining multiple datasets (CTX, CRISM, HiRISE) with different scientific approaches (spectral, fracture, and geomorphological analysis) we provide further context for RFM. Although orbital data only provides information on the surface and limited subsurface exposures, using a combination of geologic approaches allows us to propose realistic subsurface scenarios, critical for mission success in drilling the near subsurface.
Acknowledgements: This work is supported by the ASI-INAF Mars Exploration agreement 2023-3-HH 0 and the European Space Agency (ESA) SKP IDS, F.O.1.05.04.33.13.
References
[1] Mandon L. et al., 2021, Astrobiology, 21(4), 464–480. https://doi.org/10.1089/ast.2020.2292.
[2] Quantin‐Nataf, C., et al., 2021, Astrobiology, 21(3), 345–366. https://doi.org/10.1089/ast.2019.2191.
[3] Brossier, J., et al., 2022, Icarus, 386, 115114. https://doi.org/10.1016/j.icarus.2022.115114.
[4] Vago, J., et al., 2017, Astrobiology, 17(6–7), 471–510. https://doi.org/10.1089/ast.2016.1533
[5] Fawdon, P., et al., 2024, Maps 20 (1), 2302361, https://doi.org/10.1080/17445647.2024.2302361
[6] Beyer, R. A., et al., 2018, Earth and Space Science, 5, 537–548. https://doi.org/10.1029/2018EA000409
[7] Tao, Y., et al., 2021, Remote Sensing, 13(21), 4220, https://doi.org/10.3390/rs13214220
[8] Apuzzo A. et al., 2025, Planetary and Space Science, Volume 267, 2025, 106169, https://doi.org/10.1016/j.pss.2025.106169
[9] Peacock, D., et al., 2026, Earth-Science Reviews, 277, 105461, doi: https://doi.org/10.1016/j.earscirev.2026.105461
How to cite: Rasmussen, M., Altieri, F., Frigeri, A., Brossier, J., Trisic Ponce, J., Saggese, V., and De Sanctis, M. C.: Characterizing clay-rich regions of Oxia Planum, Mars, through geomorphological and fracture analysis, Europlanet Science Congress 2026, The Hague, The Netherlands, 6–11 Sep 2026, EPSC2026-829, https://doi.org/10.5194/epsc2026-829, 2026.
We are conducting a coordinated effort to investigate the sulfate-bearing deposits within Aram and Aureum Chaos where three types of sulfates have previously been identified. Using improved Compact Reconnaissance Imaging Spectrometer for Mars (CRISM) image processing to produce Map-Projected Targeted Reduced Data Record (MTRDR) images, we have mapped out the occurrences of polyhydrated sulfates (PHS), monohydrated sulfates (MHS), and ferric hydroxysulfate outcrops (FHS; Fe3+SO4OH) beyond what was mapped previously. High Resolution Imaging Science Experiment (HiRISE), Context Camera (CTX), High Resolution Science Camera (HRSC), and Colour and Stereo Surface Imaging System (CaSSIS) images were used to map and characterize the morphologies and locations of sulfates within these two chaos regions. We then used these morphologic characteristics for each type of sulfate where CRISM targeted coverage existed to extrapolate the sulfate occurrences within both chaos regions outside of the CRISM images. Digital Terrain Models (DTMs) made from HRSC, HiRISE, and CTX stereo pairs were used to establish stratigraphic relationships between the different sulfates and determine thicknesses of deposits. We also mapped out the distribution of a spectrally bland, crenulated, layered, light-toned caprock unit within both chaos regions because it is found in association with the sulfates.
Our results for both chaos regions reveal that the PHS-rich units are always stratigraphically above the MHS-rich units where they occur together. We found that the PHS unit is typically smooth, darker-toned, and contains several layers of meter-scale thickness forming broad plateaus that are commonly covered by ripples and debris. Steeper cliffs along specific layers within the PHS unit correlate to brighter, jagged, and heavily fractured outcrops. Spectra of the PHS unit have bands near 1.44 and 1.93-1.95 µm and a drop in reflectance near 2.42 µm, similar to spectra of rozenite (Fe²⁺SO₄•4H₂O) and starkeyite (MgSO4•4H2O). In contrast, the MHS is brighter and rougher with scalloped fracturing, and can be either massive or very finely layered, with the finely layered material typically exposed beneath the overlying crenulated caprock. The MHS spectra are consistent with szomolnokite (FeSO4•H2O) and kieserite (MgSO4•H2O). We also detected kieserite in dark-toned talus and eolian ripples adjacent to or mantling MHS outcrops, indicating erosion of the outcrops produces finer-grained kieserite-bearing debris, but why the debris is darker than the outcrops from which it is derived is unknown. Interestingly, some of the brightest and clearest outcrops within both chaos regions had some of the weakest sulfate signatures in CRISM images, suggesting other factors are influencing brightness besides the presence of sulfates. The FHS, which is spectrally characterized by a strong absorption at 2.236 µm, occurs in smaller, patchy outcrops along the lower-lying floors of both chaos regions and it generally appears dark-toned and heavily fractured with ridges sometimes present. The FHS is always adjacent to or directly beneath the MHS, and is also associated with chaos terrain where it typically occurs along the chaos block edges.
Recent laboratory studies indicate that the FHS can only form by heating hydrated ferrous sulfates above 100°C [Bishop et al., 2025]. We find that the FHS is only associated with Mg-bearing MHS, perhaps because the Fe-bearing MHS was transformed to FHS due to heating, leaving behind the Mg-bearing MHS that is now seen from orbit. Moreover, the correlation between upturned and tilted chaos blocks and FHS is consistent with heating in the subsurface that caused conversion of the MHS to FHS, as well as the tectonic disruption that created and uplifted the chaos blocks. The geothermal heating could have arisen from intrusion of magma that never reached the surface but caused heating along the chaos floors due to their deeper depths. We did not find any FHS within Iani Chaos even though there are MHS in Iani that are much closer to Aram than those at Aureum. These observations suggest the subsurface heat source extended from Aram to the southwest where it reached northeastern Aureum rather than towards the southeast to reach Iani. Alternatively, heating could have reached portions of northwestern Iani Chaos but there were no hydrated ferrous sulfates present for conversion to FHS. Deposition of the sulfates within these chaos regions occurred in the Late Hesperian to Early Amazonian, implying the magmatic heating event that altered the MHS to FHS also took place relatively recently in martian history (<3 billion years ago).
References:
Bishop, J.L., Meusburger, J.M., Weitz, C.M. et al. Characterization of ferric hydroxysulfate on Mars and implications of the geochemical environment supporting its formation. Nat Commun 16, 7020 (2025). https://doi.org/10.1038/s41467-025-61801-2
How to cite: Weitz, C., Bishop, J., and Sheppard, R.: A Geologic Study of Three Types of Sulfates within Aram and Aureum Chaos, Mars, Europlanet Science Congress 2026, The Hague, The Netherlands, 6–11 Sep 2026, EPSC2026-277, https://doi.org/10.5194/epsc2026-277, 2026.
Hydrated sulfate minerals on Mars are of critical importance to understand the ancient climates of the planet, as they can form through multiple processes involving water-rock interaction. Particularly, they can form as evaporitic deposits [1], when bodies of liquid water containing dissolved salts slowly evaporate, transitioning to brine-like environments and finally leaving behind the crystallized salts they once contained. This makes them ideal to trace ancient aqueous environments. These salts have been detected in several places on Mars [2,3,4], but are not as widespread as initially expected. Additionally, they are rarely seen alongside the other phases they have been modelled to form alteration sequences with, namely the clay minerals dominating the Southern Noachian terrains [5]. This could be explained by some geological processes, but also by incomplete detections and/or observational biases.
To identify mono- and poly-hydrated sulfates (MHS and PHS respectively), one technique available both orbitally and in-situ is Visible and Near-Infrared (VISIR) reflectance spectroscopy. But even though hydrated sulfate minerals present distinctive spectral signatures, their identification is rarely straightforward. Indeed, other families of alteration minerals also detected on Mars [2,3,4] (such as phyllosilicates, carbonates, amorphous hydrated silica, …) bear spectral signatures in the wavelength ranges available in current Martian data (typically from 1.3 to 2.6 µm) [6,7] that can overlap with sulfate spectral features. This problem becomes exacerbated in the case of mineral mixtures, where spectral contributions from several phases make clear identification challenging [8,9]. Other studies have come up with spectral parameters capable of detecting hydrated sulfates [10], and while they can work well in some conditions, they can also mix them up with other mineralogical families.
Here, we develop a new suite of spectral parameters capable of confidently identifying MHS and PHS using VISIR data. The objective is to automatically detect hydrated sulfate-bearing outcrops with minimal ambiguity, even when mixed with other phases. To do so, we base our study on 2 key absorption features in hydrated sulfate spectra: (1) an important drop in reflectance near 2.4 µm (S-O overtone) [11], present in other hydrated minerals but usually weaker in intensity; and (2) for most sulfates, a spectral plateau lacking any absorption feature in the 2.2-2.3 µm range. Features in that range may be linked to combinations/overtones of Al-, Fe- and Mg-OH for phyllosilicates [12], Si-OH for hydrated silica [13], and C-O for carbonate [12]. Exceptions to this second rule are some Ca-sulfates, which do present a large triple absorption between 2.1 and 2.3 µm (S-O or OH/H2O combinations/overtones) [11].
We begin by investigating the 2.4 µm drop slope of sulfates in contrast to the slope of their 2.2-2.3 µm plateau. To avoid contributions from absorption bands when computing the slopes, we use the upper part of a convex hull from 2.05 to 2.40 µm to represent the spectrum as if no absorptions features were present there. From this convex hull, we compute two slopes, one between 2.22 and 2.24 µm (“Plateau slope”, green line on Figure 1), and the other between 2.36 and 2.39 µm (“Drop slope”, blue line on Figure 1). We then subtract the drop slope to the plateau slope, obtaining our first parameter named “DIFFSLOPE”. We correlate this value to the depth of a potential absorption band in the 2.2-2.3 µm range, lacking for most sulfate species. For this, we divide our original spectrum by the same convex hull, and measure the depth of an eventual feature as our second parameter (“Band depth”, red dotted line on Figure 1).
These parameters are applied on lab spectra, and preliminary results are shown in Figure 2. Gypsum and anhydrite (blue circle) plot higher than other sulfates (green circle), due to their absorption in the 2.2-2.3 µm range. However, because of their strong drop slope, they still plot away from other hydrated phases. Overall, we obtain a clear separation between sulfates and other hydrated minerals, which is a promising first step before applying this method to Mars data.
We then plan to apply our method to the VISIR data from the SuperCam [14,15] instrument onboard the Perseverance rover. By combining improved VISIR spectral parameters and results from SuperCam’s other analytical techniques (mainly LIBS and Raman), we aim to revisit the in-situ detections of hydrated sulfates in Jezero crater [16], in order to better understand the aqueous history of the site.
Aknowledgments: This work is supported by the ERC OCEANID project (Grant agreement ID: 101045260) funded by the Horizon programme from the European Research Council.
References: [1]Bąbel and Schreiber (2014), Elsevier, [2]Murchie et al. (2009), J. Geophys. Res., [3]Carter et al. (2013), J. Geophys. Res., [4]Ehlmann and Edwards (2014), Annu. Rev. Earth Planet. Sci., [5]Milliken et al. (2009), Geophys. Res. Lett., [6]Cloutis et al. (2008), Icarus, [7]Poitras et al. (2018), Icarus, [8]Stack and Milliken (2015), Icarus, [9]Baschetti et al. (2026), Icarus, [10]Viviano-Beck et al. (2014), JGR Planets, [11]Cloutis et al. (2006), Icarus, [12]Clark et al. (1990), J. Geophys. Res., [13]Goryniuk et al. (2004), Geophys. Res. Lett, [14]Wiens et al. (2020), Space Sci. Rev., [15]Maurice et al. (2021), Space Sci. Rev., [16]Mandon et al. (2023), JGR Planets.
Figure 1 : Illustration of parameters computed in this study on example gypsum and epsomite lab spectra.
Figure 2 : Scatter plot representing the 2 parameters mentionned in the text against each other, for different mineralogical families.
How to cite: Tricaud, V., Dehouck, E., Carter, J., Pineau, M., Clavé, E., and Quantin-Nataf, C.: Towards new methods for identifying hydrated sulfates on Mars using Visible-Infrared (VISIR) spectroscopy, Europlanet Science Congress 2026, The Hague, The Netherlands, 6–11 Sep 2026, EPSC2026-330, https://doi.org/10.5194/epsc2026-330, 2026.
The Perseverance rover landed in Jezero Crater in February 2021 as part of the Mars 2020 mission, with objectives that include geological characterization of the landing site, detection of potential biosignatures, and collection of samples for future return to Earth [1,2]. To achieve these goals, the SuperCam instrument has been extensively used, integrating Laser-Induced Breakdown Spectroscopy (LIBS) among other spectroscopic and imaging techniques to investigate the elemental, geochemical, and mineralogical composition of the Martian surface [3]. The reliability of LIBS measurements is ensured by an onboard calibration system comprising multiple reference targets [4].
Since the rover began its traverse on Mars, its scientific exploration has been organized into a series of Scientific Campaigns analyzing distinct geological units within Jezero Crater. The first campaign, the Crater Floor Campaign, focused on the Máaz, Artuby, Content, and Séítah formations. It was followed by the Rapid Traverse Campaign, whose primary objective was to reach the Delta region, resulting in limited scientific measurements. The third campaign, the Delta Front Campaign, and the fourth, the Delta Top Campaign, provided detailed investigations of the deltaic deposits. Subsequently, the Margin Unit Campaign distinguished between the Western and Eastern Margin Unit formations, with a focus on carbonate-bearing lithologies. The most recent phase corresponds to the Crater Rim Campaign, which is currently ongoing and targets the rim structures of Jezero Crater.
In this study, LIBS data collected by the SuperCam instrument during the first five scientific campaigns (until Sol 1280) were analyzed using Principal Component Analysis (PCA), to develop a model that can serve as a basis for comparing and predicting the composition of new targets from other geological formations investigated by the rover.
The full LIBS spectra measured by the Perseverance rover from the Máaz, Artuby, Content, Séítah, Delta Front, Delta Top, Eastern Margin Unit, and Western Margin Unit regions were used. Only targets measured on rocks or floats were selected, while those acquired on regolith or heavily dust-covered rocks were excluded to avoid misinterpretations, since regolith material can be transported across different regions of Mars by wind activity. For each target, the median LIBS spectrum was computed, followed by Norm-2 normalization and mean-centering. The PCA model was then developed using the PLS_Toolbox (Eigenvector Research, WA, USA) working under Matlab environment (The Mathworks, MA, USA).
The resulting PCA was robust and effectively captured compositional differences among the geological formations. The PCA results reveal clear geochemical differences among the Martian formations. Séítah is characterized by higher Mg contents and local olivine enrichment, while Máaz is enriched in Si, Fe, Al, and alkali elements, consistent with a feldspar- and pyroxene-rich composition. Artuby shows intermediate compositions between Séítah and Máaz formations and Content has a similar composition than Máaz. In contrast, Delta Front, Delta Top, Eastern Margin Unit and Western Margin Unit exhibit more homogeneous signatures dominated by Fe- and Mg-rich phases.
In conclusion, PCA based solely on LIBS spectra provides a rapid and robust framework for comparing and interpreting the mineralogical composition of new targets, enabling their integration into existing compositional models even when other SuperCam datasets are unavailable or incomplete. Furthermore, this approach facilitates the comparison of geological compositions across different formations within a consistent multivariate framework.
References
[1] Mars 2020: Perseverance Rover, (n.d.). https://science.nasa.gov/mission/mars-2020-perseverance/ (accessed April 27, 2026).
[2] K.A. Farley, K.H. Williford, K.M. Stack, R. Bhartia, A. Chen, M. de la Torre, K. Hand, Y. Goreva, C.D.K. Herd, R. Hueso, Y. Liu, J.N. Maki, G. Martinez, R.C. Moeller, A. Nelessen, C.E. Newman, D. Nunes, A. Ponce, N. Spanovich, P.A. Willis, L.W. Beegle, J.F. Bell, A.J. Brown, S.-E. Hamran, J.A. Hurowitz, S. Maurice, D.A. Paige, J.A. Rodriguez-Manfredi, M. Schulte, R.C. Wiens, Mars 2020 Mission Overview, Space Sci Rev 216 (2020) 142. https://doi.org/10.1007/s11214-020-00762-y.
[3] S. Maurice et al., The SuperCam Instrument Suite on the Mars 2020 Rover: Science Objectives and Mast-Unit Description, Space Sci Rev 217 (2021) 47. https://doi.org/10.1007/s11214-021-00807-w.
[4] A. Cousin, V. Sautter, C. Fabre, G. Dromart, G. Montagnac, C. Drouet, P.Y. Meslin, O. Gasnault, O. Beyssac, S. Bernard, E. Cloutis, O. Forni, P. Beck, T. Fouchet, J.R. Johnson, J. Lasue, A.M. Ollila, P. De Parseval, S. Gouy, B. Caron, J.M. Madariaga, G. Arana, M.B. Madsen, J. Laserna, J. Moros, J.A. Manrique, G. Lopez-Reyes, F. Rull, S. Maurice, R.C. Wiens, SuperCam calibration targets on board the perseverance rover: Fabrication and quantitative characterization, Spectrochim Acta Part B At Spectrosc 188 (2022) 106341. https://doi.org/10.1016/J.SAB.2021.106341.
Acknowledgements
We are grateful to the many engineers and scientists who have supported the Perseverance mission. We acknowledge the support of Spanish Agency for Research (AEI), NASA’s Mars Exploration Program, CNES, CNRS and other supporting organizations. SuperCam data are archived in the PDS. This work is supported by the PAMMAT project “Alteration processes in Mars and Moon Meteorites, and Terrestrial Analogues at different environments: Mars2020, Rosalind Franklin and Returned Samples from Mars and Moon” (Grant No. PID2022-142750OB-I00), funded by the Spanish Agency for Research (through the Spanish Ministry of Science and Innovation, MCIN, and the European Regional Development Fund, FEDER, MCIN/AEI/10.13039/501100011033/FEDER,UE), the Strategic Project “Study of Alteration Processes in Terrestrial and Planetary Materials” (Grant No. UPV/EHU PES21/88), funded by the UPV/EHU, and the Italian Space Agency (ASI) through the ASI/INAF agreement no. 2025-12-HH.0.
How to cite: Coloma, L. and the SuperCam team: PCA-based modeling of SuperCam LIBS data for comparing geological composition across Martian formations, Europlanet Science Congress 2026, The Hague, The Netherlands, 6–11 Sep 2026, EPSC2026-1027, https://doi.org/10.5194/epsc2026-1027, 2026.
Introduction: Martian regolith [1] is constituted with different mineral phases of various grain sizes that could originate from local, regional or global sources [2,3]. It corresponds to the ultimate stage of various erosion and weathering processes. Dust (<3microns) also constitutes the regolith and comes from a more global source. Understanding the different mineralogies with their associated grain sizes and shapes can help investigate the past conditions, as the regolith can record different aqueous alteration processes that Mars’ surface has undergone. This is also useful to decipher the different sources, from local to more regional or global, and therefore understand better the different physical processes forming the soils. Last, the study of the regolith can also help constrain some modern processes, such as the exchange between the surface and the atmosphere.
The MSL/Curiosity rover has been exploring Gale crater since 2012 [4], investigating first the crater floor (Aeolis Palus) and now climbing the central sedimentary mound, informally named Mount Sharp. Its traverse is documenting the climate evolution of early Mars. Indeed, the lower section of Mt Sharp stratigraphy corresponds mainly to ancient aqueous deposits, with abundant smectite signatures, whereas higher strata are dominated by sulfate-bearing rocks, representing a major environmental transition, probably with wet-dry cycles [5]. The SAM and CheMin instruments have analyzed a sieved regolith sampled (<150 microns), showing that the regolith was principally composed of primary igneous phases (40.8 wt% plagioclase, 22.4 wt% olivine, 14.6 wt% augite and 13.8 wt% pigeonite), along with some secondary phases (<10 %, no claysx) and around 30% of X-ray amorphous materials [6,7]. The ChemCam instrument also analyzed some regolith recurrently along the traverse. [8,9] have shown that the coarser grains (>500 microns) were felsic in composition and likely derived from the felsic rocks encountered early in the traverse. The active dunes were also slightly different in composition compared to the regolith, being depleted in the finest particles and in volatile elements [10,11]. [12] investigated the fine-grained regolith (<500 microns) during the first 200 sols of the traverse by ChemCam and found that the main carrier of the hydration in the regolith was related to the presence of Mg-rich sulfates in the amorphous component, probably derived from the weathering of olivine in water-limited acidic conditions.
The objective of this study is to better understand the volatile-element sources in the fine-grained regolith. In particular, we would like to explore the hypothesis that the amorphous sulfates found in Gale soils are derived from local inputs, more specifically the sulfate unit of Mt Sharp. Now that Curiosity has reached this unit, we would expect a higher abundance of sulfates in the regolith if the hypothesis is correct. On the other hand, we would like to explore the possible source of H and Cl in the fine-grained regolith at Jezero.
Method: ChemCam [13,14] uses the LIBS technique to retrieve the chemical composition of major elements and of some minor elements [15].
Results: The S signal has been monitored along the Curiosity traverse in the fine-grained regolith (<500 microns) analyzed by ChemCam up to sol 4160. One important thing to note is that most of the fine-grained regolith has been acquired with ChemCam during the first 60 meters of elevation, which correspond to the first 5 km of drive distance, in Aeolis Palus. Figure 1 shows some gaps in the data, with several intervals in the stratigraphy without any fine-grained regolith observations, such as between -4405 and -4285m. This is probably related to an observation bias.
Starting at elevation > -3845m, the median of the S signal is systematically higher than that found during the beginning of the traverse, in Aeolis Palus (the average of this region is shown with the red dashed line). Not only is the median overall higher, but the third quartile of the distribution is also overall higher than previous locations encountered. Moreover, the highest detections within the Mount Sharp observations do not correspond to outliers (but are included in the 3rd quartile), in contrast to the Aeolis Palus and the VRR and Glen Torridon observations (around -4185 to -4085m).
Discussion: These preliminary results suggest that there is a slight enrichment in sulfur in the fine-grained regolith that have been analyzed in the Mount Sharp terrains compared to those analyzed in Aeolis Palus, VRR or Glen Torridon. Sulfur (along with Cl and H) in soils is mostly carried by the finest particles, as seen in Bagnold Dunes observations [11]. These finest particles are known to be transported by wind and therefore are considered to represent a global component. However, the bedrock encountered in the sulfate-bearing unit are fine-grained [29] and therefore their erosion would generate fine-grained particles more easily, that could contribute directly to the formation of local soils, which can explain the enrichment in the regolith in this unit. This would explain the difference of the S signal between the Gale and Jezero regoliths.
More work needs to be done with the ChemCam data, such as also investigating the H signal and the trends of major elements in regolith along the traverse, in order to understand if this increase in S is correlated to the presence of Mg sulfates in the bedrock, or even to search for mixtures of Mg-Na sulfates as found by [30] in some bedrock.
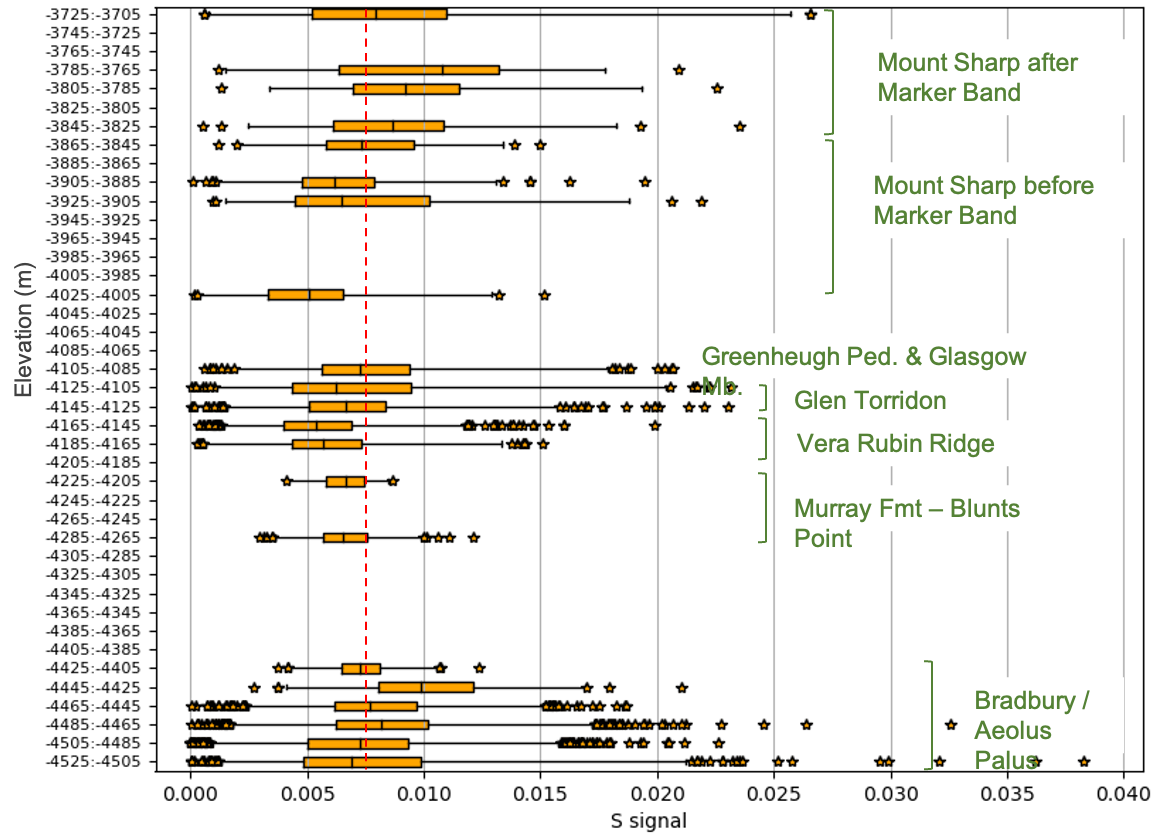
Figure 1: Boxplot representing the S signal in fine-grained ChemCam regolith as a function of the rover elevation (binned every 20m). Outliers are represented as stars. Red dashed line represents the average Aeolis Palus S signal.
[1] Certini et al., (2020) [2] McSween et al., (2010) [3] Yen et al., (2005) [4] Vasavada et al., Space Sci. Rev. 218 (2022) [5] Rapin et al., (2023) [6] Blake et al., (2013) [7] Rampe et al., (2018) [8] Meslin et al., (2013) [9] Cousin et al., (2015) [10] Cousin et al., (2017) [11] Ehlmann et al., (2017) [12] David et al ,(2022) [13] Maurice et al., (2012) [14] Wiens et al., (2012) [15] Clegg et al., 2017)) [16] Rudolph et al., (2024) [17] Hughes et al, (2024).
How to cite: Cousin, A., Rapin, W., Meslin, P.-Y., Dehouck, E., Forni, O., David, G., Pilleri, P., Wiens, R. C., and Gasnault, O.: Investigation of the sources of volatile elements in fine-grained regolith on Mars , Europlanet Science Congress 2026, The Hague, The Netherlands, 6–11 Sep 2026, EPSC2026-99, https://doi.org/10.5194/epsc2026-99, 2026.
Please decide on your access
Please use the buttons below to download the supplementary material or to visit the external website where the presentation is linked. Regarding the external link, please note that Copernicus Meetings cannot accept any liability for the content and the website you will visit.
Forward to presentation link
You are going to open an external link to the presentation as indicated by the authors. Copernicus Meetings cannot accept any liability for the content and the website you will visit.
We are sorry, but presentations are only available for users who registered for the conference. Thank you.
Seasonal CO₂ jet activity is one of the most dynamic surface processes currently observed on Mars [1, 2, 3, 4]. During spring, a solid-state greenhouse effect occurs due to the translucent seasonal CO₂ ice and generates pressurized gas pockets beneath the ice layer. This eventually leads to jet-like eruptions that transport dust and regolith from the substrate onto the ice surface. These events produce characteristic dark fans and blotches observed in high-resolution imagery. Their morphology and evolution provide direct information about near-surface winds, ice properties, and present-day surface–atmosphere interactions.
Repeated observations by HiRISE (High Resolution Imaging Science Experiment) onboard the Mars Reconnaissance Orbiter [5] have documented seasonal activity across large parts of the south polar regions over ten Mars years, from MY28 to MY38. The Planet Four citizen-science project was set up to outline dark seasonal deposits and has produced a large catalog of manually identified fans and blotches within selected regions of interest (ROIs). This dataset enabled the first statistical analyses of seasonal activity [6, 7], including studies of seasonal timing, regional distributions, and interannual variability [8]. However, existing analyses remain incomplete because a) they are limited to selected ROIs, b) rely on the narrow central color swath of HiRISE images, and c) do not cover the most recent years of HiRISE observations. As a result, the large-scale distribution and variability of seasonal activity across the south polar region remain poorly constrained.
This work focusses on the first application of machine learning (ML) techniques to the full record of seasonal HiRISE observations of these dark fans and blotches. Expanding on a baseline study [9] for automatic feature detection for citizen-science labelled data in selected regions for two MY, ML models are being trained and validated using the existing Planet Four catalog and will then be applied to all relevant HiRISE observations in the southern polar regions, including the full red-channel width as well as images outside of the current Planet Four ROIs. The resulting dataset will provide large-scale fan and blotch distributions over the full extent of HiRISE observations. This expanded activity catalog will be used to address several key scientific questions. First, the project will investigate how seasonal activity is distributed across the south polar cap and whether currently-known active regions are representative of broader seasonal processes. Second, repeated observations will be used to determine whether CO₂ jet activity recurs at stable locations over time, potentially implicating persistent local conditions. Third, the project will examine the interannual variability of activity patterns and fan orientations and compare these observations with atmospheric circulation predicted by higher-resolution atmospheric models (expanding the study in [7] to additional years and locations). Fan orientations derived from machine-learning detections will be used as proxies for near-surface winds and compared with modeled wind fields to assess the relationship between observed activity and atmospheric dynamics.
Fig 1. Example comparison of detection of fans and blotches by Planet Four citizen science project (on the left) and ML model YOLO11 trained on Planet Four labeled dataset [10] (on the right).
References:
[1] Kieffer, H. H. 2007, Journal of Geophysical Research, 112, E08005
[2] Hansen, C. J., Thomas, N., Portyankina, G., et al. 2010, Icarus 205, 283
[3] Thomas, N., Pommerol, A., Hauber, E., Portyankina. G. et al. 2025, SSR 221, 3
[4] Hansen, C. J., Byrne, S., Calvin, W. M. et al. 2024, Icarus 419, 115801
[5] McEwen, A. S., Byrne, S., Hansen, C. J. et al. 2024, Icarus 419, 115795
[6] Aye, K. M., Schwamb, M. E., Portyankina, G., et al. 2019, Icarus, 319, 558
[7] Portyankina, G., Michaels, T. I., Aye, K.-M., et al. 2022, Planetary Science Journal, 3, 31
[8] Hansen, C. J., Aye, K.-M., et al. 2023, LPI Contribution No. 2806, id.2315
[9] McDonnell, M. D., Jones, E., Schwamb, M. E., et al. 2023, Icarus, 391, 115308
[10] Jocher, G. and Qiu, J., 2024, https://github.com/ultralytics/ultralytics
How to cite: Portyankina, G., Aye, K.-M., Marktstein, T., Fitoz, B., Pelivan, I., Schwamb, M., and Michaels, T.: Extending Planet Four: machine learning applied to seasonal CO2 jet activity on Mars, Europlanet Science Congress 2026, The Hague, The Netherlands, 6–11 Sep 2026, EPSC2026-904, https://doi.org/10.5194/epsc2026-904, 2026.
The volcanic complex Tharsis Region on Mars is known for its numerous volcanoes on top of the crust, elevated topography (doming), and a long-wavelength gravity anomaly correlated with the region. Flexural modeling of the lithosphere has commonly been used to understand the relationship between observed topography, crustal structure, and gravity, but no conclusive answers have been obtained due to the ambiguity of these models. NASA’s InSight mission has brought new information about the Martian lithosphere, which warrants a reanalysis of the support of the Tharsis Region.
Analyzing the topography and gravity data, we found that a thin shell model of can model the lithosphere of Mars that matches both the observed gravity field for spherical harmonic degrees higher than 8 and the crustal thickness at Elysium determined by the InSight mission. Our thin shell flexure model predicts an average crustal thickness of 55 km, crustal density of 3050 kg/m3, average mantle density of 3750 kg/m3, and an elastic thickness (Te) of 100 km.
The remaining mismatch between modeled and observed gravity field for the long-wavelengths (between n=2-8 degrees) correlates with the Tharsis Region, suggesting active large-scale dynamic support of the volcanic region. We devise a fast, parameterised modelling approach to calculate the mantle flow and resulting gravity effect of such a mass anomaly. We have explored the multi-variable parameters space and run approximately 500.000 models in which we compare to the geophysical parameters.The optimal models show that there is a substantial negative mass anomaly (hot buoyant mantle material) in the mid mantle underneath the Tharsis Rise. The anomaly seems to have a flat disk shape, with a flatness of 0.2 (thickness over radius). Due to the ambiguity of the gravity data, we computed different sets of depth, size, and anomalous mass (all lighter density) for the mass anomaly underneath Mars.
We used remaining short-scale gravity residuals to derive an 3D Martian crustal density distribution. We are currently correlating these density distribution with geological events in Mars histiory. Buried mass anomalies in the subsurface of the northern polar plains seem not to be related to any geological or surface expressions, suggesting a more complex geology of the northern Martian crust than is suggested by the surface topography.
How to cite: Root, B., Qin, W., van der Tang, Y., and Thieulot, C.: Describing the Martian gravity field through lithospheric flexure and deep mantle flow modelling, Europlanet Science Congress 2026, The Hague, The Netherlands, 6–11 Sep 2026, EPSC2026-827, https://doi.org/10.5194/epsc2026-827, 2026.
Please decide on your access
Please use the buttons below to download the supplementary material or to visit the external website where the presentation is linked. Regarding the external link, please note that Copernicus Meetings cannot accept any liability for the content and the website you will visit.
Forward to presentation link
You are going to open an external link to the presentation as indicated by the authors. Copernicus Meetings cannot accept any liability for the content and the website you will visit.
We are sorry, but presentations are only available for users who registered for the conference. Thank you.
In situ measurements of atmospheric CH₄ taken by the Curiosity rover in Gale Crater revealed strong seasonal variations in background gas levels (Webster et al. 2018, 2021). Endogenous CH₄ could have been stored in the past in subsurface reservoirs in the form of clathrate hydrates (Prieto-Ballesteros et al. 2006; Chastain and Chevrier 2007; Oehler and Etiope 2017), and remain partially stable in the present-day cryosphere (Gloesener et al. 2021).
The stability of clathrates—including their thermodynamic properties and their formation-dissociation kinetics—depends not only on pressure and temperature conditions, but also on the presence of other compounds with which they coexist to form a mineral association, and with which they could interact physically and chemically. Thus, in this research we have reviewed the mineralogy of the Gale Crater subsurface—i.e., the region where clathrates could coexist with other mineral phases—in order to study the stability of CH4 clathrates in such associations.
Data from missions to that region suggest that Gale Crater may once have been home to an ancient lake. The crater formed between the late Noachian and early Hesperian periods, while the subsequent formation of the sedimentary strata (composed of clay minerals and sulfate layers) occurred during the Hesperian period (Thomson et al. 2011; Palucis et al. 2014; Grant et al. 2014; Grotzinger et al. 2015). Furthermore, a wide variety of sedimentary layers have been revealed on Mount Sharp that record multiple episodes of ancient aqueous alteration processes (e.g., Achilles et al. 2020), including groundwater activity (Thorpe et al. 2022). In particular, a coexistence of clay minerals and sulfates was found in large quantities in several drill samples collected in the Murray Formation (Bristow et al. 2018) and in the Glen Torridon area (Thorpe et al. 2022).
Based on these premises, we experimentally studied the kinetics of CH₄ clathrate formation and dissociation, at pressures up to 100 bar, in the presence of MgSO₄ brines and two clay minerals—a montmorillonite (2:1 type) and a kaolinite (1:1 type)—using high-pressure differential scanning calorimetry (DSC). The results showed that the presence of both sulfates and clay minerals can favor the induction time of clathrate formation, but considerably reduces the final stabilized amount. The salting-out effect caused by the salts and the water strongly bound to the clay surfaces are the main factors that inhibit clathrate growth. These results have important implications for the assessment of potential CH₄ sources in Gale, as the experiments demonstrate the inhibition of clathrate formation within the mineral assemblages found in the crater.
References: Achilles et al. 2020, J. Geophys. Res. Planets, 125, e2019JE006295; Bristow et al. 2018, Sci. Adv., 4, eaar3330; Chastain and Chevrier 2007, Planet. Space Sci., 55, 1246 ; Gloesener et al. 2021, Icarus, 353, 114099 ; Grant et al. 2014, Geophys. Res. Lett., 41, 1142 ; Grotzinger et al. 2015, Science, 350, aac7575 ; Oehler and Etiope 2017, Astrobiology, 17, 1233 ; Palucis et al. 2014, J. Geophys. Res. Planets, 119, 705 ; Prieto-Ballesteros et al. 2006, Geology, 34, 149 ; Thomson et al. 2011, Icarus, 214, 413 ; Thorpe et al. 2022, J. Geophys. Res. Planets, 127, e2021JE007099 ; Webster et al. 2018, Science, 360, 1093 ; Webster et al. 2021, A&A, 650, A166
Acknowledgements: The authors acknowledge support from the MCIN/AEI/ http://doi.org/10.13039/501100011033 projects PID2022-142490OB-C31, and PCI2023-145992-2, the SOS-Mars project (PID2020-119412RJ-I00) from MICINN Spain, the Marie Curie Postdoctoral Fellowship program (HORIZON-MSCA-2022-PF-01), grant nº 101105979 – SECRECY; and the RYC2024-050522-I grant, funded by MICIU/AEI/10.13039/501100011033 and the ESF+. Part of this work has been conducted at the Jet Propulsion Laboratory, California Institute of Technology, under a contract with the National Aeronautics and Space Administration.
How to cite: Muñoz-Iglesias, V., Gloesener, E., Gil-Lozano, C., Choukroun, M., Prieto-Ballesteros, O., Ercilla Herrero, O., Fernández-Sampedro, M., García Baonza, V., and Tobie, G.: Could CH4 clathrates have formed in the subsurface of Gale Crater?, Europlanet Science Congress 2026, The Hague, The Netherlands, 6–11 Sep 2026, EPSC2026-342, https://doi.org/10.5194/epsc2026-342, 2026.
Introduction:
Outflow channels are the largest erosive structures on Mars [1,2,3,4]. Their formation postdates that of most valley networks, at the Hesperian-Amazonian transition circa 3 Ga. This period is marked by the end of the milder, perhaps habitable conditions that had characterized Mars' climate to this point [1,2]. Understanding the formation of the outflow channels is key to investigate the nature and duration of this climate collapse.
Previous interpretations of Kasei Valles formation (Figure 1) part from observations of its scale, morphology, and location [2,4,5]. They infer that it was incised by cataclysmic outburst floods sourced from the collapse of vast subsurface aquifers, based on terrestrial analogues [5,2]. However, this hypothesis suffers from unrealistic discharges and the impossibility to replenish aquifers in the Amazonian [6,7]. Moreover, landforms such as potential eskers [8,9], lava terraces, or basal grooves suggest that other processes such as glacier sliding [10,3] or lava flows may have played a major role in the formation of Kasei Valles.
Here we test the hypothesis that Kasei Valles was eroded by lava [6,7], leaving the test for ice or megafloods for further work. To make progress, we compared the Length-to-Width ratios (L/W) of streamlined islands within Kasei Valles to a lava channel, Olympica 1b, sourced from Olympica Fossae (Figure 1C) [11]. Our findings yield a gradient of L/W ratios in Kasei Valles that indicate a changing of behavior of the erosive agent inconsistent with lava flow.
Methods:
Previous studies characterized island streamlining by measuring their L/W ratios using island contour lines [11]. Here we followed the same approach using MOLA-HRSC DEM (200 m/px) and CTX images (6 m/px) to define contours, calculated in ArcPro ('Contours' tool), employing an equidistant cylindrical projection centered on 35.0°N, 70.0°W.
We computed L/W ratios using the Minimum Bounding Rectangle tool in ArcPro to obtain 407 streamlined islands within Kasei. To ground truth our methodology, and to provide a quantitative test for the lava hypothesis, we compared the ratio statistics and distribution with those in Olympica 1b [11]. Specifically, we looked at the L/W histograms and evaluated the gradient in L/W values moving downflow within both canyons.
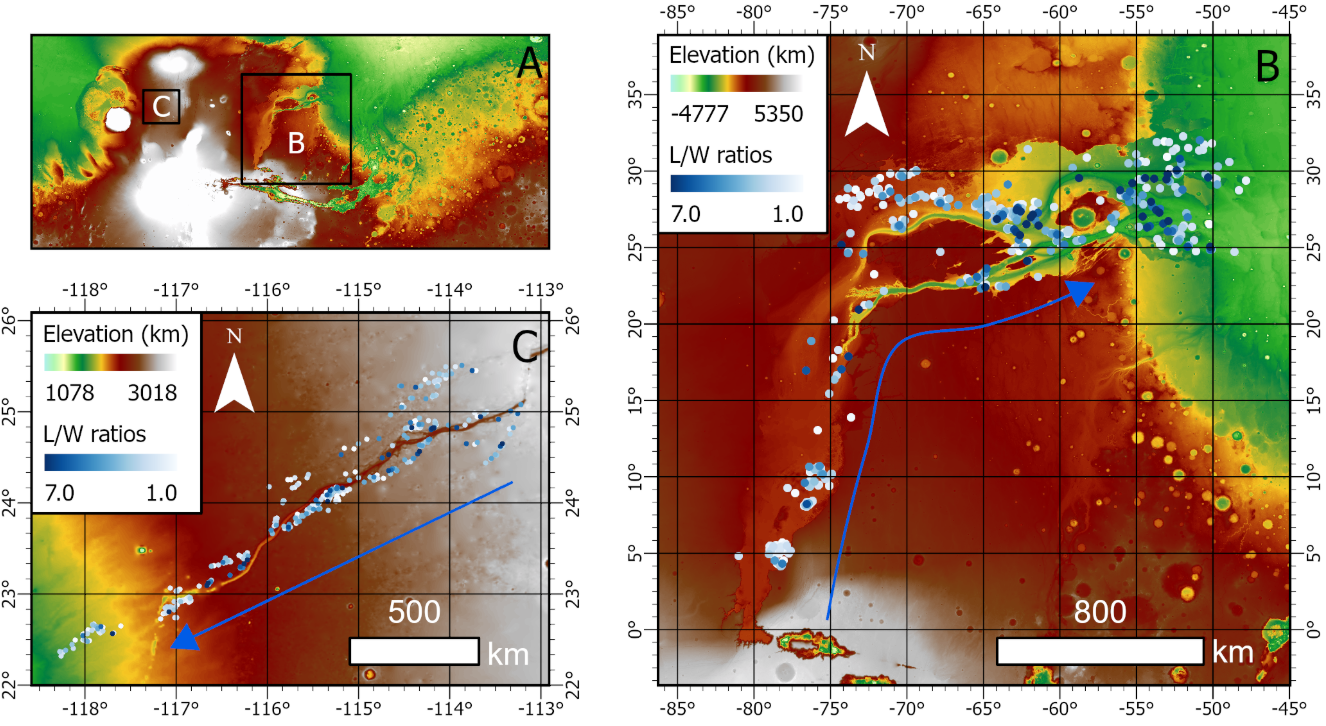 FIGURE 1 – (A) MOLA-HRSC DEM showing Kasei Valles and Olympica 1b. (B) Map of Kasei Valles displaying the elevation and Length-to-Width ratios. The flow direction is indicated by the blue arrow. (C) Map of Olympica lava channel with elevation and Length-to-Width ratios. The flow direction is indicated by the blue arrow.
Results and Discussion
The analysis at Kasei Valles focused on evaluating the L/W ratios of streamlined islands as a distribution and in relationship with other parameters, including length along valley, type of obstacle (crater vs. outcrop), and island area. The L/W ratios mapped in Kasei Valles (Figure 1B) range from 1.0 to 7.0 and display a gradient that increases downflow. Within Olympica 1b (Figure 1C) we found an average L/W ratio of 3.10 over 386 islands which is consistent with [11], who reported an average L/W ratio of 3.09 over 468 streamlined forms.
We observed that the Olympica 1b islands display a gradient in L/W ratios that decreases downflow. This decrease in L/W ratios appears coherent with lava intrinsic properties: the lava viscosity increases as the fluid temperature drops downflow, resulting in a decrease in Reynolds number and a shortening of the streamlined islands [5].
Our results on streamlined island L/W ratios for Kasei Valles indicate that the opposite trend was true with a statistical tendency to streamlined island lengthening towards the terminus of Kasei Valles, hinting at downflow acceleration. Moreover, the presence of very elongated streamlined island at the beginning of Kasei and poorly elongated ones at the end suggests that multiple events occurred.
Conclusions:
The origin of Kasei Valles is key to understand the shift in climatic conditions that took place at the end of Mars' Hesperian period. In this study we implement a novel approach based on the principle that drag minimization sets the equilibrium shape of streamlined forms to interrogate the morphometry and evolution of streamlined islands within Kasei Valles, focusing on the test of the lava flow origin hypothesis by considering the evolution of the inner islands L/W ratios along the valley.
Our results yield a L/W ratios gradient in contradiction with the lava hypothesis. Our observations indicate that the gradient is not due to the islands properties but rather a consequence of changes in fluid dynamics which derived from a flow acceleration downstream. This quantitative study paves the way for the use of computational fluid dynamics applied to the observed geomorphology to better constrain the origin of Kasei Valles.
Acknowledgments:
This project has received funding from the European Research Council (ERC) under the European Union’s Horizon Europe research and innovation programme (Grant agreement No. 101165197 ICEFLOODS).
References:
[1] Turbet, M., Forget, F., Head, J. W., and Wordsworth, R. (2017). Icarus, 288, pp. 10–36. [2] Baker, V. R. (2001). Nature, 412(6843), pp. 228–236. [3] Lucchitta, B. K. (1982). Journal of Geophysical Research: Solid Earth, 87(B12), pp. 9951–9973. [4] Baker, V. R., and Milton, D. J. (1974). Icarus, 23(1), pp. 27–41. [5] Komar, P. (1983). Geology, 11, pp. 1–10. [6] Leverington, D. W. (2011). Geomorphology, 132(3), pp. 51–75. [7] Leverington, D. W. (2004). Journal of Geophysical Research: Planets, 109(E10). [8] Chapman, M. G., Neukum, G., Dumke, A., Michael, G., van Gasselt, S., Kneissl, T., Zuschneid, W., Hauber, E., and Mangold, N. (2010). Earth and Planetary Science Letters, 294(3), pp. 238–255. [9] Chapman, M. G., Neukum, G., Dumke, A., Michael, G., van Gasselt, S., Kneissl, T., Zuschneid, W., Hauber, E., Ansan, V., Mangold, N., and Masson, P. (2010). Earth and Planetary Science Letters, 294(3), pp. 256–271. [10] Lucchitta, B. K. (2001). Geophysical Research Letters, 28(3), pp. 403–406. [11] Hargitai, H., and Gulick, V. (2018). Late Amazonian–Aged Channel and Island Systems Located East of Olympus Mons, Mars. In Dynamic Mars: Recent and current landscape evolution of the red planet, pp. 121–154.
How to cite: Mahoume, N., Grau Galofre, A., Choblet, G., and Carpy, S.: Interrogating the lava hypothesis for the origin of Kasei Valles with analyses of streamlined island morphometry, Europlanet Science Congress 2026, The Hague, The Netherlands, 6–11 Sep 2026, EPSC2026-434, https://doi.org/10.5194/epsc2026-434, 2026.
Virtual Reality (VR) headsets provide a way to explore distant planets such as Mars or the Moon using orbital and in situ imagery [e.g. 1, 2]. The VR immersion is particularly useful for several aspects. It allows to easily visualize, manipulate and navigate large data sets, using hand controllers. It also allows to visualize geomorphological landforms without the deformations induced by reprojections on flat screens. The VR environment generally provides a better sense of scales, and facilitates the recognition of patterns and relationships between different geological units, thanks to the versatility of the real time choice of the viewpoints by the user.
In order to illustrate this, we have developed two VR experiences to freely fly over two well-known martian landforms, Kasei Valles and Olympus Mons. Kasei Valles, the largest martian outflow channel, is hypothesized to be the result of ancient megafloods, released upon successive catastrophic collapses of a source frozen aquifer. Kasei Valles’ main erosional events date from the Amazonian period, a time marked by the end of previous mild conditions allowing for surface water stability [3, 4]. However, the scale, bedforms, location, and timing of the formation of Kasei Valles challenge its interpretation as solely the result of megaflooding [5], leading us to revisit the hypothesis that ice streams, that is, fast flowing megaglaciers, may have played a substantial role in its formation [6]. Our VR experience provides information within the framework of the “IceFloods” project [6], by helping to gain more understanding on the morphology of the canyon at the global scale, as well as the 3D shape and stratigraphy of streamlined islands [7]. As a second case study, the flanks of the Olympus Mons volcano show several landforms reminiscent of volcanic flows, landslides and past glacial features, which are particularly well expressed once seen in VR.
In order to create the virtual worlds, we used a blended DEM from MGS/MOLA and MEX/HRSC at 200m/pixel coming from Astropedia [8]. Various textures were evaluated, such as extracts of a 76 meter/pixel global color mosaic derived from the Tianwen-1 MoRIC camera [9] or the Mars Odissey THEMIS-IR daytime infrared mosaic at 100 meter/pixel [10]. The two study areas were covered using tiles of 2048x2048 pixels for the DEM and tiles of 8192x8192 pixels for the corresponding textures. These tiles were used to define a set of build-in “terrain” objects in the Unity game engine, which we used for the rendering. Instead of displaying the natural colors, we used linear stretches to better emphasize subtle morphological features. THEMIS data were artificially colorized using RGB values extracted from a typical OMEGA spectrum of Mars.
Kasei Valles (Figure 1) is covered by 4x4 tiles, corresponding to a surface of 1638x1638 km. Olympus Mons (Figure 2) is covered by 2x2 tiles, corresponding to an area of 819x819 km. The two VR scenes were compiled separately in order to provide a standalone executable running on a PC equipped with a VR headset such as the Quest 3 (used for this test).
Further works: in this first version, we did not account for the curvature of the planet. We also plan to locally integrate data at higher spatial resolution such as CTX, CASSIS or HiRISE to emphasize areas of geological interest, which are particularly relevant for the Kasei origin investigation.
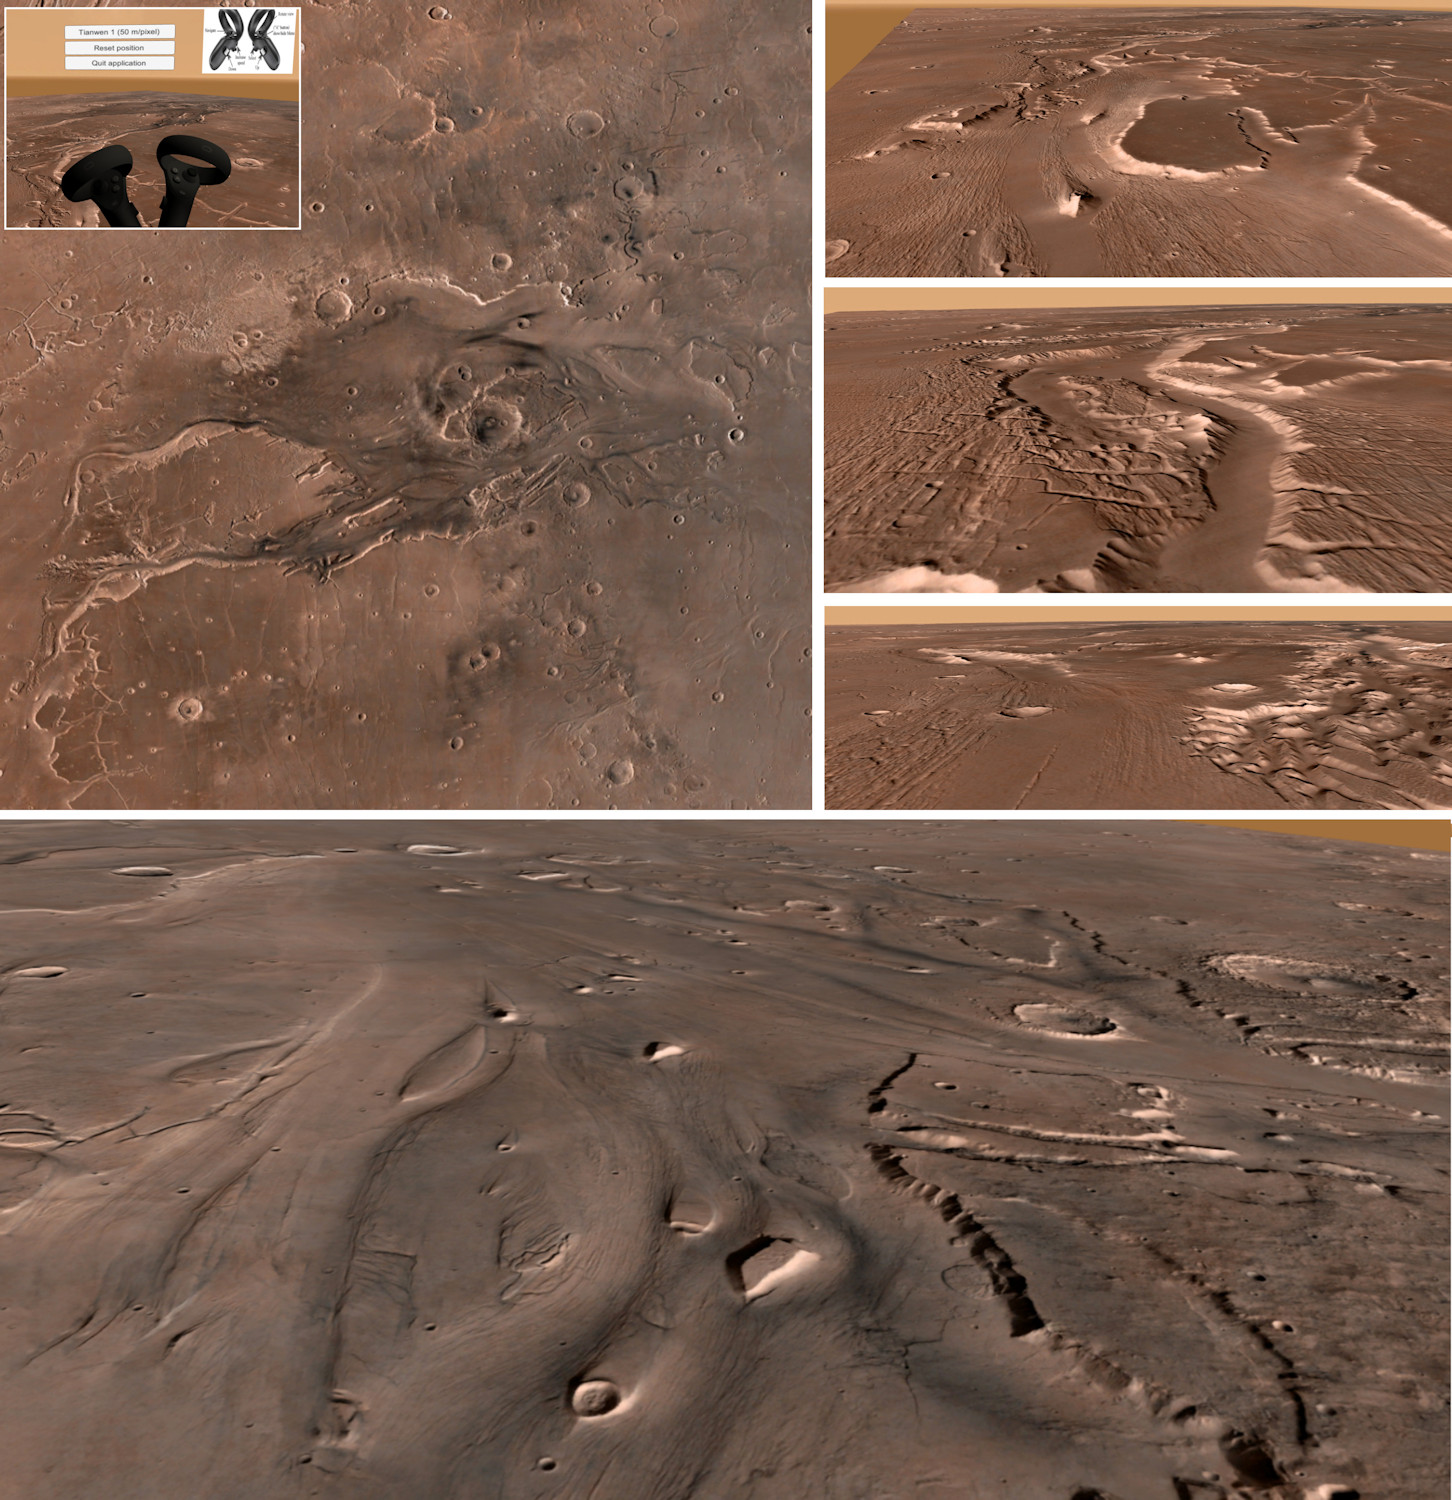
Figure 1: Preview of the Kasei Valles VR experience. The upper left panel shows the footprint of the terrain seen from above. The user can freely navigate using hand controllers (shown in the upper left inset). Examples of the real time rendering of the landscape are given in the side panels. The three upper right panels provide 3D context views of the grooved terrain inside Kasei Valles, whereas the bottom panel offers an oblique view of streamlined island morphometry and characteristics.
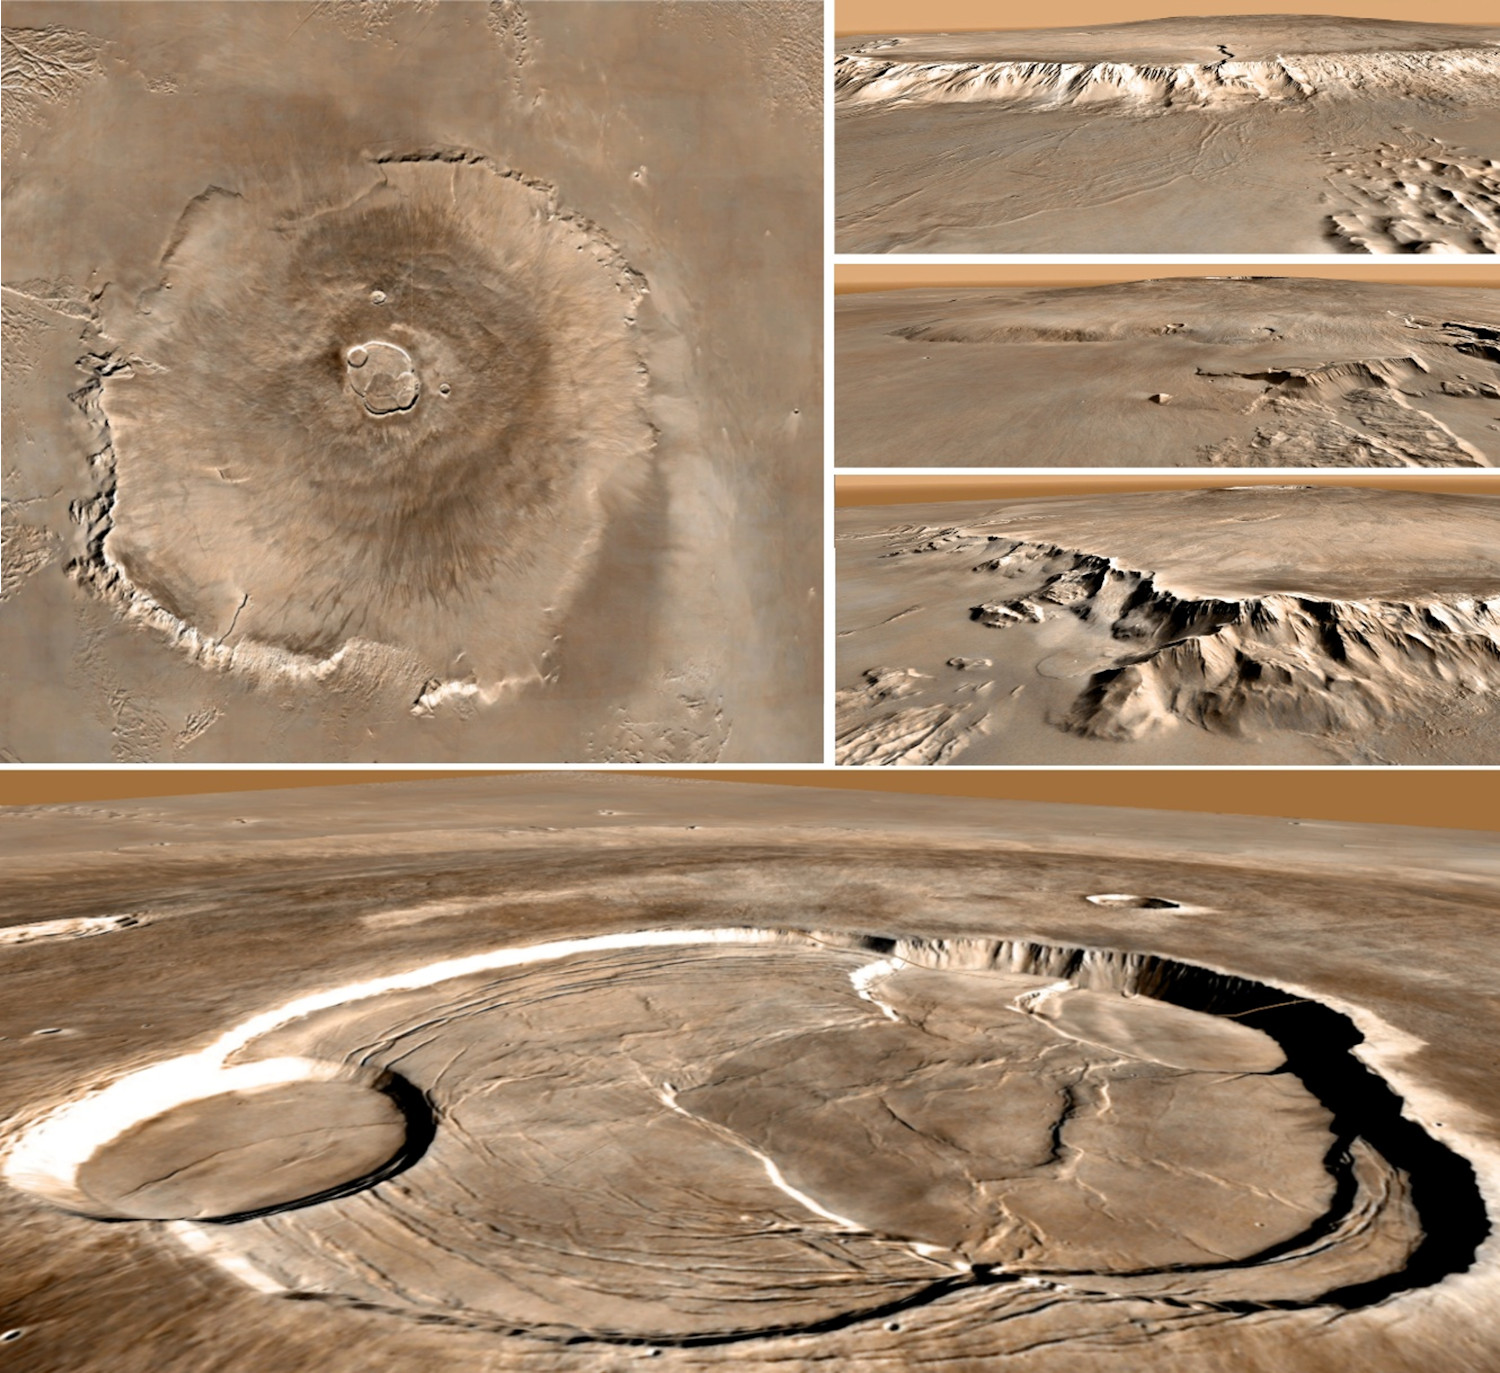
Figure 2: Preview of the Olympus Mons VR experience. The upper left panel shows the complete scene seen from above. Side views illustrate the rendering along the path, freely selected by the VR user using its hand controllers.
Acknowledgments
This project has received funding from the European Research Council (ERC) under the European Union’s Horizon Europe research and innovation program (Grant agreement No. 101165197 ICEFLOODS).
References
[1] Caravaca, G. et al. (2020), 3D digital outcrop model reconstruction of the Kimberley outcrop (Gale crater, Mars) and its integration into Virtual Reality for simulated geological analysis, Planet. Space Sci., 182, 104808, doi:10.1016/j.pss.2019.104808
[2] Le Mouélic, S. et al. (2024), Photogrammetric 3D reconstruction of Apollo 17 Station 6: From boulders to lunar rock samples integrated into virtual reality, Planet. Space Sci., 240, doi:10.1016/j.pss.2023.105813.
[3] Baker, V.R. and Milton, D.J. (1974). Erosion by catastrophic floods on Mars and Earth. Icarus, 23(1), pp.27-41.
[4] Chapman, M.G. et al. (2010). Amazonian geologic history of the Echus Chasma and Kasei Valles system on Mars: New data and interpretations. Earth and Planetary Science Letters, 294(3-4), pp.238-255.
[5] Leverington, D.W. (2011). A volcanic origin for the outflow channels of Mars: Key evidence and major implications. Geomorphology, 132(3-4), pp.51-75.
[6] Grau Galofre, A. (2025). Glacial Sculpture on Mars’ Ancient Megacanyons: A Presentation of Project ‘Icefloods’. In EPSC-DPS Joint Meeting 2025.
[7] Mahoume, N. et al. (2026) Interrogating the lava hypothesis for the origin of Kasei Valles with analyses of streamlined island morphometry. In EPSC 2026 (This issue).
[8] Fergason, R. L, Hare, T. M., & Laura, J. (2018). HRSC and MOLA Blended Digital Elevation Model at 200m v2. Astrogeology PDS Annex, U.S. Geological Survey. https://astrogeology.usgs.gov/search/map/mars_mgs_mola_mex_hrsc_blended_dem_global_200m
[9] Liu J. et al. (2024), A 76-m per pixel global color image dataset and map of Mars by Tianwen-1, Science Bulletin, 69, 14, pp 2183-2186, doi:10.1016/j.scib.2024.04.045.
[10] Edwards, C. S. et al. (2011), Mosaicking of global planetary image datasets: 1. Techniques and data processing for Thermal Emission Imaging System (THEMIS) multispectral data, JGR, 116, E10008, doi:10.1029/2010JE003755.
How to cite: Le Mouélic, S., Grau Galofre, A., Vaugeois, G., Mahoume, N., and Seignovert, B.: Using Virtual Reality to investigate large scale martian geologic landforms: The case of Kasei Valles and Olympus Mons, Europlanet Science Congress 2026, The Hague, The Netherlands, 6–11 Sep 2026, EPSC2026-445, https://doi.org/10.5194/epsc2026-445, 2026.
Martian gullies are landforms consisting of an erosional alcove, a channel, and a depositional apron. Gullies and water-ice related landforms, such as concentric crater fill (CCF), latitude-dependent mantle (LDM), moraine-like ridges (MLR) and glacier-like flows (GLF) are both common in the midlatitudes on Mars. Gullies have been found to form in, and interact with, water-ice related landforms, but to what extend the (past) presence of water-ice may have affected gully formation remains unknown.
This work investigates the association between gullies and water-ice related landforms in gullied craters on Mars. We use a tick-box approach to classify gully type and the presence of CCF, LDM, MLR, and GLF in 3314 gullied craters on Mars identified using CTX imagery.
Results show that 89% of gullies are currently incising into soft sediments, while 11% are currently incising into bedrock. CCF is found in 60% of gullied craters, LDM is found in 59% of gullied craters, MLR are found in 18% of gullied craters, and GLF only occurs in 5% of gullied craters. Interestingly, for the gullied craters where MLR is present in 69% of the cases gullies are exclusively found above the MLR and not on other slopes. A sharp delineation has been found around 40° N/S for both CCF and LDM, with both occurring above the 40° N/S line, which coincides with the change in orientation in gully orientation from pole-facing below 40° N/S and with multiple orientation above 40° N/S.
These results show that interactions between water-ice and gullies could have been common on Mars. Further study is needed to determine if melting of the water-ice deposits can have contributed to the formation of some gullies, or if slopes preconditioned by water-ice activity (for example by forming deposits of loose sediments) are favorable sites for generating gully activity by CO2 sublimation.
How to cite: de Haas, T., Klink, B., Conway, S., and Roelofs, L.: Global inventory of water-ice related landforms in gullied craters on Mars, Europlanet Science Congress 2026, The Hague, The Netherlands, 6–11 Sep 2026, EPSC2026-214, https://doi.org/10.5194/epsc2026-214, 2026.
Introduction:
Stable liquid water existed on the surface of Mars prior to ~3.0 Ga [1]. After this period, surface pressure and temperature conditions decreased, leading to the end of stable liquid water conditions at the surface. However, the presence of features such as Fresh Shallow Valleys [2], meltwater system [3,4], as well as channels located near volcanic regions and/or craters [5,6], suggest that liquid water may have flowed during the Amazonian period of Mars history, even if at a generally smaller scale.
The sources required for such activity are hypothesized to be either volcanism, which may have temporarily created favorable atmospheric conditions [7], or the presence of subsurface or surface ice masses [3]. In the latter case, the process involves an ice mass exerting enough pressure so that, at its base, ice can melt and generate liquid water. This water can then flow and form channels under the ice. On Mars, subglacial channels have already been but often limited in extent. We aim to study channels that are hundreds of kilometers long, Amazonian in age, flowing from Est to West.
The study area is located east of the Hellas basin (Figure 1), near Reull Vallis, in Promethei Terra. This area is known to have been subject to different periods of ice accumulation and volcanism [9].
Methods:
We used the Context Camera (CTX) MurrayLab mosaic (6 m/pixel) [10] to map the different structures and assess the regional context of the study area. We also used images and elevation data from the High-Resolution Imaging Science Experiment (HiRISE) (25 cm/pixel) [11], together with images from the Colour and Stereo Surface Imaging System (CaSSIS) (4–5 m/pixel) [12], to characterize points of interest.
We used crater size-frequency distribution analysis, with the CraterStats software, to derive an absolute chronology. Craters were manually digitized on selected surfaces (mesas and basement) using ArcGIS software. Ages were estimated following the Hartmann & Daubar (2017) [13] chronology system, applying differential, cumulative, and Poisson fitting methods [13].
Fig. 1. Geomorphologic map of the study area.
Observations:
We mapped channels (Figure 1) in our region over several hundred kilometers flowing consistently toward the center of the Hellas basin (value ~0.1%). The valleys are sub-parallel and evolve from an upstream convergent drainage pattern, where a limited number of tributaries feed into a main channel, toward a more divergent downstream configuration, locally transitioning into braided channels. Other landforms have been identified (Figure 1), including the presence of crest/ridge oriented roughly north–south and extending over several hundred kilometers, although they are locally truncated.
Crater counting indicates ages of 3.6 Ga for the mesas and 3.4 Ga for the basal unit. Additionally, this dating highlights a possible resurfacing event at 900 Ma. Based on relative chronology, there are two distinct valley formation events. The absolute chronology suggests that the studied landforms likely formed during these two periods, corresponding to the Late Hesperian and the Late Amazonian.
The selected case study (Figure 2) highlights a channel that crosses two major ridges, each approximately 300 to 600 m wide and predominantly oriented north–south. After incising the second ridge, the channel terminates in a fan-shaped deposit extending over 4 km downstream and reaching a maximum width of 1.4 km. A longitudinal profile indicates that the fan deposits is present in a lower gradient area. No channel is observed cutting across this fan. The main valley is approximately 5 to 30 m deep, reaching its greatest depth where it intersects the second ridge, and is between 150 and 500 m wide. It is bordered by lateral channels that form a sub-parallel network on the valley margins. These lateral channels lack tributaries and, according to profile B–B’ in Figure 1, are perched 7 to 15 m above the floor of the main valley. They are generally less than 5 m deep, although they can locally reach up to 10 m where they intersect the ridges, and are around 200 m wide. They follow the same overall orientation as the main valley and join it at oblique angles. However, they do not appear to follow the local topographic gradient. Profile A–A’ further shows that some of these channels clearly cut across ridge crests, directly modifying the pre-existing relief.
Fig. 2. Fan-shaped deposit associated with potential moraines and lateral meltwater channels.
Discussion:
The observations present a large range of landforms that are commonly associated with glacial settings and may be indicative of an ice-margin environment [14]. Matter of fact, moraines and subglacial channels followed downstream by a fan deposit form a typical glacial marginal assemblage. In the glacial context, such fans are interpreted as ice marginal fans and correspond to fan-shaped sedimentary deposits formed by meltwater flows originating from under an ice mass, which transport and deposit sediments as flow velocity and pressure decrease upon reaching the ice margin [15]. Ridges are interpreted as possible moraines, based on their orientation, which is broadly parallel to one another and perpendicular to regional slope (hence inferred ice flow direction), as well as on their asymmetric cross-sectional profiles [16].
Finally, we interpreted the perched valleys as lateral meltwater channels. They form along ice margins and are thought to be primarily fed by supraglacial meltwater, mapping the location of former ice margins.
Overall, these observations support the hypothesis of a former subglacial, ice marginal and proglacial environment involving liquid water flow on the east of the Hellas Basin. The morphological and morphometric characteristics appear to match the definition of FSVs, making this one of the most extensive FSV systems identified on Mars. Based on cross-cutting relationships with edifices that have been estimated to be Amazonian in age [9,16,17], as well as crater counting, we suggest that liquid water may have been present on Mars around ~1 Gyr. To explain the occurrence of meltwater, we suggest that regional volcanic activity, particularly upstream of the study area, may have triggered basal melting beneath an ice mass. This is the first time that a large-scale, warm based Amazonian ice sheet marginal environment is described on Mars.
How to cite: Blanc, E., Grau Galofre, A., Mangold, N., Berquez, S., and Le Becq, N.: Recent Surface Meltwater and Glacial Assemblage in Eastern Hellas Basin, Mars., Europlanet Science Congress 2026, The Hague, The Netherlands, 6–11 Sep 2026, EPSC2026-453, https://doi.org/10.5194/epsc2026-453, 2026.
Carbonates on Mars record interactions between CO₂-rich fluids and the crust, yet their apparent scarcity from orbit has long challenged models of a thicker early atmosphere. Here we show that carbonates are in fact widespread but largely concealed within clay-bearing terrains. We analyze over 500 near-infrared hyperspectral cubes from the Compact Reconnaissance Imaging Spectrometer for Mars (CRISM), targeting Fe,Mg-rich clay outcrops and systematically searching for associated carbonate signatures. A weak but diagnostic 2.5 µm absorption is identified in ~77% of cases, frequently accompanied by features near 3.5 µm. These signatures demonstrate that carbonates are pervasive across clay-rich regions, yet are routinely underestimated due to spectral masking and low abundances at orbital scale. Band positions indicate Fe–Mg solid solutions spanning the siderite–magnesite series, consistent with formation in basaltic environments under reducing to mildly oxidizing conditions.
The systematic co-occurrence of clays and carbonates across diverse terrains points to extensive, chemically evolved aqueous systems rather than localized or incomplete alteration. At orbital resolution, the absence of clear serpentine signatures further suggests that alteration pathways commonly progressed beyond early-stage reactions toward mature clay–carbonate assemblages. Together, these observations indicate that aqueous alteration on early Mars was more widespread and advanced than previously inferred.
Our results also imply that current orbital inventories represent a lower bound on carbonate abundance. In situ rover measurements reporting substantial carbonate contents in spectrally ambiguous terrains support the presence of large, previously unrecognized crustal reservoirs. This hidden carbonate inventory provides a plausible sink for early atmospheric CO₂ and helps reconcile the discrepancy between predicted and observed carbonate distributions.
The widespread association of clays and carbonates highlights environments that were both water-rich and geochemically stable—conditions favorable for habitability and long-term preservation of biosignatures. By revealing a planet-scale, cryptic carbonate reservoir, this study reframes the Martian carbon cycle and identifies high-priority targets for future exploration and sample return.
This work is funded by the Italian Space Agency [ASI-INAF n.23-3-HH.0].
How to cite: Brossier, J., De Sanctis, M. C., Altieri, F., Ferrari, M., Raponi, A., Saggese, V., Rasmussen, M., Frigeri, A., De Angelis, S., and Bruschini, E.: Clay-Carbonate Co-Occurrence on Mars Reveals More Mature, Chemically Evolved, and Spatially Pervasive Aqueous Systems, Europlanet Science Congress 2026, The Hague, The Netherlands, 6–11 Sep 2026, EPSC2026-620, https://doi.org/10.5194/epsc2026-620, 2026.
Introduction
Hematite has been detected and characterized at several locations on Mars, using data acquired by orbit- and rover-based instruments. Global remote sensing studies were made using low spatial resolution datasets such as MGS/TES and MEX/OMEGA (both ~3–10 km/px), leading to the detection of large-scale hematite-rich regions such as Meridiani Planum, Aram Chaos and Aureum Chaos [e.g., 1–3]. Local remote sensing studies were made using higher spectral and spatial resolution datasets, such as oversampled MRO/CRISM data (6 to 18 m/px) [e.g., 4]. These local high-resolution orbital studies have mostly focused on rover exploration regions, leading to the detection of small-scale hematite occurrences such as the Vera Rubin Ridge in Gale Crater [4]. On the ground, hematite was identified at several locations by the Opportunity and Curiosity rovers [5, 6]. The presence of hematite is suggested as evidence of ancient aqueous environments on Mars [1, 2, 4, 7], since most formation mechanisms involve water [8, 9]. These mechanisms may also involve microbial activity, which could be preserved in the rocks [8]. Hematite occurrences may thus hint at past potential habitable environments.
In this study, we aim to refine global-scale mapping of hematite occurrences on Mars using a combination of high spatial and spectral resolution orbital images acquired by the TGO/CaSSIS, MRO/CRISM and MRO/HiRISE instruments. Methods include (1) laboratory samples characterisation, (2) known hematite locations survey, (3) CaSSIS spectral parameters assessment and (4) CaSSIS-CRISM-HiRISE combined analysis to spectrally and morphologically characterise hematite-rich locations in detail.
Datasets
The CaSSIS instrument is a 4-band (BLU: 495, PAN: 678, RED: 836, NIR: 939 nm) visible to near-infrared (VNIR) stereo camera (~4 m/px) onboard the ExoMars 2016 Trace Gas Orbiter that allows for near-unique identification of hematite in NIR-RED-PAN colour composite images [10]. Its distinctive magenta colour in such colour composite is caused by the sensitivity of the RED filter (836 nm) to a prominent hematite absorption feature at ~860 nm, which causes a slight deflection relative to the PAN and NIR filters on either side [10] (Fig. 1). The CRISM instrument is a VNIR+IR camera which acquired hyperspectral targeted images (18 or 36 m/px) and multispectral mapping images at coarser spatial resolution [11]. The CRISM Multispectral Reduced Data Records (MRDR) and newly released VNIR Hyperspectral Data Records (VRDR) products are two near-global mosaics of mapping strips. MRDRs combine VNIR+IR detectors (410–3924 nm) spatially and spectrally downsampled to 180 m/px and 72 bands; while the VRDRs only use the VNIR detector (370–1020 nm), which is spatially and spectrally downsampled to 90 m/px and 90 bands. BD530, BD920 and BDI1000VIS spectral indices based on these products are used to locate regions that may contain crystalline hematite [11]. The HiRISE instrument is a 3-band, 25–50 cm/px camera which allows for detailed morphologic and textural observations at a higher resolution than CaSSIS and CRISM. Here, we use CaSSIS to map hematite and bridge the substantial spatial resolution gap between CRISM and HiRISE [10].
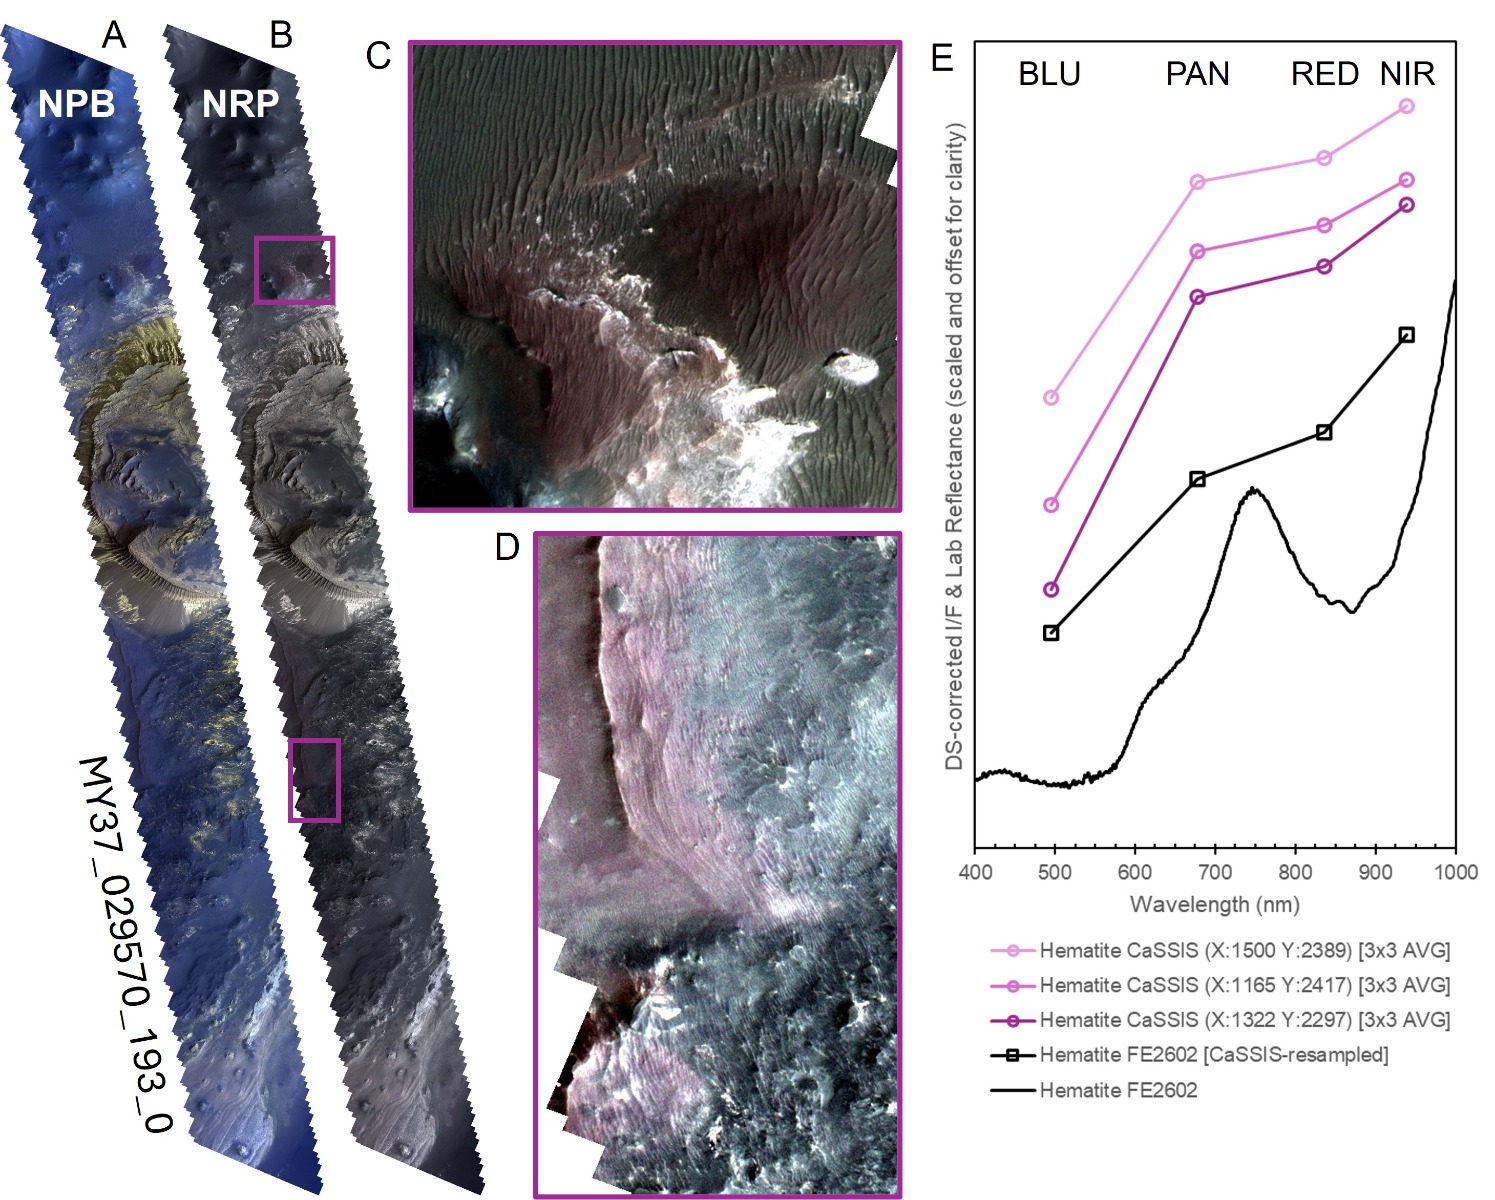
Fig. 1. Dark Subtraction corrected CaSSIS image MY37_029570_193_0 in Capri Chasma. A and B) NPB and NRP colour composite (0.1% linear stretch). Purple rectangles indicate the location of C and D insets. C and D) Hematite-rich locations exhibiting a dark magenta colour in NRP relative to the greyish background (linear stretch of 2% (C) and 1% (D)). E) CaSSIS-extracted spectra (purple circles), compared to hematite lab reference spectrum (USGS: FE2602) resampled to CaSSIS wavelengths (black squares).
Methods
First, samples were created in the lab by mixing 0 to 15 wt.% of fine-grained red hematite with planetary simulant, to represent the abundance range observed on Mars [12]. Samples were characterized by VNIR spectroscopy to estimate the limit of detection of fine-grained hematite by hyperspectral sensors [13].
Second, a survey of known hematite-rich locations was conducted by reviewing the literature and existing datasets to identify study areas for evaluating the hematite detection methods described below. CaSSIS, HiRISE and CRISM images and/or products overlapping the known locations are being corrected using a Dark Subtraction (DS) method to account for atmospheric scatter [14, 15], and a high-spatial-resolution spectral analysis and characterisation of known hematite locations is being conducted.
Third, a comprehensive suite of CaSSIS spectral parameters was calculated on a CaSSIS-resampled spectral library consisting of a variety of minerals present on the Martian surface, sourced from reference reflectance spectral libraries (e.g., USGS) and orbital imagery. Spectral parameters include band ratios, spectral slopes and band depth and height relative to different 2-band continuums (Fig. 2). Statistical methods are being used to assess which spectral parameters are the most useful to distinguish between hematite and other minerals, and to investigate the distinction of other iron minerals (goethite, jarosite, ferrihydrite) with CaSSIS. This spectral parameter set will be applied to the CaSSIS data to produce a refined global scale mapping of hematite, and potentially other ferric iron minerals, at unprecedented spatial resolution.
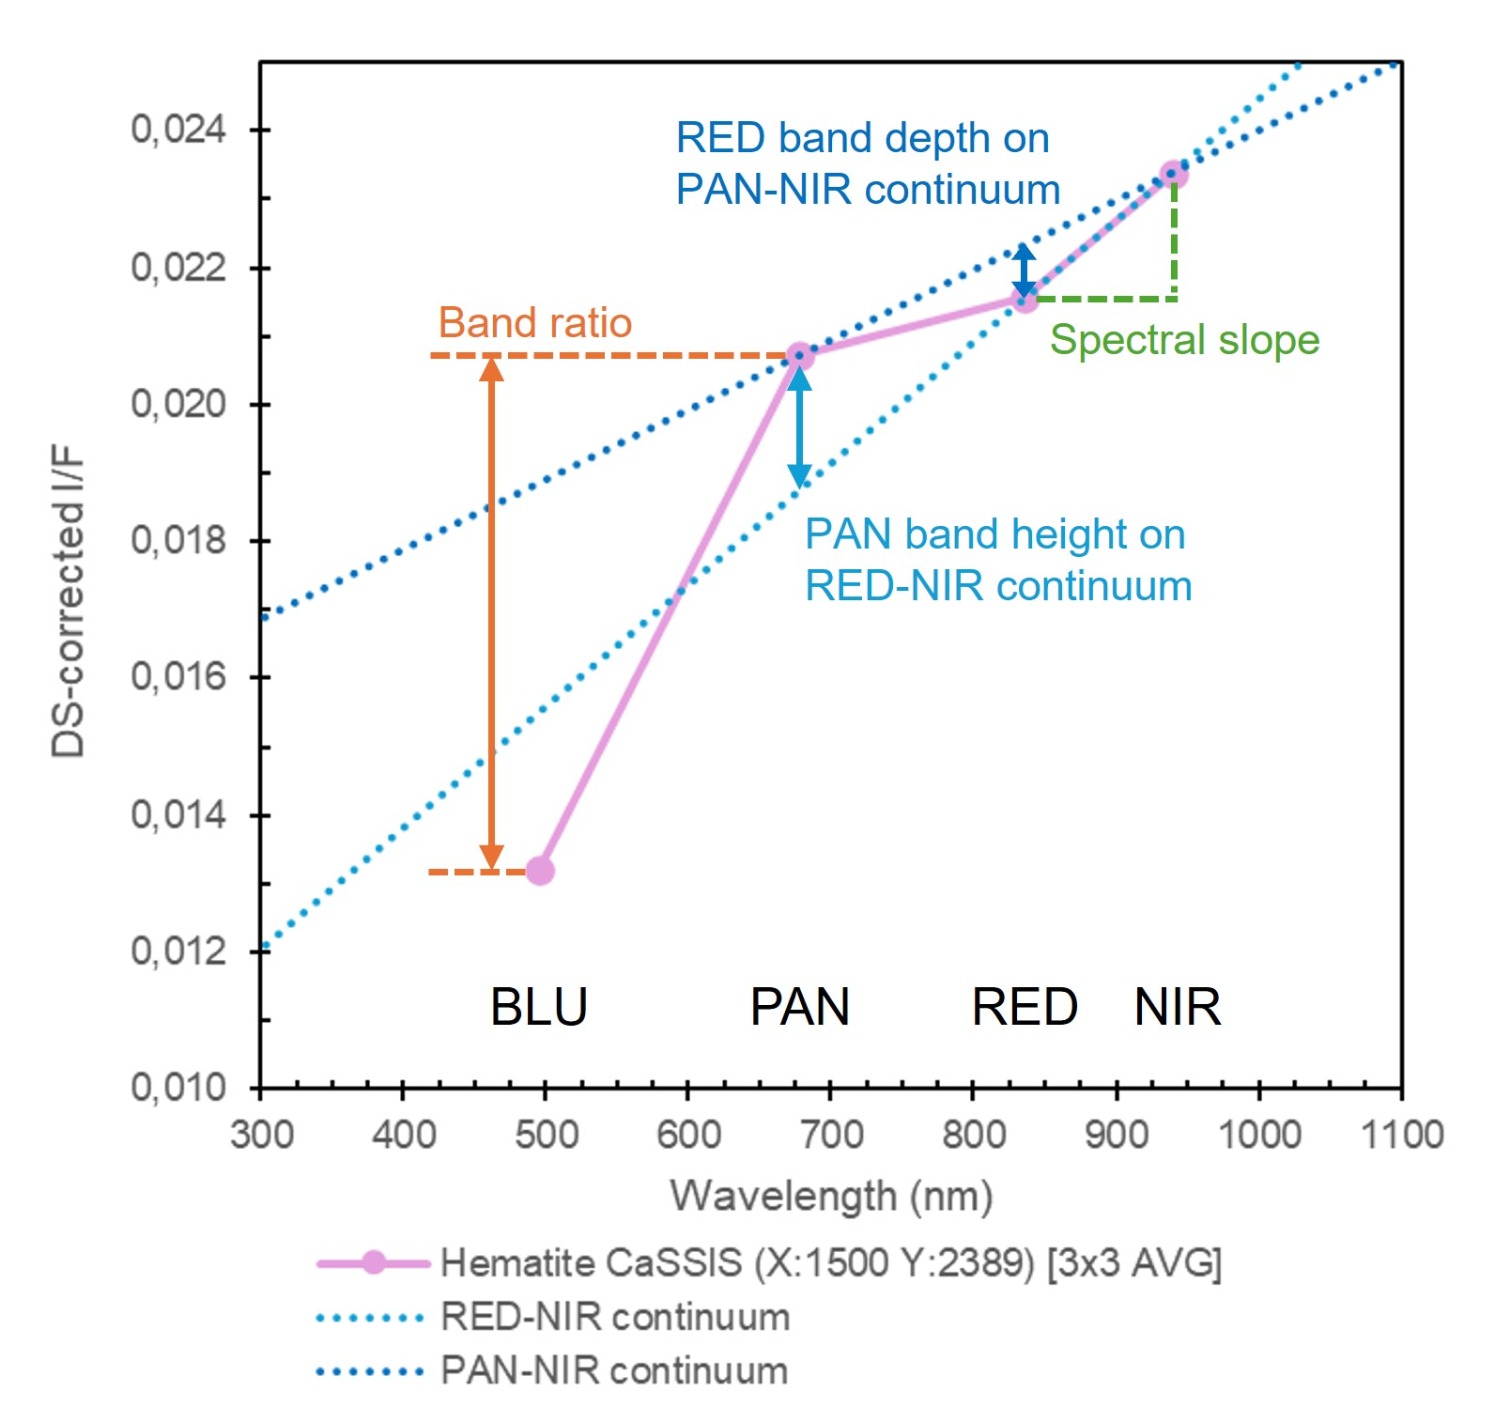
Fig. 2. Examples of spectral parameters used to distinguish hematite from other Mars minerals. On the figure, an example of a “classical” band depth (RED band depth on PAN-NIR continuum) and of a “modified” band height (PAN band height on RED-NIR continuum) are shown.
Future work will include a combined analysis of DS-corrected CaSSIS-CRISM-HiRISE data at high spatial resolution to characterize the potential new hematite locations in the refined mapping.
References
[1] Christensen et al. (2001) JGR: Planets, 106(E10). [2] Glotch and Rogers (2007) JGR: Planets, 112(E6), E06001. [3] Carrozzo et al. (2012) JGR: Planets, 117(E11), E00J17. [4] Fraeman et al. (2013) Geology, 41(10). [5] Squyres et al. (2004) Science, 306(5702). [6] Rampe et al. (2020) Geochemistry, 80(2), 125605. [7] Yoshida et al. (2018) Science Advances, 4(12). [8] Allen et al. (2001) Astrobiology, 1(1). [9] Jiang et al. (2022) Reviews of Geophysics, 60(1), e2020RG000698. [10] Tornabene et al. (2024) EPSC abstract EPSC2024-1321. [11] Murchie et al. (2025) EPSC abstract EPSC-DPS2025-136. [12] Fraeman et al. (2020) JGR: Planets, 125(12), e2020JE006527. [13] Brassard et al. (2025) LPSC abstract 2420. [14] Tornabene et al. (2018) Space Science Reviews, 214(18). [15] Rangarajan et al. (2024) Icarus, 419, 115849.
How to cite: Brassard, É., Tornabene, L. L., Lemelin, M., and Cloutis, E.: Using ExoMars-TGO/CaSSIS for the spatial and spectral characterization of hematite-rich locations on Mars, Europlanet Science Congress 2026, The Hague, The Netherlands, 6–11 Sep 2026, EPSC2026-285, https://doi.org/10.5194/epsc2026-285, 2026.
Abstract
The Makgadikgadi Basin in Botswana represents one of the largest evaporitic systems on Earth and is considered an important terrestrial analogue for Martian playa and hypersaline environments [1;2]. The basin is characterised by evaporitic crusts, authigenic clay minerals, polygonal fractures, layered deposits and groundwater-controlled geomorphological processes comparable to those observed in Martian paleolake basins and playa environments [1;3;5]. This study investigates the surface mineralogy of the Makgadikgadi Pans using hyperspectral remote sensing data from the ASI (Agenzia Spaziale Italiana) PRISMA (PRecursore IperSpettrale della Missione Applicativa) mission and compares the results with hypersaline environments on Mars analysed using Compact Reconnaissance Imaging Spectrometer for Mars (CRISM) data. The mineralogical analysis focuses on the identification and distribution of clay minerals and evaporitic phases within the pans. Preliminary spectral analysis reveals the presence of clay minerals including montmorillonite, illite, glauconite, and evaporites such as thenardite and trona, which are associated with hypersaline depositional conditions and groundwater activity within the basin [2;4].
Introduction
Terrestrial hypersaline environments are considered fundamental analogues for understanding aqueous and evaporitic processes on Mars. The Makgadikgadi Basin is located within the central Kalahari Basin in Botswana and consists of a system of salt pans formed from the desiccation of the paleo-Lake Makgadikgadi [2;3]. The basin is characterised by arid to semi-arid climatic conditions, high evaporation rates, seasonal flooding and groundwater-controlled sedimentary processes [1;3]. The study focuses mainly on the Ntwetwe and Sua pans, where previous studies identified evaporitic minerals, authigenic clays and geomorphological features analogous to Martian playa deposits [1;2]. These environments provide ideal conditions for investigating clay mineral formation and preservation within hypersaline systems.
The Makgadikgadi Basin is characterised by layered mounds, inverted channels, polygonal fractures and evaporitic crusts, suggesting prolonged interactions between groundwater, evaporation and sedimentary processes [1;2]. Moreover, this Basin is characterised by authigenic clay formation associated with alkaline closed-basin depositional environments [4]. Previous studies indicate that the clay fraction is dominated by smectite-rich assemblages together with illite, kaolinite and glauconite minerals [4]. Evaporitic minerals including trona and thenardite are also common within the basin and are associated with hypersaline conditions and seasonal evaporitic processes [1].
Similar hydrated minerals and phyllosilicates have been identified on Mars using CRISM data in locations such as Jezero Crater and Gale Crater [4;6;8]. These clay minerals are of significant astrobiological interest because they indicate past aqueous activity and may preserve biosignatures [4]. This study therefore aims to compare the clay mineralogy of the Makgadikgadi Pans with Martian hypersaline environments using PRISMA and CRISM hyperspectral datasets.
Mineralogical Investigation from PRISMA and CRISM
PRISMA hyperspectral data were processed and analysed in ENVI to identify diagnostic spectral absorption features associated with clay minerals and evaporitic phases within the Makgadikgadi Pans [F1]. Clay mineral distribution maps were generated to investigate mineralogical variations across the basin and their relationship to evaporitic and hydrological processes. Particular attention was given to authigenic clay-rich associated with groundwater upwelling and evaporitic crust development.
CRISM data from Martian paleolake environments, including Jezero Crater and Gale Crater, were then analysed for comparison with the terrestrial spectral signatures obtained from PRISMA. Previous studies identified Fe/Mg smectites, carbonates and hydrated minerals within these Martian environments [5;6;7;8], providing an important framework for comparative hyperspectral analysis between Earth and Mars.
Conclusions
Preliminary PRISMA spectral analysis of the Makgadikgadi Pans indicates the presence of hydrated clay minerals and evaporitic phases associated with hypersaline depositional environments. Minerals identified include montmorillonite, illite, glauconite, thenardite and trona, which are important indicators of aqueous alteration and evaporitic processes. The production of clay mineral distribution maps improve our understanding of spatial mineralogical variations within the basin and their relationship to groundwater activity and evaporitic processes.
Comparative analysis with CRISM data from Jezero Crater and Gale Crater will contribute to understanding the formation and preservation of hydrated minerals within Martian paleolake systems. This study strengthens the role of the Makgadikgadi Basin as an important terrestrial analogue for Martian hypersaline environments.
References
[1] Franchi, F., MacKay, R., Selepeng, A.T., Barbieri, R., 2020. Layered mound, inverted channels and polygonal fractures from the Makgadikgadi pan (Botswana): Possible analogues for Martian aqueous morphologies. Planetary and Space Science 192, 105048.
[2] Kahsay, T.H., Asrat, A., Franchi, F., 2024. The astrobiological potential of the Makgadikgadi Basin, Botswana: Field analogue for planetary exploration. Planetary and Space Science 249, 105943.
[3] Franchi, F., Cavalazzi, B., Evans, M., Filippidou, S., Mackay, R., Malaspina, P., et al., 2022. Late Pleistocene-Holocene palaeoenvironmental evolution of the Makgadikgadi Basin, central Kalahari, Botswana: new evidence from shallow sediments and ostracod fauna. Frontiers in Ecology and Evolution 10, 818417.
[4] Zinzi, A., Manzari, P., Camplone, V., Ammannito, E., Sindoni, G., Zucca, F., Polenta, G., 2025. Terrestrial and Martian Paleo-Hydrologic Environment Systematic Comparison with ASI PRISMA and NASA CRISM Hyperspectral Instruments. Remote Sensing 17, 758.
[5] Du, P., Yuan, P., Liu, J., Ye, B., 2023. Clay minerals on Mars: An up-to-date review with future perspectives. Earth-Science Reviews 243, 104491.
[6] Horgan, B.H.N., Anderson, R.B., Dromart, G., Amador, E.S., Rice, M.S., 2020. The mineral diversity of Jezero crater: Evidence for possible lacustrine carbonates on Mars. Icarus 339, 113526.
[7] Rampe, E.B., Ming, D.W., Blake, D.F., Bristow, T.F., Chipera, S.J., Grotzinger, J.P., et al., 2017. Mineralogy of an ancient lacustrine mudstone succession from the Murray formation, Gale crater, Mars. Earth and Planetary Science Letters 471, 172-185.
[8] Motlhasedi, A.J., Tognon, G., Baschetti, B., Franchi, F., Pondrelli, M., Komatsu, G., in press. Investigation of a potential endorheic basin on Mars in the Terra Cimmeria. Icarus.
Figure 1 [F1]
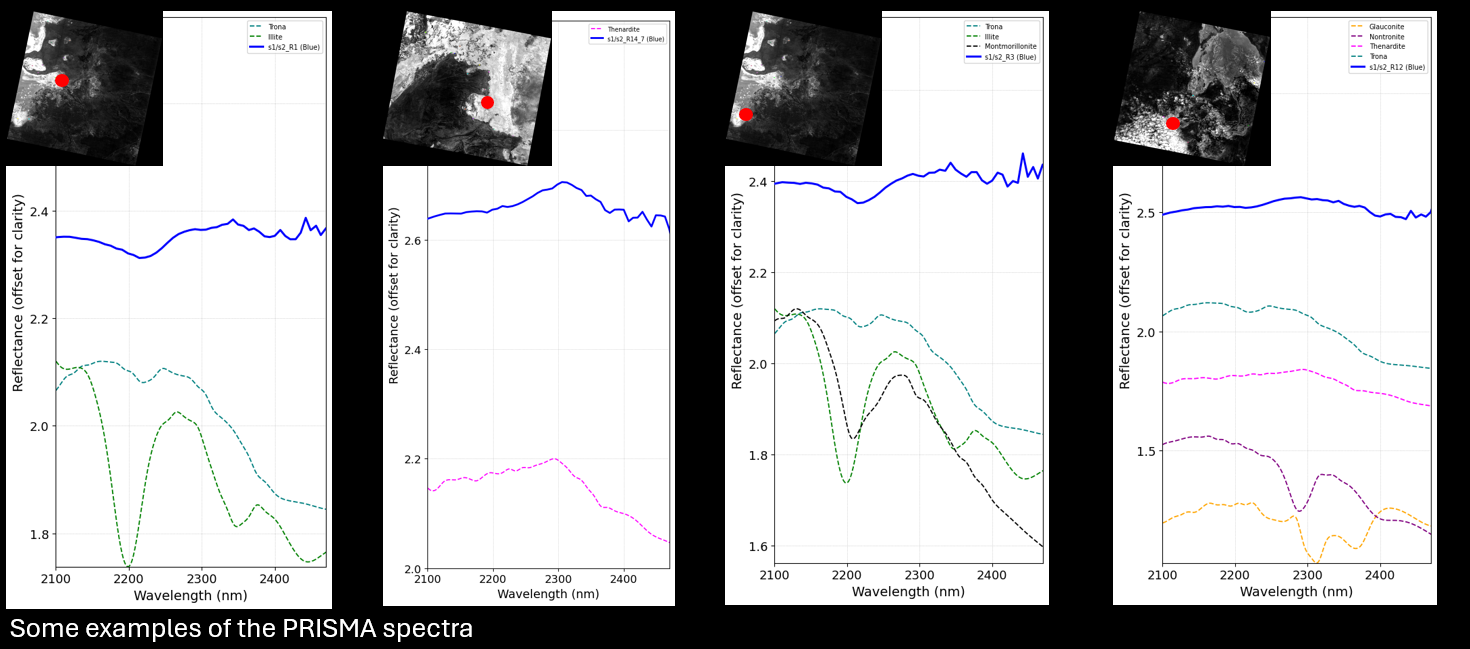
How to cite: Motlhasedi, A., Franchi, F., and Manzari, P.: Comparative Mineralogy of the Makgadikgadi Pans And Martian Hypersaline Environments using PRISMA and CRISM Hyperspectral Data, Europlanet Science Congress 2026, The Hague, The Netherlands, 6–11 Sep 2026, EPSC2026-1096, https://doi.org/10.5194/epsc2026-1096, 2026.
Arabia Terra is one of the oldest and most geologically complex regions of Mars, forming a broad transition zone between the ancient southern highlands and the northern lowland plains. The region hosts widespread layered deposits, erosional remnants, intracrater mounds, fretted valleys, isolated mesas and possible volcanic or volcaniclastic units [1]. Layered deposits have been interpreted as the result of sedimentary accumulation, airfall deposition, groundwater-related processes, erosion and possible volcanic activity [2–5] and are regarded as remnants of a formerly more extensive sedimentary cover locally associated with sulfate-bearing and Meridiani-type materials [6–9].
Within this context, Flat-Topped Mountains (FTMs) represent a distinctive but poorly characterized class of positive-relief landforms in Arabia Terra. They are defined here as isolated or semi-isolated reliefs with broad, sub-planar summit surfaces, well-defined basal margins and variably degraded flanks. The term FTM is used as a descriptive geomorphic category, deliberately neutral with respect to origin, to assess their possible affinities with erosional mesas, layered mounds, exhumed landforms, groundwater-related deposits and volcanic or volcaniclastic edifices.
We conducted a systematic survey of FTMs using a multi-dataset approach, integrating Context Camera (CTX) mosaics from the Murray Lab [10,11], three CTX-derived digital elevation models (DEMs) generated with the Ames Stereo Pipeline (ASP) and ISIS [12,13] and Mars Orbiter Laser Altimeter (MOLA) data [14]. A total of 20 FTMs were identified and mapped. For each landform, we extracted total height (H), basal diameter (DB) and summit diameter (DS), absolute summit elevation (Z) and computed DS/DB as a first-order morphometric proxy for assessing affinities with erosional remnants or constructional edifices [15].
The 13 mapped FTMs (Fig. 1) exhibit H values ranging from ~80 to ~309 m, DB from ~0.49 to ~2.66 km and Ds from ~0.23 to ~1.42 km. DS/DB ratios range from ~0.43 to ~0.78, indicating variable degrees of summit preservation and flank retreat. CTX DEMs-derived summit elevations range from approximately −1788 to −1349 m (mean ~−1619 m, standard deviation ~126 m). The broad interquartile range (~265 m) confirms that FTM summit surfaces do not define a single, regionally continuous elevation level. Summit elevations broadly follow the regional topographic gradient and several FTMs occur close to lineaments of abrupt topographic gradient change, hereafter referred to as slope breaks (SBs). The partial correspondence between FTM summit elevations and SBs may indicate local control by pre-existing topography, differential erosion or stratigraphic discontinuities.
Three non-mutually exclusive formation scenarios are considered. First, FTMs may represent erosional remnants of formerly more extensive sedimentary or volcaniclastic sequences, shaped by differential erosion and possibly capped by more resistant material; although internal layering is not directly resolved at CTX resolution in the present dataset, this scenario is consistent with the regional stratigraphy of Arabia Terra [2,5,7–9,16,17]. Second, some FTMs may record groundwater-related deposition, fluid expulsion or consolidation processes later exposed by erosion, in agreement with models of prolonged hydrogeological activity in the region [6,9,18]. Third, a volcanic or volcaniclastic origin cannot be excluded, given the proposed ancient volcanic province of Arabia Terra [4]; more speculatively, some morphologies could be compared with tuya-like edifices formed by lava–ice interaction [15,19–21,22]. The absence of diagnostic volcanic textures in the present dataset, however, suggests that this interpretation should remain a working hypothesis. Separately, the broad range of summit elevations argues against truncation at a single regional water level, as would be expected for a simple wave-planation origin.
The TIN interpolation of CTX DEM-derived summit elevations provides an exploratory view of the spatial distribution of FTM summit heights. The resulting pattern suggests that summit elevations are not randomly distributed, but may define distinct altimetric domains or a broad regional trend, with summit levels broadly grouped around −1780/−1750 m, −1650/−1600 m and locally up to −1350 m. If confirmed, this arrangement could record distinct paleolake or paleoshoreline levels, an interpretation consistent with paleohydrological models for Arabia Terra [6,9] and not necessarily excluded by the association with SBs.
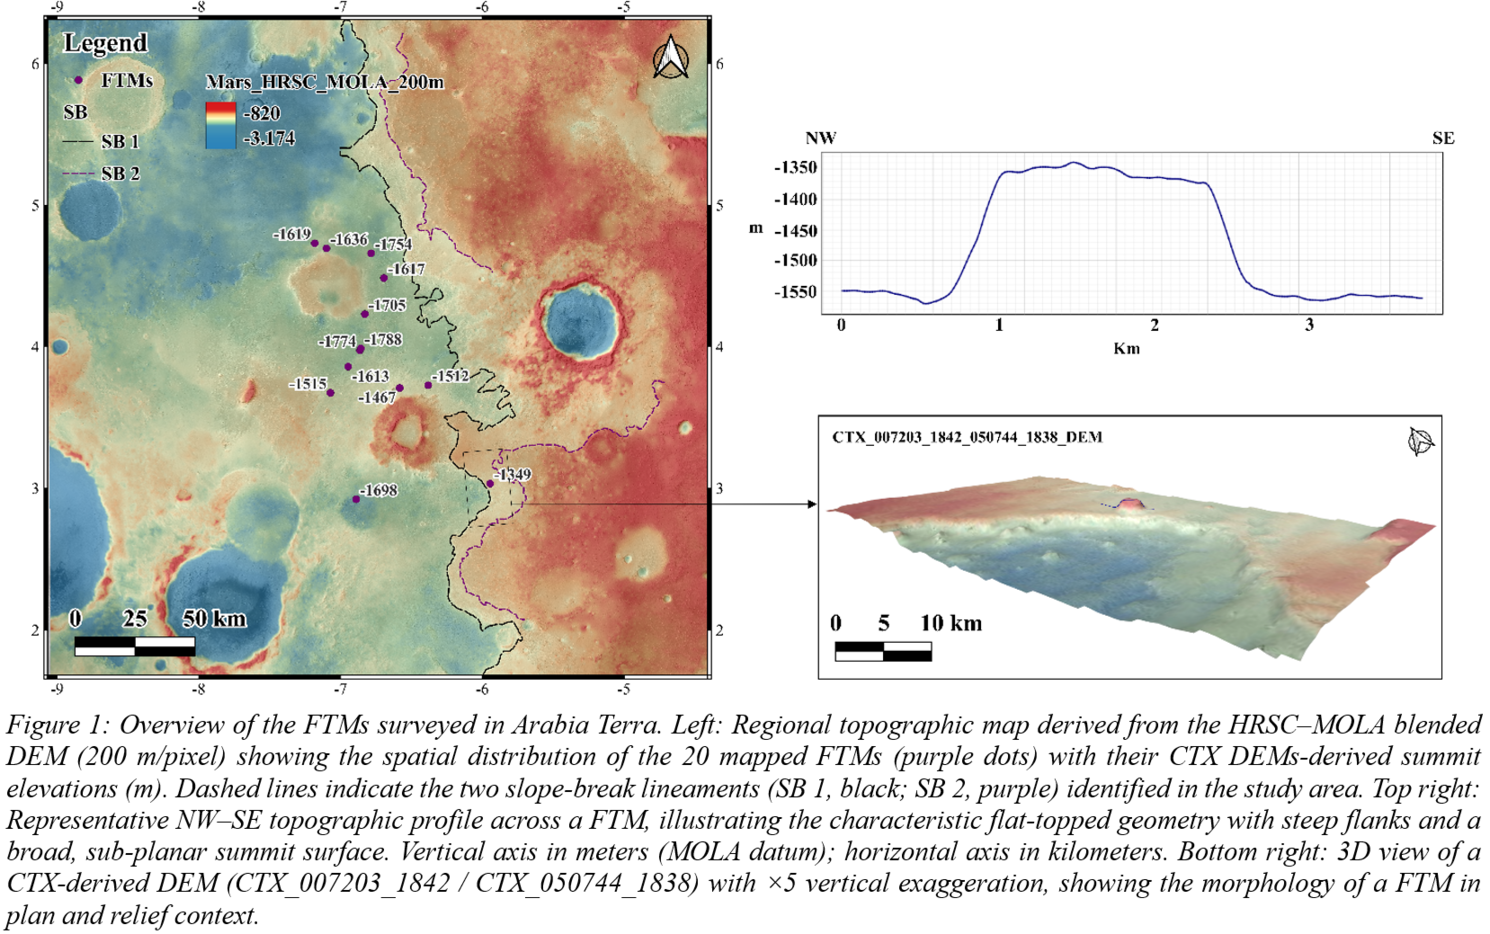
This preliminary morphometric and topographic census provides a first quantitative description of FTMs in Arabia Terra and highlights their potential value as geomorphic markers of depositional, erosional, hydrological and possibly volcanic processes. FTMs likely do not represent a single genetic class, but a morphologically coherent population shaped by different combinations of deposition, induration, erosion and exhumation. Future work will integrate crater-retention ages, stratigraphic analysis and high-resolution image interpretation to discriminate between formation scenarios and assess their implications for the geological evolution of Arabia Terra during the Noachian–Hesperian transition.
References
[1] Tanaka, K.L., et al. (2014). USGS SIM 3292. [2] Fassett, C.I. and Head, J.W. (2007). JGR: Planets, 112, E08002. [3] Fergason, R.L. and Christensen, P.R. (2008). JGR: Planets, 113, E12001. [4] Michalski, J.R. and Bleacher, J.E. (2013). Nature, 502, 47–52. [5] Pondrelli, M., et al. (2015). GSA Bulletin, 127, 1064–1089. [6] Andrews-Hanna, J.C., et al. (2010). JGR: Planets, 115, E06002. [7] Zabrusky, K., et al. (2012). Icarus, 220, 311–330. [8] Annex, A.M. and Lewis, K.W. (2020). JGR: Planets, 125, e2019JE006188. [9] Schmidt, G., et al. (2021). JGR: Planets, 126, e2021JE006974. [10] Malin, M.C., et al. (2007). JGR: Planets, 112, E05S04. [11] Dickson, J.L., et al. (2024). Earth and Space Science, 11, e2024EA003555. [12] Beyer, R.A., et al. (2018). Earth and Space Science, 5, 537–548. [13] Paquette, A.C. (2023). USGS data release, doi:10.5066/P1374ZGR. [14] Smith, D.E., et al. (1999). Science, 284, 1495–1503. [15] Ghatan, G.J. and Head, J.W. (2002). JGR: Planets, 107, 5048. [16] Edgett, K.S. (2005). The Mars Journal, 1, 5–58. [17] Davis, J.M., et al. (2019). JGR: Planets, 124, 1913–1934. [18] Di Pietro, I., et al. (2023). JGR: Planets, 128, e2022JE007504. [19] Smellie, J.L. and Skilling, I.P. (1994). Sedimentary Geology, 91, 115–132. [20] Chapman, M.G. and Tanaka, K.L. (2001). JGR: Planets, 106, 10087–10100. [21] Ackiss, S.E., et al. (2018). Icarus, 311, 357–370. [22] Komatsu, G., et al. (2007). Geomorphology, 88, 352–366.
How to cite: Mancini, F., Mariani, E., Pondrelli, M., Allemand, P., and Ori, G. G.: Flat-Topped Mountains in Arabia Terra, Mars: Morphometric Characterization and Genetic Implications, Europlanet Science Congress 2026, The Hague, The Netherlands, 6–11 Sep 2026, EPSC2026-822, https://doi.org/10.5194/epsc2026-822, 2026.
The origin of mound-like edifices in the Martian southern highlands remains debated, particularly whether these features result from sedimentary extrusion or magmatic volcanic processes, and to what extent their emplacement is controlled by regional tectonics associated with the Tharsis stress field [1], [2]. Resolving this issue requires isolating the role of structural inheritance from local geomorphological effects within resurfaced basins.
Bernard Crater, located in Terra Sirenum (~20°–45°S; 140°–180°W), provides a well-constrained setting to address this problem. The crater (~128 km diameter) is superimposed on an ancient Noachian crust affected by sedimentary infilling and aqueous alteration [3], [4], and lies within a region structured by radial and circumferential fracture systems linked to the Tharsis tectono-magmatic province. Its floor was resurfaced during the Amazonian and hosts a dense population of mound-like edifices.
This study integrates CTX-based geomorphological mapping, structural analysis, THEMIS IR Night observations, morphometric measurements, and crater size–frequency distribution (CSFD) dating to determine whether mound emplacement is structurally controlled at regional scale, locally organized, or independent of the broader tectonic framework.
A total of 182 mound-like edifices were mapped within Bernard Crater, compared to 673 across the entire Terra Sirenum region. Their distribution is strongly heterogeneous, with a preferential concentration on the crater floor and absence on surrounding plateau surfaces. Their spatial organization is defined by clustered populations and linear alignments extending over several kilometers. Alignment analysis shows a dominant orientation between 150° and 170° (NNW–SSE), consistent with the principal orientation of mapped fractures within the crater.
At local scale, several mound chains are superimposed on concentric fractures and linear features, indicating that pre-existing discontinuities acted as pathways for ascent.
However, comparison with the regional structural framework reveals that mound organization is not systematically correlated with large-scale tectonic patterns across Terra Sirenum. Although regional fracture systems display multiple orientations related to Tharsis-induced stress fields [2], mound alignments are dominated by a single orientation and remain spatially restricted to specific sectors of the crater floor. The clustered populations further emphasize this localization, with high-density zones confined to limited areas rather than distributed along regional structural corridors. These observations indicate that mound emplacement is controlled primarily by local structural conditions within the crater rather than by direct expression of the regional tectonic framework.
Morphological analysis shows that the mound population is dominated by conical edifices with summit depressions, associated with less frequent collapsed structures and caldera-like features restricted to Bernard Crater. Morphometric data defines a coherent population: basal diameters range from ~80 to 1300 m, with most values between ~120 and 400 m; heights range from ~15 to 55 m, with a concentration between ~25 and 40 m; flank slopes are narrowly distributed between ~3° and 6°. These parameters indicate low-relief constructional landforms with consistent scaling relationships.
THEMIS IR Night observations (100 m/pixel) show that mound-bearing sectors correspond to distinct thermophysical domains within the crater, often associated with localized darker regions and linear features aligned with fractures. These patterns indicate that mound emplacement is embedded within structurally controlled surface units, although individual edifices are only weakly resolved at this scale.
CSFD analysis demonstrates that the crater floor was extensively resurfaced during the Amazonian (~250–500 Ma), defining the youngest geological surface within the study area. This timing postdates the main phase of Tharsis construction and indicates that mound emplacement occurred during a late stage of Martian geological evolution.
These results resolve the initial problem by showing that mound emplacement in Bernard Crater is structurally controlled but not directly governed by the regional tectonic framework of Terra Sirenum. Instead, emplacement reflects localized reactivation of inherited structures within the crater, which acted as preferential pathways for ascent during the Amazonian. The conical morphologies, vent-like summit depressions, restricted morphometric variability, and consistent alignment patterns are most compatible with small-scale monogenetic volcanic constructs [5], [6], while sedimentary extrusion remains a secondary and less consistent hypothesis [7].
Bernard Crater therefore records localized tectono-volcanic activity superimposed on an ancient crust, demonstrating that late-stage geological processes on Mars were controlled by local structural conditions rather than by direct expression of regional stress fields.
References
[1] E. Hauber, P. Brož, F. Jagert, P. Jodłowski, and T. Platz, “Very recent and wide-spread basaltic volcanism on Mars: RECENT WIDE-SPREAD VOLCANISM ON MARS,” Geophys. Res. Lett., vol. 38, no. 10. [2] D. Mège and P. Masson, “A plume–tectonics model for the Tharsis province, Mars,” Planetary and Space Science, vol. 44, no. 12, pp. 1499–1546, 1996. [3] A. F. Davila et al., “A large sedimentary basin in the Terra Sirenum region of the southern highlands of Mars,” Icarus, vol. 212, no. 2, pp. 579–589, Apr. 2011. [4] B. L. Ehlmann et al., “Discovery of alunite in Cross crater, Terra Sirenum, Mars: Evidence for acidic, sulfurous waters,” American Mineralogist, vol. 101, no. 7, pp. 1527–1542, Jul. 2016. [5] S. Patel, Harish, S. Vijayan, and M. R. El-Maarry, “A case for young igneous volcanism in the Terra Sirenum region, Mars,” Icarus, vol. 432, p. 116512, May 2025. [6] J. A. Nolan and A. H. Graettinger, “Small-volume monogenetic igneous landforms and edifices statistics (SMILES): A catalog of representative mafic volcanic landforms to enable quantitative remote identification,” Front. Earth Sci., vol. 10, p. 910107, Sep. 2022. [7] R. Hemmi and H. Miyamoto, “Distribution, morphology, and morphometry of circular mounds in the elongated basin of northern Terra Sirenum, Mars,” Prog Earth Planet Sci, vol. 4, no. 1, p. 26, Dec. 2017.
How to cite: Mariani, E., Allemand, P., and Komatsu, G.: Structural control and Amazonian emplacement of mound-like edifices in Bernard Crater (Terra Sirenum, Mars), Europlanet Science Congress 2026, The Hague, The Netherlands, 6–11 Sep 2026, EPSC2026-137, https://doi.org/10.5194/epsc2026-137, 2026.
Graben and fracture systems are fundamental surface expressions of crustal extension and are widely used to infer subsurface magmatic and tectonic processes on rocky planetary bodies. In the Elysium Planitia region on Mars, the Cerberus Fossae system represents the geologically most recent example of tectono-magmatic activity. Cerberus Fossae is characterized by sharp, minimally degraded surface morphologies and is associated with young volcanic deposits. Moreover, the InSight mission detected marsquakes clustered near Cerberus Fossae in 2021-2022, suggesting ongoing crustal deformation potentially linked to the igneous system at depth (1). The lack of a systematic characterization of the spatial variability and morphology of the surface structures hinders relating them to the most recent magmatic and tectonic activity in the Elysium Planitia region on Mars.
We present a detailed geomorphological map and analysis of the regions within Cerberus Fossae that display diverse graben and fracture morphologies. Mapping is based on Context Camera (CTX) images from the Mars Reconnaissance Orbiter (MRO), High Resolution Imaging Science Experiment (HiRISE) and Colour and Stereo Surface Imaging System (CaSSIS) data (from the ExoMars mission) for detailed structural characterization, and Mars Orbiter Laser Altimeter (MOLA) and High Resolution Stereo Camera of Mars Express (HRSC) topographic data to constrain surface morphology and relief. Graben segment length, slope, width, depth, fault continuity, segmentation style, tip type, fracture density, and cross-cutting relationships are described and quantified, with particular attention to interactions between graben and their associated features with pre-existing structural fabrics.
The mapped geomorphological attributes express spatial patterns within the Cerberus Fossae system and suggest that differences in surface expression may reflect variations in subsurface magma emplacement, stress conditions, or host-rock mechanical properties. Cross-cutting relationships, fault geometries, and spatial relationships between fault traces, aligned fractures, and pit crater chains, provide constraints on the relative timing of deformation episodes, the fault propagation mechanisms, and suggest multiple stages of extension potentially associated with repeated magmatic intrusions. By combining high-resolution geomorphological mapping of Cerberus Fossae with comparative planetary and terrestrial perspectives, this study aims to refine interpretations of magma-assisted extension on Mars and improve our understanding of how subsurface magmatism is recorded in planetary surface morphology.
References:
- Stähler et al., 2022, Nature Astronomy
How to cite: Baiju, A., Poppe, S., Havard, T., and Mège, D.: Structural development of magma-induced grabens and fracture systems: Geomorphological mapping of Cerberus Fossae, Mars, Europlanet Science Congress 2026, The Hague, The Netherlands, 6–11 Sep 2026, EPSC2026-391, https://doi.org/10.5194/epsc2026-391, 2026.
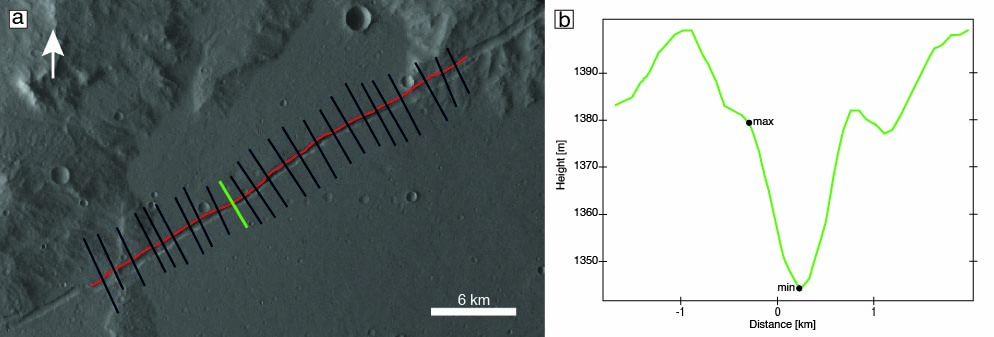
Figure 1: Topographic profiles for fault scaling. (a) the black line shows the longitudinal fault profile, the red lines are the individual cross-sections, and the green line shows the exemplary cross-section profile in (b), in which the minimum and maximum elevations at the graben floor and shoulders, respectively, are marked by green dots.
While HRSC profiles provided a regional overview of displacement scaling, the resolution was insufficient for a very small-scale analysis of segment boundaries. Consequently, we performed detailed structural mapping on 12 representative faults using high-resolution CTX imagery (~5-6 m/pixel). This approach enabled the identification of features such as relay ramps and linkage points. We classify segment hierarchies and evaluate the mechanical continuity of the fault network.

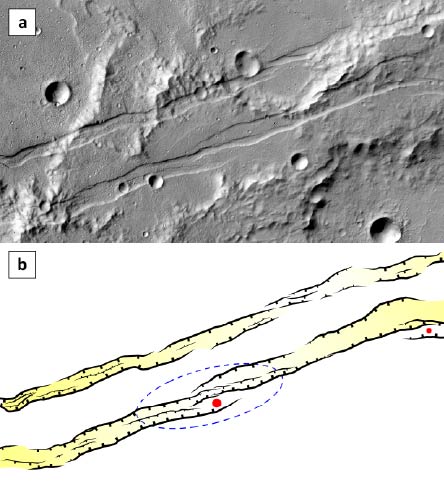
Figure 3: Parallel, long and narrow grabens typical for the Memnonia Fossae fault population. Note the linkage of faults in the area marked by the blue dashed line, and the relay ramp separating two fault segments (red dot). Detail of image mosaic of CTX images P13_005956_1569 and F23_044684_1565 (center at 22.12°S, 205.11°E).
We compare our results to previous measurements of faults on Mars, Earth, and beyond. Based on these analyses, we discuss the implications of fault segmentation and linkage for further interpretation.
Results
The initial analysis of 100 faults yielded an average Dmax/L ratio of 0.007, consistent with previous measurements of extensional systems of Mars [10]. The use of HRSC data allowed for a more precise determination of maximum displacement locations.
The subsequent comprehensive segmentation analysis of 12 faults demonstrates that the Memnonia region is organized into a clear hierarchical structure. While the number of primary segments remains relatively consistent across the population, segment lengths vary significantly between individual faults. Longer faults exhibit a higher number of hierarchical ranks, whereas smaller faults are composed of fewer subdivisions. Each sub-segment group typically contains two to three lower-hierarchy segments within each rank. These findings suggest that the present-day grabens are the product of systematic coalescence, where segment linkage plays a defining role in the distribution of strain (Fig. 2). The identified segment hierarchies provide a kinematic record of fault maturation, indicating that the current fault architecture is a product of progressive segment integration rather than isolated fracture growth.
References
[1] Cartwright, J. A., et al., J. Struct. Geol. 17, 1319-1326, 1995. [2] Cowie, P. A., Scholz, C. H. J. Struct. Geol. 14(10), 1149-1156, 1992. [3] Schultz, R.A. et al. J. Struct. Geol., 32, 855-875, 2010. [4] Cowie, P.A. and Scholz, C.H., J. Struct. Geol. 14, 1133-1148, 1992. [5] Peacock, D. C. P. J. Struct. Geol. 13(9), 1025-1035, 1991. [6] Stähler, S. C., et al. Nature Astronomy, 6(12), 1376-1386, 2022. [7] Perrin, C., et al., J. Geophys. Res., 127(1), e2021JE007118, 2022. [8] Lognonné, P., et al., (2019) Space Science Reviews, 215(1), 1-70. [9] Gwinner, K. et al. (2010) Earth Planet. Sci. Lett., 294, 506-519. [11] Hauber, E. et al. (2014) Lunar Planet. Sci. Conf. 45, #1981.
How to cite: Yazıcı, I. S., Hauber, E., and Tirsch, D.: Fault geometry analysis of Memnonia Fossae, Mars, Europlanet Science Congress 2026, The Hague, The Netherlands, 6–11 Sep 2026, EPSC2026-1098, https://doi.org/10.5194/epsc2026-1098, 2026.
Unlike Earth, Mars never developed plate tectonics, allowing billions of years of tectonic and volcanic deformation to remain preserved within its crustal structure and at their surface as fault systems. These inherited structures provide a unique opportunity to investigate the long-term mechanical evolution of the Martian lithosphere, and to constrain lateral variations in crustal thickness and density [1]. One of the central challenges in Martian geophysics is that gravity and topography data alone cannot uniquely resolve the planet’s internal structure [2]. Different combinations of crustal thickness
and density can produce nearly identical signals. In this study, we explore whether surface tectonic observations can help break this ambiguity by incorporating them as an additional constraint in a joint inversion.
We reconstructed a global map of horizontal surface deformation from the fault catalogue of Knapmeyer and et al. [3]. Fault segments were processed through spatial filtering and azimuthal merging before being converted into a signed horizontal strain field ε_obs_h, weighted by fault geometry using compressional and extensional fault-angle thresholds of 30◦ and 60◦ [4], respectively [Figure 1].
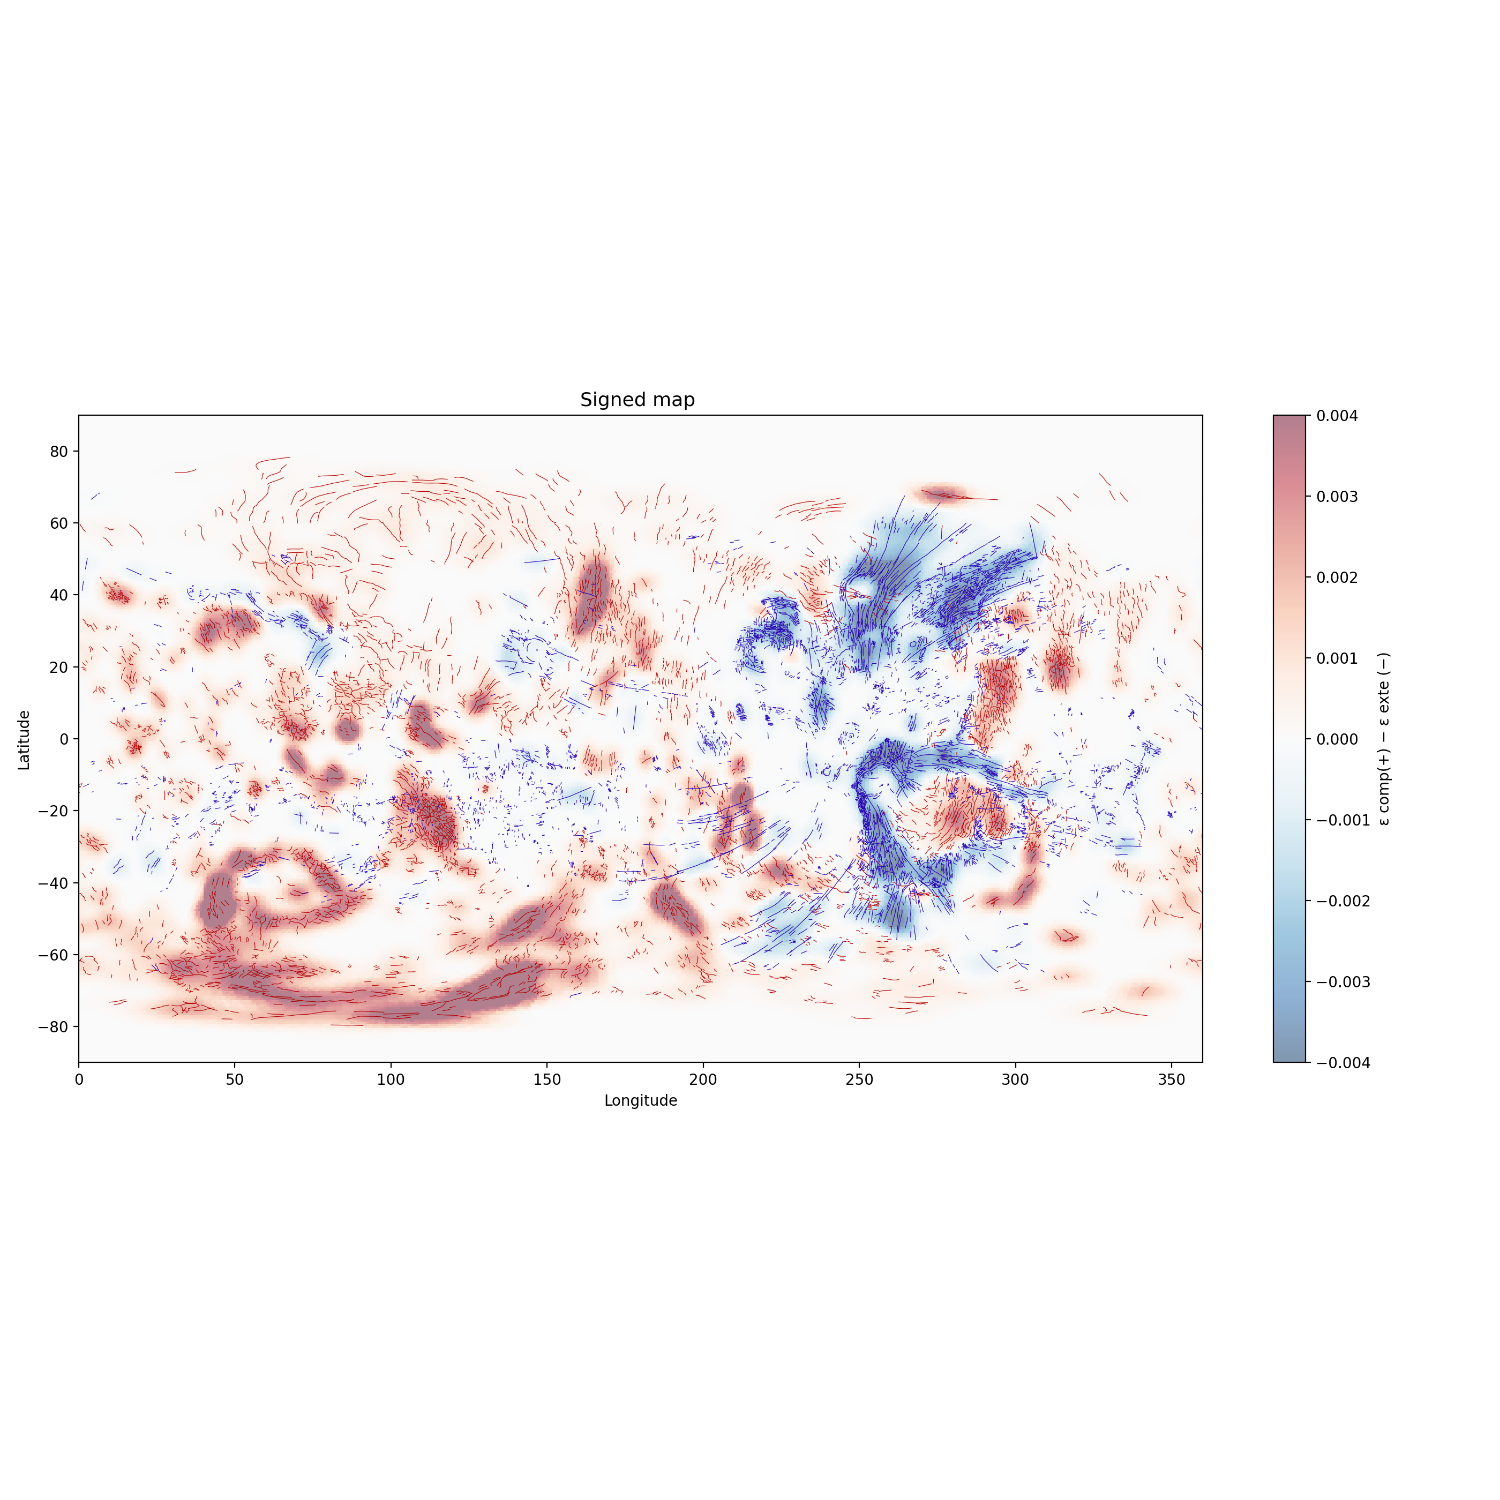
Fig1: Observed deformation based on tectonic [3}
This strain field is then mapped into the spectral domain via a spectral admittance function Z(ℓ), calibrated on the elastic thin-shell model of Banerdt [5], yielding the tectonic observable Wobs. The combined inversion :
G; H; Wobs (1)
is regularized with a minimal amplitude spectral filter.
Our results recover a crustal structure broadly consistent with Wieczorek and et al. [6], which we take as a useful sanity check. More interestingly, the deformation patterns we obtain are spatially coherent with the major tectonic provinces of Mars (see Figure 2). Extensional strain clusters around the Tharsis volcanic rise and its graben systems, while compression appears in parts of the southern highlands. Recovered strain amplitudes stay below ε ≲ 4 × 10⁻³, which is physically reasonable for a brittle upper crust.
Taken together, these results suggest that tectonic data can be quantitatively folded into planetary inversions. We think this is a promising direction, not just for Mars, but for any one-plate body where ancient surface deformation has been preserved [7].
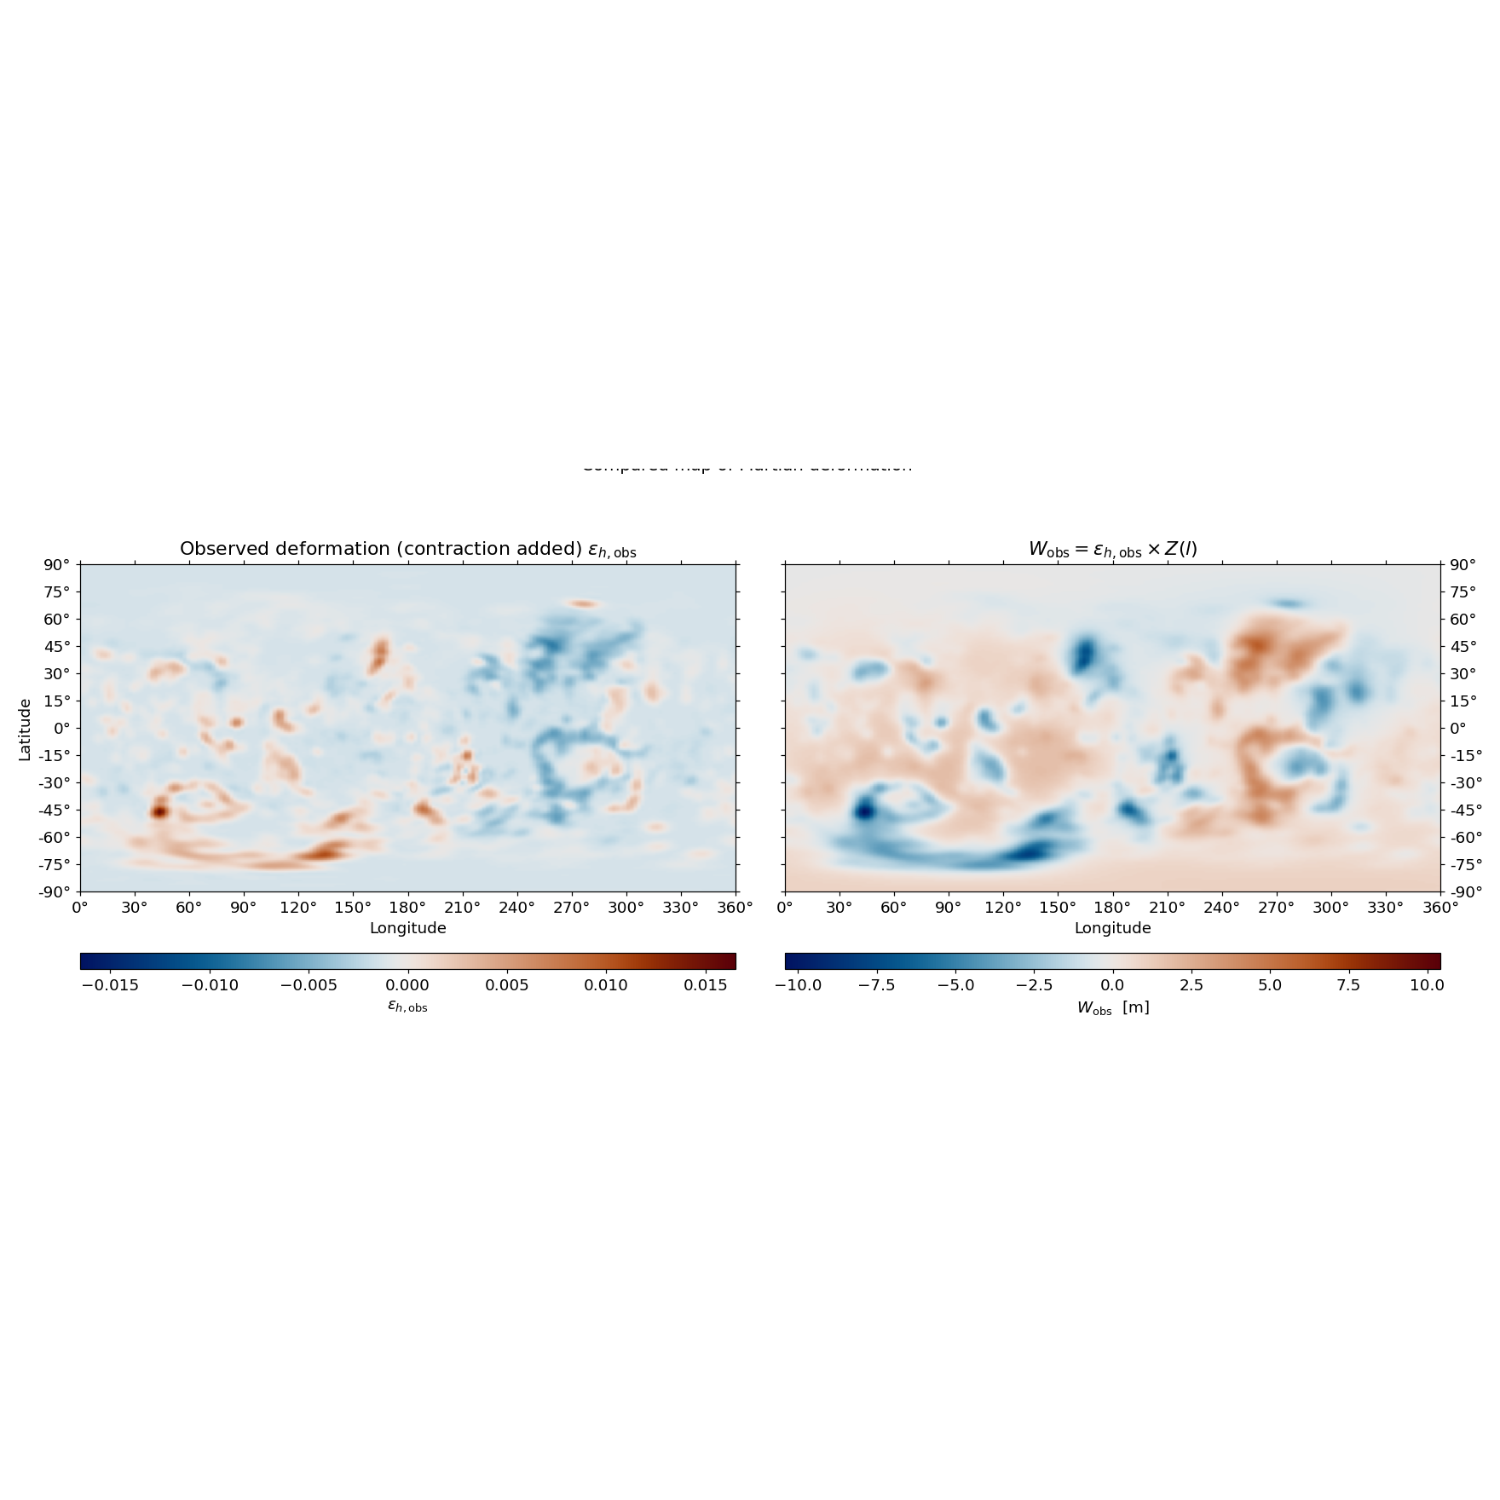
Fig 2: Comparaison of observed deformation
[1] J.C. Andrews-Hanna and A. Broquet. The history of global strain and geodynamics on mars. Icarus,
395 :115476, 2023. doi : https://doi.org/10.1016/j.icarus.2023.115476.
[2] Mark A. Wieczorek and Maria T. Zuber. Thickness of the Martian crust : improved constraints from
geoid-to-topography ratios. Journal of Geophysical Research : Planets, 109(E1) :E01009, 2004. doi :
10.1029/2003JE002153.
[3] M. Knapmeyer and et al. Working models for spatial distribution and level of Mars’ seismicity. Journal
of Geophysical Research : Planets, 111(E11) :E11006, 2006. doi : 10.1029/2006JE002708.
[4] Jeffrey C. Andrews-Hanna. The tectonic architecture of wrinkle ridges on Mars. Icarus, 351 :113937,
2020. doi : 10.1016/j.icarus.2020.113937.
[5] W. B. Banerdt. Support of long-wavelength loads on Venus and implications for internal structure.
Journal of Geophysical Research, 91(B1) :403–419, 1986. doi : 10.1029/JB091iB01p00403.
[6] Mark A. Wieczorek and et al. InSight constraints on the global character of the Martian crust. Journal
of Geophysical Research : Planets, 127(5) :e2022JE007298, 2022. doi : 10.1029/2022JE007298.
[7] Thomas R. Watters. A case for limited global contraction of Mercury. Communications Earth &
Environment, 2(1) :9, 2021. doi : 10.1038/s43247-020-00076-5.
How to cite: Vidal, R. and Broquet, A.: Constraints on Martian Crustal Deformation from Joint Gravity--Topography Inversion and Tectonic Structure Analysis, Europlanet Science Congress 2026, The Hague, The Netherlands, 6–11 Sep 2026, EPSC2026-1167, https://doi.org/10.5194/epsc2026-1167, 2026.
Liquid water has shaped the surface of Mars throughout most of the planetary history. Geomorphological analysis, spectroscopic investigations to generate mineralogical surface maps, and rover measurements show evidence for outflow channels, valley networks, deltas (e.g., Fasset & Head, 2007; De Toffoli et al., 2021), sedimentary deposits (e.g., McLennan et al., 2019), hydrated minerals (e.g., Ehlmann & Edwards, 2014), cementation (e.g., McLennan et al., 2005) and mineral veins containing, e.g., manganese oxides that require water (e.g., Lanza et al., 2016). Such features, amongst many others, suggest that liquid water was present at the surface and in the subsurface of Mars throughout the Noachian and in transient episodes during the Hesperian and Amazonian (e.g., Carr & Head, 2010; Grotzinger & Milliken, 2012), which has important implications for the habitability of the planet.
Today, liquid water is generally thermodynamically no longer stable at the surface due to the low surface temperature and pressure conditions. However, liquid groundwater may still exist in the martian subsurface (Clifford et al., 2010; Stamenkovic et al., 2019). Due to limited crustal recycling on Mars, a significant amount of water may still exist today underground as ice, as liquid water, or mineral-bound in the crust. Evidence for such a global groundwater system on early Mars has been reported by Salese et al. (2019).
In this study, we perform global-scale geodynamic thermal evolution models of the interior of Mars (Plesa et al., 2018) and track the spatial variations in temperature during the thermal evolution, by solving numerically the conservation equations of mass, linear momentum, and thermal energy. Our models use an interior structure compatible with seismic data recorded by InSight (Stähler et al., 2021; Knapmeyer-Endrun et al., 2021; Wieczorek et al., 2022), a pressure- and temperature-dependent viscosity following an Arrhenius law (Hirth & Kohlstedt, 2003), and consider the effects of core cooling and radioactive decay as appropriate for thermal evolution modeling. Our models include a spatially variable crustal thickness that is modified with time by large-scale impacts, leading to crustal thinning at the impact location. The impact-induced thermal anomaly is considered in our models by using scaling laws from Melosh (1989), that relate the temperature increase at the impact location to parameters such as projectile size, velocity, and density, as well as target density.
Coupling the geodynamic evolution with large-scale impacts leads to an increase of subsurface temperature due to impact induced heating and, at the same time, a faster cooling due to a thinner crust, whose insulating effect is strongly reduced. The competition between the heating and cooling of the subsurface due to impacts will naturally affect the evolution of the subsurface temperature on Mars. Since the depth groundwater critically depends on the thermal state of the subsurface, with our models, we will test how large-scale impacts modulate the evolution of groundwater in the martian subsurface.
Future work will couple the geodynamic evolution with impact models (Manske et al., 2025) and incorporate water-rock reactions (Huber et al., 2024; Grund et al., 2025) to evaluate the overall subsurface water budget of Mars. This multidisciplinary approach will provide new insights into the formation and evolution of groundwater on Mars and its potential for supporting habitable niches in the Martian subsurface.
References:
Carr & Head (2010). “Geologic history of Mars”. EPSL.
Clifford et al. (2010). “Depth of the Martian cryosphere: Revised estimates and implications for the existence and detection of subpermafrost groundwater”. JGR:Planets.
De Toffoli et al. (2021). “Delta Deposits on Mars: A Global Perspective”. GRL.
Ehlmann, B. L. and Edwards, C. S. (2014). “Mineralogy of the Martian surface”. Annual Review of Earth and Planetary Sciences.
Fasset & Head (2007). “Valley formation on martian volcanoes in the Hesperian: Evidence for melting of summit snowpack, caldera lake formation, drainage and erosion on Ceraunius Tholus”. Icarus.
Grotzinger & Milliken (2012). “The Sedimentary Rock Record of Mars: Distribution, Origins, and Global Stratigraphy”, Sedimentary Geology of Mars, John P. Grotzinger, Ralph E. Milliken.
Grund et al. (2025). “A Mechanistic Look at the Amphibolitization of Mafic Crust: Insights From the Kråkeneset Gabbro Body, Western Gneiss Region, Norway”. Journal of Metamorphic Geology.
Hirth & Kohlstedt (2003). “Rheology of the upper mantle and the mantle wedge: A view from the experimentalists”. Geophysical Monograph Series.
Huber et al. (2024). “Pulsed fluid release from subducting slabs caused by a scale-invariant dehydration process”. EPSL.
Knapmeyer-Endrun et al. (2021). “Thickness and structure of the martian crust from InSight seismic data”. Science.
Lanza et al. (2016). “Oxidation of manganese in an ancient aquifer, Kimberley formation, Gale crater, Mars”. GRL.
Manske et al. (2021). “Impact melting upon basin formation on early Mars”. Icarus
McLennan et al. (2019). “The Sedimentary Cycle on Early Mars”. Annual Review of Earth and Planetary Sciences.
McLennan et al. (2005). “Provenance and diagenesis of the evaporite-bearing Burns formation, Meridiani Planum, Mars”. EPSL.
Melosh (1989). “Impact Cratering: A Geologic Process”. Oxford University Press, New York.
Salese et al. (2019). “Geological Evidence of Planet-Wide Groundwater System on Mars”. JGR:Planets.
Stamenkovic et al. (2019). “The next frontier for planetary and human exploration”. Nature Astronomy.
Stähler et al. (2021). “Seismic detection of the martian core”. Science.
Wieczorek et al. (2022). “InSight Constraints on the Global Character of the Martian Crust”. JGR:Planets.
How to cite: Plesa, A.-C., Wünnemann, K., John, T., and Goeppert, N.: How do large-scale impacts modulate the depth of groundwater on Mars through time?, Europlanet Science Congress 2026, The Hague, The Netherlands, 6–11 Sep 2026, EPSC2026-671, https://doi.org/10.5194/epsc2026-671, 2026.
Potential ore deposits on Mars based on studies of selected terrestrial concretions
The terrestrial concretions may be analogous to the “blueberry” concretions found on Mars by the Opportunity rover Fig.1A. We selected three types of terrestrial concretions for study:
1.Utah concretions from the Dakota Formation (Cretaceous period ), 2. Utah Navajo Formation concretions (Jurassic), 3. Romanian „Trovants”- gigantic concretions up to 4.5 meters in diameter (Miocene- Neogene) Fig.1.
These analogs were examined using X-ray (Microprobe and EDS) and microscopic techniques to determine their mineralogical composition. One of the key findings was the presence of elements such as copper, as well as iron oxides and sulfides, in the terrestrial analogues, indicating a high degree of mineralization. Correspondingly, MiniTES data revealed spectral signatures consistent with ore-related minerals such as e.g. pyrite, ilmenite, hematite, and jarosite. These minerals are known indicators of metal ores, including copper, gold, and silver, i.e. elements important for future exploitation. The analyzed Martian APXS data indicate the dominance of iron sulfate (jarosite), iron oxides (hematite) and magnesium sulfates (epsomite, kiezerite), as well as the presence of chlorides (halite, sylvite, bischofite).
Fig.1 A. Martian spherules. Microscopic Imager (MI) camera. Visible spherules on the surface - sol 319. B. Utah spherules from the Dakota Formation, with leached iron oxides. Visible spherules fused due to mineralization and single ones. Spherule diameter about 1 cm. C. Moqui marbles spherules from the Navajo covered with iron oxides. Spherule diameter about 4-5 cm. D. Fragment of the Romanian Trovant concretion. E. Deposited Romanian gigantic Trovant concretions in Costesti, Trovanti Museum Natural Reserve. Photos B, C, D - Natalia Zalewska. E- picture from Geologyin (https://www.geologyin.com/2018/04/the-mysterious)
Metodology
Measurements were made using X-ray spectroscopy with energy dispersion -EDS on a Bruker spectrometer. The samples were analyzed in their entirety without fragmentation. As a result of the analysis, we obtained a spectrum of elements that make up the concretion minerals. Magnification pictures of the internal structure of the concretions were taken on a Sigma UP Zeiss microscope. For the microprobe analyses at University of Warsaw, thin sections were prepared from selected concretions. Each measurement point was identified using the Zeiss Auriga scanning electron microscope Fig.2
Results
A chemical and process comparison indicates significant differences between the Martian sulfate system and its terrestrial analogues, but also shares many common features. Data from Meridiani Planum correlate best with the Navajo Formation concretions, where iron occurs as oxides in a siliceous-clay matrix, and diagenetic processes lead to the formation of concretion structures.
Concretions from the Navajo Sandstone, which are considered terrestrial analogs of similar concretions observed on Mars, were found to contain high concentrations of copper and tin. Energy-dispersive spectroscopy (EDS) analyses revealed copper (Cu) contents of 44.78 and 53.15 wt.%, with corresponding tin (Sn) contents of 8.49 and 11.13 wt.%. In addition, six electron microprobe analyses of these concretions showed even higher concentrations, ranging from 78 to 85 wt.% Cu and 13 to 16 wt.% Sn, Fig.2.
These results indicate the presence of Cu–Sn-rich mineral phases within the concretions and demonstrate that the Utah occurrences provide an important geochemical analog for Martian concretions. If similar mineralized concretions occur on Mars, they may represent indicators of hydrothermal and ore-forming processes and could serve as pathfinders for other economically significant metal deposits, including gold and silver, in the Martian subsurface.
Fig 2. A.„Moqui Marbles”, hematite, goethite concretions, from the Navajo Sandstone of southeast Utah. Tightly packed, consolidated quartz grains with mineralization in addition to iron oxides, copper and tin minerals. Microscope Sigma VP Zeiss. Top square- A cut Moqui Marble. A spot measurement was taken on a white mineral. The result indicates high Cu and Sn content. B. Data from detector EDS Bruker, X Flash 6I10. C. Scanning electron microscope images (ZEISS AURIGA 60, Faculty of Geology, University of Warsaw) of thin plates from terrestrial spherules.. Navajo Formation concretion, A spot measurement was taken on a white mineral. The result indicates high Cu and Sn content.
Conclusion
Our results suggest that both the Martian environment and its Earth analogues may harbor conditions favorable for ore mineral formation. This has significant implications for the planning of future missions to Mars, particularly in the context of identifying potential sites for resource extraction. The results suggest that at least some of the concretions in Meridiani Planum may have formed through low-temperature ore-related processes, analogous to those observed in terrestrial settings. This supports the hypothesis that ancient Martian environments may have hosted localized hydrothermal systems or prolonged groundwater circulation favorable to increase metal concentration. As such, these findings strengthen the case that the Martian subsurface could have supported formation of complex mineral structures and also geochemical processes conducive to the accumulation of potentially economically valuable resources.
Acknowledgments: This work was supported by grant no: 852-3-17-12 FBW N. Zalewska TT/407 by statutory project of Space Research Center PAS. The authors would like to thank the Space Research Centre PAS for the support during research.
References: [1] Chan, M., et al., (2005) GSA Today, 15, 8, pp. 4-10. [2] Fan, Ch., et al., (2010) Planet. Space Sci., 58, pp. 401–410. [3] Busigny, V., and Dauphas, N., (2007) Earth and Planet. Sci. Let., 254, pp. 272–287. [4] Potter, S., and Chan, M., (2011) Geofluids, 11, pp. 184-198. [5] Manea, V.C., et al. (2023) (Médici, E.F., Otero, A.D., eds) Album of Porous Media. Springer. [6] Zalewska N. and Czechowski, L. (2023) LPSC 54th, Abstract # 2932 [7] Zalewska N. and Czechowski, L. (2025) EPSC Abstracts, 18, EPSC-DPS2025-1125. [8] Zalewska, N. and Czechowski, L. (2025) Remote Sens., 17, 1981. [9] Squyres, S.W. et al. (2004) Science, 306, pp.1709–1714. [10] Rieder, R. et al. (2004) Science 306, 5702 pp. 1746-1749. [11] https://www.geologyin.com/2018/04/the-mysterious-
How to cite: Zalewska, N., Czechowski, L., Ciążela, J., and Marciniak -Maliszewska, B.: Potential ore deposits on Mars based on studies of selected terrestrial concretions, Europlanet Science Congress 2026, The Hague, The Netherlands, 6–11 Sep 2026, EPSC2026-684, https://doi.org/10.5194/epsc2026-684, 2026.
The search and utilization of water ice is imperative for future Mars missions, underpinning life support, food production, propellant manufacture, and radiation shielding. Impact craters that host alluvial fans are key archives of Mars’ hydrologic transition and may also be prime subsurface water ice reservoirs. This study assesses their potential as accessible, high-volume water-ice “hotspots”.
Martian global surveys identify hundreds of craters with alluvial fans and deltas (314 craters, 890 fans, 206 fan-hosting craters; 1501 fan-shaped deposits in total), mostly Hesperian-Amazonian in age and concentrated from ~40ºN to 54ºS, especially in mid-latitudes and along the dichotomy boundary (Wilson et al., 2021; Morgan et al., 2022; Mondro et al., 2022). These fans record late-stage, often snowmelt fluvial activity under cold, generally arid climates (Wilson et al., 2021; Zhang et al., 2023). Many such basins coincide with regions of known or inferred excess ice, including mid-latitude mantles and basin-fill deposits (Wright et al., 2024; Dundas et al., 2022; Li et al., 2022).
Impact created structures strongly favor subsurface storage. Noachian-Early Hesperian craters and their basin fracture systems are proposed to dominate the ancient highland structural fabric and to have “groundwater enriched” and/or ice-rich zones that became trapped within a thickening cryolithosphere, wherever ground ice has been stable (Rodriguez et al., 2005). Hydrocode simulations show basin-forming impacts on Mars can generate several percent new porosity to depths of several kilometers and out to hundreds of kilometers from the impact, establishing enduring, fractures controlling fluid pathways and storage (Wiggins et al., 2022). Seismic studies further indicate a highly fractured, water-saturated upper and mid-crust capable of storing volumes equivalent to hundreds of meters to >1km of global equivalent layer (GEL), with porosity localized in fractures and crustal bedrock (Wright et al., 2024; Sun et al.,2025). Collectively, these results imply that impact fracture networks provide both the necessary porous host and permeable conduits to sequester large volumes of water and ice.
Building on this framework, the present work integrates a global catalog of 890 intracrater alluvial fans (Wilson et al., 2021) with impact-generated basin fractures and porosity concepts to evaluate fan-hosting craters as hydrologic “refugia” (Rodriguez et al., 2005; Wiggins et al., 2022; Cockell et al., 2024). Post-Noachian fans show strong equatorward flow biases in mid-latitudes, consistent with orographic cold-trap behavior where pole-facing rims accumulate snow and frost that subsequently melt and infiltrate beneath the surface. In this concept model, (i) Late Noachian surface water percolated downwards through the dense network of impact fractures before the upper crust cooled and froze (Sun et al., 2025), and (ii) later Hesperian-Amazonian alluvial fan development supplied additional meltwater that became trapped as ice within crater-floor and wall-fractures, analogous to groundwater enrichment of buried craters in the cryolithosphere (Rodriguez et al., 2005; Wilson et al., 2016). Large, ice-related subsidence and depressions in icy terrains (Jones et al., 2010; Sokołowska et al., 2024), ice-exposing impacts at 35ºN (Dundas et al., 2022), and orbital radar-inferred decameter-thick excess ice bodies (volumes of about 104 km3) in mid-latitude basins (Wright et al., 2024) demonstrate that such impact basins can host substantial excess water ice.
To translate this qualitative picture into quantitative reservoir estimates (volumetric modeling), this study applies fracture-reservoir concepts from terrestrial analogs, where storage and longevity depend on fracture aperture distributions, connectivity, and the balance between high-permeability conduits and more diffuse damage zones. On Mars, simple and complex craters dominate total impact-fracture surface area and volume, vastly increasing potential space for fluid to percolate (Cockell et al., 2024; Wiggins et al., 2022). By combining alluvial-fan inventories, crater geometry, impact-induced porosity scaling, and available radar/topographic constraints, fracture volumetric modelling is used to estimate both bulk ice volumes and the potentially accessible fraction within fan-hosting basins.
This framework highlights intracrater alluvial-fan systems as double interest targets: they preserve paleoclimate records of Late Noachian through Amazonian aqueous activity, and due to impact-generated porosity and cold-trap accumulation, may overlie large, stratified reservoirs of large volumes of stored water ice sourced from both ancient oceans/lakes and younger alluvial fan percolated meltwater. Future radar sounding, seismology, and drilling focused on these craters could therefore simultaneously test models of impact-controlled hydrology, quantify storage volumes of ice, and identify accessible near-surface in-situ water resources for exploration.
How to cite: Centeno, L. and Foing, B.: Impact Craters as Hydrologic Refugia: Quantifying Subsurface Water-Ice Volumes in Martian Alluvial-Fan Hosting Basins using Terrestrial Analogues, Europlanet Science Congress 2026, The Hague, The Netherlands, 6–11 Sep 2026, EPSC2026-380, https://doi.org/10.5194/epsc2026-380, 2026.
To optimize traditional digital terrain model (DTM) generation methods, we are currently utilizing data from Mars, focusing on Oxia Planum, the landing site of the ExoMars mission [1]. This region is particularly suitable due to its extensive multitemporal coverage, essential for landing site planning and ideal for evaluation. Specifically, it allows us to assess how increasing the number of overlapping datasets enhances the quality of co-registration, signal-to-noise ratio (SNR) improvement, and densification of the 3D point cloud resulting from stereo matching.
Before ExoMars’ suspension, high-resolution DTMs of Oxia Planum had already been generated using data from current Mars-orbiting camera systems [2,3]. These SPG-derived DTMs [4] used HRSC [5,6] data based on MOLA. Subsequently, machine learning-based height estimation techniques were employed to produce DTMs of varying resolutions using HRSC, Context Camera (CTX) [8], Colour and Stereo Surface Imaging System (CaSSIS) [9], and High Resolution Imaging Science Experiment (HiRISE) [10] data [2,3]. Further refinement was achieved through super-resolution techniques, yielding even higher-resolution DTMs of the region [3].
Five years later, additional CTX and HiRISE datasets of the region have been acquired, motivating us to generate a new SPG-based CTX DTM, which will later be refined using multi-view Shape-From-Shading (SFS) techniques. We are confident that the significantly increased multitemporal coverage, particularly with CTX data, will enable improved co-registration and bundle adjustment quality. Consequently, this will not only enhance the overall robustness of the DTMs but also reduce height offsets in overlapping SPG DTMs, mitigate artefacts, increase the density of the triangulation-based 3D point cloud, and improve the SNR.
We have co-registered almost 100 of the approximately 300 CTX swaths covering the broader landing site area. Following our previous work on DTM generation for Ceres [11], we manually register each individual image, or, in the case of CTX data, each swath. For this purpose, we developed a custom tool for the Integrated Software for Imagers and Spectrometers (ISIS) that automatically generates equidistant ground control point (GCP) networks based on reconstructed SPICE information (CK (Camera Kernel) and SPK (Spacecraft and Planet Kernel)) data. These GCPs are then manually registered to the HRSC Level 5 orthomosaic using the ISIS qtie function. The process is iterative: in the first step, all nadir and slightly off-nadir CTX swaths are co-registered. The orthomosaic derived from these bundle-adjusted CTX swaths then serves as a new baseline to refine the registration of individual GCPs in the second step. Currently, we are in the third iteration, now incorporating off-nadir data.
Using the ISIS integrated function jigsaw [12], we achieve bundle adjustment results for nadir and slightly off-nadir data with sigma0 values of 0.25 or better, reducing latitude and longitude offsets of map-projected swaths to sub-half-pixel accuracy. During the bundle-adjustment, we solve for CK and SPK angles, their angular velocities, and accelerations. As expected, data acquired at higher emission angles currently exhibit slightly higher sigma0 values (0.3–0.6) due to the increased influence of the lower resolution of the underlying DTM. However, we anticipate that these sigma0 values will converge toward those of the nadir data once we use our newly generated CTX DTM for SPICE initialization in the final bundle adjustment.
While the manual registration process is time-consuming, the results are transparent, reproducible, and easily usable by other ISIS users who wish to generate their own DTMs or perform bundle adjustments on CTX data. We plan to publish the corresponding GCP network files alongside the final data products.
An additional benefit of reducing lat/lon offsets through precise registration is the enhanced SNR for orthomosaic generation or even super-resolution reconstruction. The resulting higher-resolution CTX orthomosaic is expected to facilitate the co-registration of HiRISE data with resolutions of approximately 0.25 m/px.
Preliminary visual results of the co-registration quality are shown in Figures 1 and 2. For the brightness-calibrated and controlled orthomosaic, we used 50 CTX nadir swaths. The camera shading effect or frown effect [13] was corrected using our own algorithms, and the average brightness of individual swaths was calibrated to a value of 0.1. In Figure 2, we present detailed views of a 2.28 km crater, demonstrating that the mosaic, generated from multiple overlapping CTX swaths, exhibits no misregistration-induced ghosting effects. Moreover, even before applying super-resolution techniques, we have already significantly improved the SNR due to the highly accurate registration and bundle adjustments.
Once co-registration of all available CTX data is complete, we will proceed to compute the SPG-based DTM and subsequently the multi-view SFS DTM in the coming months. For this, we will use the Ames Stereo Pipeline (ASP) [14,15], with which we have previously achieved excellent results in generating high-resolution DTMs for Ceres [11]. Both ISIS and ASP are open-source tools, ensuring that our work remains transparent and reproducible
References
[1] Quantin-Nataf et al. 2021. Astrobiology 21(3), [2] Tao et al. 2021a. Remote Sensing 13(16), [3] Tao et al. 2021b. Remote Sensig 13(11), [4] Gwinner et al. 2016. Planetary and Space Science 126, [5] Neukum and Jaumann 2004, [6] Jaumann et al. 2007. Planetary and Space Science 55(7-8), [7] Smith et al. 1999. Science 284, [8] Malin et al. 2007. Journal of Geophysical Research: Planets 122(E5), [9] Thomas et al. 2017. Space Science Reviews 212, [10] McEwan et al. 2007. Journal of Geophysical Research 112(E5), [11] Neesemann et al. 2025. Remote Sensing 17(3), [12] Edmundson et al. 2012. ISPRS XXII, [13] Walter et al. 2024. Earth and Space Science 11(2), [14] Beyer et al. 2018. Earth and Space Science 5(9), [15] Alexandrov and Beyer 2018. Earth and Space Science 5(10).
Figure 1: Bundle-adjusted, brightness-calibrated CTX orthomosaic of Oxia Planum using 50 co-registered nadir/off-nadir swaths (sigma0 ≤ 0.25). Residual lat/lon offsets are sub-half-pixel. Figure 2 provides zoomed-in quality assessment.
Figure 2: Registration quality and SNR increase demonstrated on a 2.28 km crater (17.75°N/23.94°W) in Oxia Planum. a,b,e,f,h,j: Bundle-adjusted orthomosaic (26 swaths) showing improved SNR without ghosting. c,d,g,h: Original CTX image (U06_073375_1981_XN_18N024W).
How to cite: Neesemann, A. and van Gasselt, S.: High-Resolution DTM Generation for the ExoMars Landing Site: Advances in Co-Registration, SPG, and Multi-View SFS DTM Processing, Europlanet Science Congress 2026, The Hague, The Netherlands, 6–11 Sep 2026, EPSC2026-1264, https://doi.org/10.5194/epsc2026-1264, 2026.
Introduction
NASA's Mars Reconnaissance Orbiter (MRO [1]) has been in operation for over 20 years, with a suite of instruments allowing a detailed study of martian surface and subsurface, most notably the High Resolution Imaging Science Experiment (HiRISE [2]), which offers the highest spatial resolution in the history of martian orbital imagery - down to 25 cm/px. Numerous sites have been photographed more than once, either by chance, for the sake of generating stereopairs for local digital elevation models, or for other contextual investigations of planned rover landing sites or locations of interest [3]. This can be advantageous for researching periglacial, eolian, mass wasting or other active surface processes on Mars[4-5]. However, due to geometrical effects, such as observation emission and phase angle differences, georeferencing cannot provide sufficiently accurate information to align such high resolution images in geospatial software, which hinders efficient studies based on comparing such images. Although computer vision algorithms for aligning images based on keypoint matching have been known for a long time, they had not yet been leveraged to alleviate this issue.
HiLiner
We present to the Mars research community a newly developed desktop application, under the name of HiLiner - High resolution image aLi(g)ner. The tool allows to inspect a pair of overlapping images by means of interactive panning and zooming, with two display modes: side-by-side and overlaid on top of each other with varying opacity. The latter mode also allows the user to activate flickering, which alternates between full opacity and full transparency of the overlaid image - the most convenient feature for scanning the area in search of changes between the two images. It is also possible to adjust the color space of each image (brightness/contrast/pseudocolor) and the blending mode in the overlay case.
While the above mentioned capabilities are standard for a geospatial software, the focus of HiLiner is on alignment between the images, where several possibilities are offered. When the user decides to bind the images, alignment based on georeferencing is applied instantaneously, and meanwhile a computation of a shift dictionary is launched in the background. The algorithm recursively descends down the cached deep zoom pyramid, with which the image is represented in the software, finding corresponding tile pairs and using the SIFT algorithm [6] to infer the shift between them. The alignment is then applied as a correction to the georeferencing case which is obtained by averaging shifts inferred for the four nearest tiles to the current central pixel, in a manner analogous to bilinear interpolation, but weighted by the number of keypoints found in each tile. A significant improvement can be observed thanks to this correction, particularly in areas with a lot of detail that can serve as relevent keypoints (e. g. crater rims).
Nevertheless, in many cases a more satisfying alignment can be achieved by using a dynamic alignment mode, which performs an on-the-fly comparison of the scopes of both images currently visible in the software, and applies an optimal matching homography as a transformation on the latter. In this mode, a small delay required for the computation of the on-the-fly transformation is inevitable, nevertheless, it does not have a strong negative impact on the user flow.
Finally, it is also possible to activate a manual mode, where a user can impose additional corrections on the respective shift of images by means of mouse dragging or arrow movement. Obviously, this mode should be treated as a last resort solution, since the point of the software is to alleviate the burden of manual alignment.
To facilitate transmitting locations of observed changes to other geospatial software, we also incorporated a feature called Interest Site Manager. Regardless of the current visualization and alignment mode, the user can select and name points of interest, which can then be exported as a shapefile, sharing the coordinate reference system of the original images.
Technical aspects
The tool is open source, written entirely in Python (using the PyQt6 framework) and published on GitLab. For Linux users, a dedicated installation script is provided, which install HiLiner as a full-fledged desktop application. In particular, saved projects with a custom .hlnr extension can then be opened directly in HiLiner by double-clicking on the file. On other operating systems, the tool can be run from Anaconda Prompt after creating a dedicated environment. Projects can then still be saved and loaded from within the tool.
As an important practical note, the application folder can grow considerably in size over time, due to the need of storing cached deep zoom pyramids and shift dictionaries. If using extensively and for a broad suite of images (the same image will only be cashed once as it is saved under the folder named after a hash of its contents), it is recommended to occasionally purge these cashes, either manually in a selective manner, or by launching a dedicated cleansing action within HiLiner.
Future prospects
Development and testing of HiLiner have been specifically focused on pairs of monochrome HiRISE images. Although the abbreviated name makes a direct reference to HiRISE, the extended name High resolution image aLi(g)ner expresses a wish for usability with pairs of any kind of images both within, and outside of the realm of geospatial raster data. These capabilities have partially already been implemented - indeed, it possible to view not only monochrome, but also color or even multispectral images, and basic georeferencing alignment can be properly visualized regardless whether the resolutions of both images match or not. However, the tool has yet to be optimized for use with such other kinds of data.
Acknowledgements
This research work was funded by GeoPlaNet programme (https://geoplanet-impg.eu/).
References
[1] Zurek et al. (2007), JGR: Planets, 112.
[2] McEwen et al. (2007), JGR: Planets, 112.
[3] Kirk et al.(2008), JGR: Planets, 113.
[4] Dundas et al. (2017), Nature Geoscience, 10, 903-907.
[5] Diniega et al. (2013), Icarus, 225, 526-537.
[6] Lowe (2004), International Journal of Computer Vision, 60, 91-110
How to cite: Morawski, J., Conway, S. J., and Carpy, S.: A new tool for studying active surface processes with improved image alignment., Europlanet Science Congress 2026, The Hague, The Netherlands, 6–11 Sep 2026, EPSC2026-512, https://doi.org/10.5194/epsc2026-512, 2026.
Please decide on your access
Please use the buttons below to download the supplementary material or to visit the external website where the presentation is linked. Regarding the external link, please note that Copernicus Meetings cannot accept any liability for the content and the website you will visit.
Forward to presentation link
You are going to open an external link to the presentation as indicated by the authors. Copernicus Meetings cannot accept any liability for the content and the website you will visit.
We are sorry, but presentations are only available for users who registered for the conference. Thank you.
You have already stored your personal programme. Please decide:
the present selections with my stored personal programmemy stored personal programme with the present selections
Please decide on your access
Please use the buttons below to download the supplementary material or to visit the external website where the presentation is linked. Regarding the external link, please note that Copernicus Meetings cannot accept any liability for the content and the website you will visit.
Forward to session asset
You are going to open an external link to the asset as indicated by the session. Copernicus Meetings cannot accept any liability for the content and the website you will visit.
We are sorry, but presentations are only available for users who registered for the conference. Thank you.