
 1,3,4,2,2,6,2,2,5,2,
- 1TU Dortmund University, Image Analysis Group, Dortmund, Germany (moritz.tenthoff@tu-dortmund.de)
- 2DLR Institute of Space Research, Berlin, Germany
- 3Johns Hopkins University Applied Physics Laboratory, Maryland, USA
- 4Aix Marseille Univ, CNRS, CNES, Laboratoire d’Astrophysique de Marseille, France
- 5ESA ESTEC, Noordwijk, Netherlands
- 6Institut für Planetologie, Universität Münster, Münster, Germany
- *A full list of authors appears at the end of the abstract
Introduction
On its cruise to Mercury, BepiColombo (ESA/JAXA) performed six flybys at the innermost planet. During the fifth flyby in December 2024, the onboard Mercury Radiometer and Thermal Infrared Spectrometer (MERTIS) [1,2] acquired the first spaceborne thermal infrared spectra of the planet (spectrometer wavelength range = 7-14 μm) [3]. These data are valuable because they provide new insights into Mercury’s surface and enable the MERTIS team to better prepare for BepiColombo’s orbit science phase starting in 2027. Furthermore, the flyby's unique geometry provides illumination and viewing conditions that will not be available during the main mission. This is especially important for adapting thermal models to Mercury's emission characteristics to retrieve thermophysical properties and emissivity spectra.
Preliminary results from the flyby indicate an overall spectrally homogeneous surface, though spotted with local variations [4]. Typically, these variations follow a lunar-like pattern in which fresh craters exhibit high visible brightness and bolometric albedo, leading to proportionally lower thermal infrared (TIR) radiance. However, we also identify anomalous regions where reduced visible radiance coincides with decreased TIR emission. This unexpected thermal behavior challenges standard thermophysical modeling, leading us to identify bolometric emissivity as a critical parameter in explaining these distinct regions.
Methods
Mercury’s rough surface leads to anisotropic thermal emission that cannot be adequately modeled by a simple blackbody assumption. We are currently investigating and comparing different thermal roughness models that utilize either bowl-shaped craters [5,6,7] or fractal surfaces [8,9]. In this work, we utilize the fractal roughness model of [9] to retrieve apparent emissivity maps. The three main model parameters are the bolometric directional-hemispherical albedo Adh, the bolometric hemispherical emissivity εh, and surface roughness, characterized by the RMS slope θ. To highlight deviations in the thermal emission behavior, we fix Adh = 0.08, derived from MESSENGER MDIS data [10]. We fit the remaining model parameters to the measured radiance assuming unit emissivity at the Christiansen feature. The apparent (unaccounted for spatially varying Adh) spectral emissivity maps are computed by dividing the measured radiance by the model output (see Figure 1).
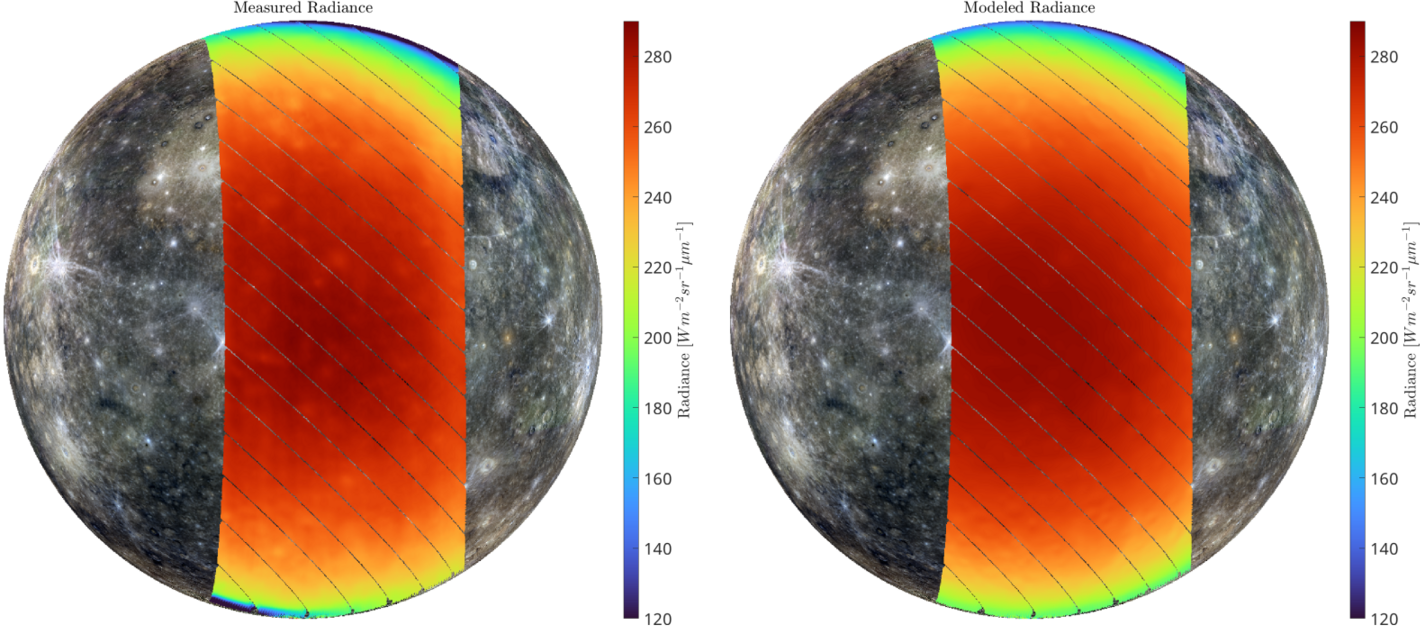
Figure 1: Measured (left) and modeled (right) radiance at 8.57 μm in orthographic projection on top of the MDIS WAC mosaic [10], center longitude = 180°.
Preliminary Results
Inverting the thermal model with Bayesian optimization yields a high surface roughness of θ ≈ 35°, consistent with lunar values (e.g. [5,9,11,12]) and a low bolometric emissivity of εh ≈ 0.75 – 0.85. The bolometric emissivity is lower compared to lunar values (εh ≈ 0.95 – 1.0). Bolometric emissivity represents the total spectral emissivity weighted across the blackbody emission curve. As Mercury’s high dayside temperatures shift this thermal emission peak to shorter wavelengths, it samples regions of lower spectral emissivity, driving down the overall εh (see Figure 2).
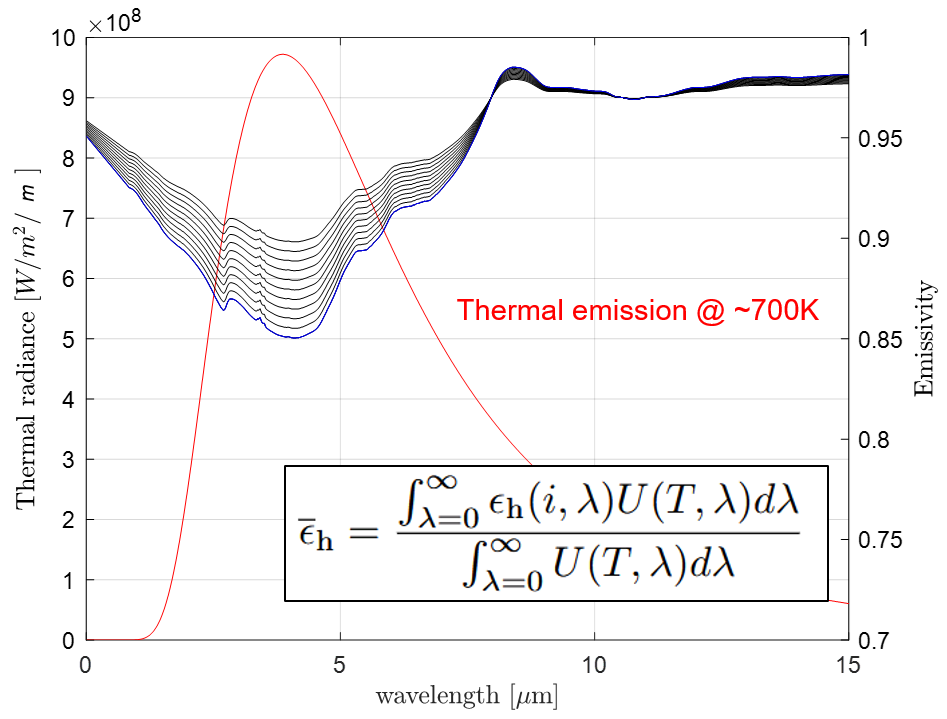
Figure 2: Simulated example silicate emissivity spectra (based on [14]) with different amounts of carbon and blackbody thermal emission at Hermean temperatures.
Figure 3 shows that the local emissivity variations appear nearly uniform across all observed wavelengths. Therefore, we focus on a single wavelength to characterize the variations. White arrows in Figure 4 highlight normal cases, where high reflectance in the visible spectrum corresponds to reduced thermal emission and thus reduced apparent emissivity. The dashed lines indicate thermal anomalies where this relationship does not hold. At Atget crater (A1 in Figure 4), reduced visible radiance coincides with decreased TIR emission, whereas Tolstoj basin (A2 in Figure 4) shows no comparable TIR response. These observations challenge standard thermophysical interpretations and instead point to variations in bolometric emissivity as the controlling factor. We investigated several possible causes of this behavior, including carbon, hypothesized to form LRM (Low Reflectance Material) [13], space weathering effects, and variations in grain size and roughness. Laboratory measurements and simulations show that adding carbon (graphite) to the mixture lowers the reflectance in the visible spectrum but has only a minimal effect on the spectral emissivity in the TIR. However, it leads to a significant increase in spectral emissivity in the 4-6 μm region (see Figure 2), thereby increasing the bolometric emissivity and decreasing thermal emission. These effects are nonlinear and might explain the different thermal anomalies.
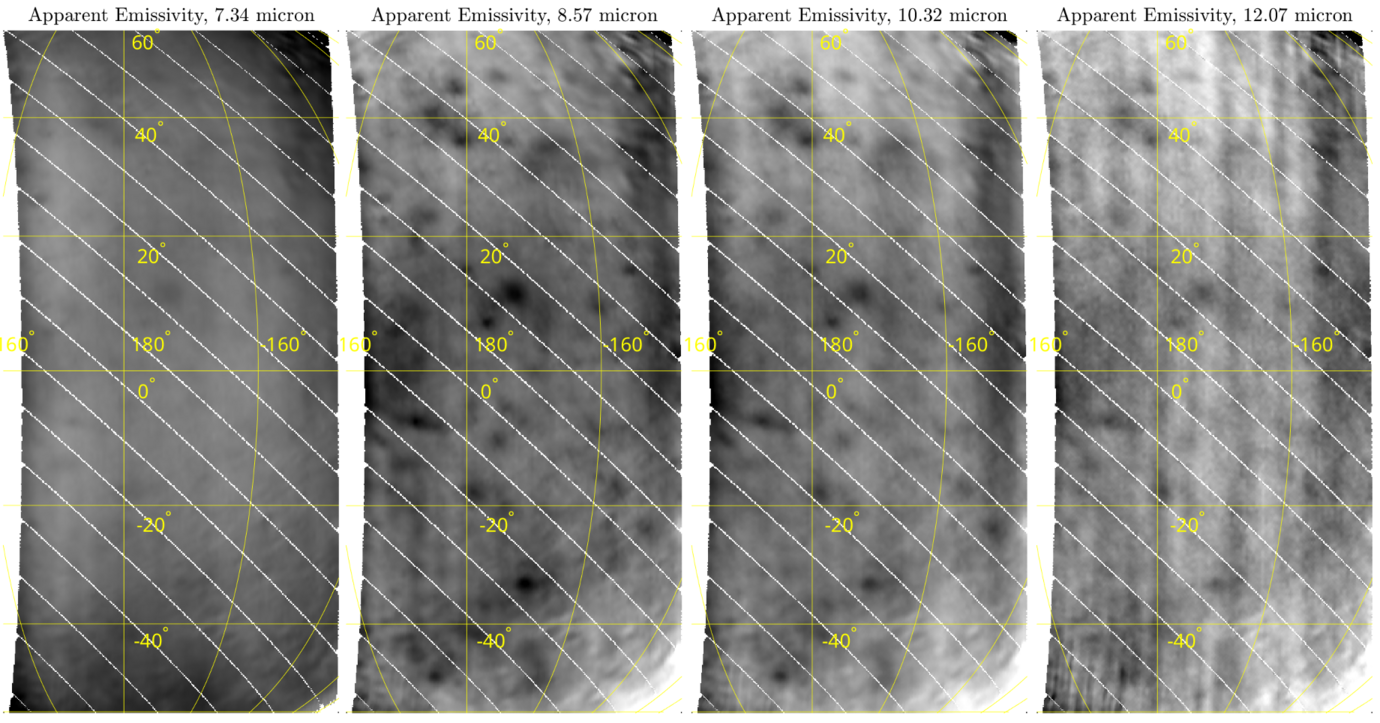
Figure 3: Apparent emissivity maps at different wavelengths, colors scaled to enhance contrast. The spatial variations appear almost uniform across bands.
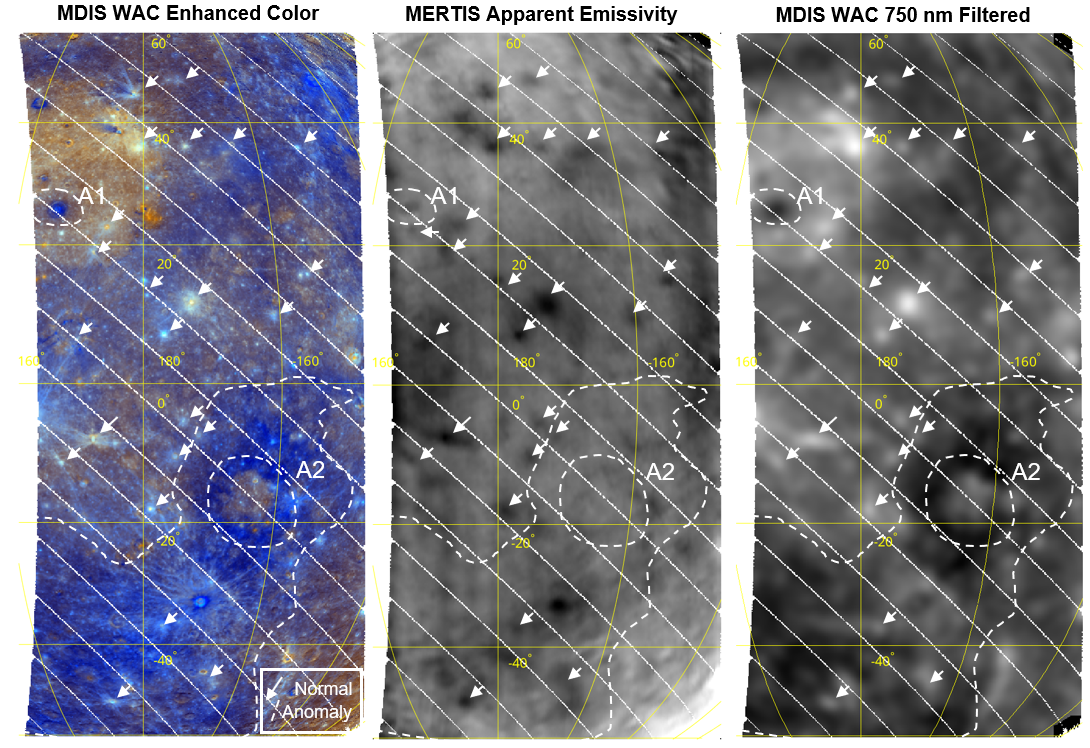
Figure 4: (Left) MDIS WAC enhanced color mosaic [10], projected to match the MERTIS observations. (Center) MERTIS apparent emissivity at 8.57 μm. (Right) MDIS WAC reflectance at 750 nm filtered to approximate the spatial resolution (≈ 30 km/pix) of MERTIS during the flyby. White arrows indicate the expected behavior, the dashed lines highlight thermal anomalies.
References
[1] Hiesinger, H., et al. 2010, Planet Space Sci. 58, 1-2, 144-165, https://doi.org/10.1016/j.pss.2008.09.019
[2] Hiesinger, H., et al. 2020, Space Sci. Rev., 216, 110
[3] Adeli, S., et al., 2025, LPSC #2501 (2025)
[4] Wohlfarth, K., et al. 2026, LPSC #1628 (2026)
[5] Jhoti, E. et al. 2026. Journal of Geophysical Research: Planets, 131, e2026JE009661. https://doi.org/10.1029/2026JE009661
[6] Powell, T., et al. 2025, LPSC #2317 (2025)
[7] Kührt, E. et al. 1992, Icarus, 96, 2, 213-218, https://doi.org/10.1016/0019-1035(92)90075-I
[8] Groussin, O. 2025, A&A, 694, A21, https://doi.org/10.1051/0004-6361/202452260
[9] Wohlfarth, K., et al. 2023, A&A, 674, A69, https://doi.org/10.1051/0004-6361/202245343
[10] B. W. Denevi et al. 2016, LPSC #1264 (2016).
[11] Bandfield, J.L et al. 2015, Icarus, 248, 357
[12] Rubanenko, L. et al. 2020, J. Geophys. Res. Planets, 125.
[13] Klima, R. L. et al. 2018, Geophysical Research Letters, 45, 2945–2953. https://doi.org/10.1002/2018GL077544
[14] RELAB Spectral Database, Brown University, 2014, https://sites.brown.edu/relab/
Aurelie Van den Neucker (2), Indhu Varatharajan (7), Nimisha Verma (2), Iris Weber (6), and the MERTIS Team
How to cite: Tenthoff, M., Wohlfarth, K., Knollenberg, J., Powell, T. M., Groussin, O., Kührt, E., Wöhler, C., Adeli, S., Barraud, O., Bauch, K. E., Benkhoff, J., Domaç, A., Greenhagen, B. T., Hamm, M., Helbert, J., Heyer, T., Hiesinger, H., Nishiyama, G., Pasckert, J. H., and Schmedemann, N. and the Hermean Emissivity and Thermophysics Working Group: MERTIS Reveals Thermal Anomalies on Mercury's Surface during BepiColombo’s Fifth Flyby, Europlanet Science Congress 2026, The Hague, The Netherlands, 7–11 Sep 2026, EPSC2026-907, https://doi.org/10.5194/epsc2026-907, 2026.


