
 1,3,2,3
- 1Department of Physics and Astronomy, University of Padova, Padova, Italy (gabriele.bertinelli@studenti.unipd.it)
- 2Department of Earth and Planetary Science, University of Tokyo, Tokyo, Japan
- 3Université Côte d'Azur, Observatoire de la Côte d'Azur, Nice, France
Abstract:
The long-term dynamical evolution of asteroid families is governed by the interplay between orbital and rotational evolution driven by thermal forces and collisions. The upcoming Vera C. Rubin Observatory's Legacy Survey of Space and Time (LSST) era will increase spin state measurements by more than an order of magnitude, enabling population-level tests of evolutionary models.
We aim to observationally trace the rotational evolution of main-belt asteroid families over gigayear timescales. We demonstrate a methodology that will scale directly to LSST datasets, enabling testing thermal evolution model and constraining asteroid family ages on large scales.
We analyzed rotational properties of 8739 asteroids with spin period measurements and 3794 asteroids with obliquity determinations across 28 asteroid families spanning ages from 14~Myrs to 3~Gyrs. We introduced a dimensionless timescale that normalizes each asteroid's family age by its classical YORP timescale, enabling a direct comparison of the rotational states across different evolutionary stages. For each asteroid we defined this quantity as t = τage\τYORP,
where τage is the age of the family, and τYORP is the normal YORP timescale [1]. This dimensionless evolutionary parameter provides a scalable metric suited to large survey datasets such as the LSST.
We examined two key observables: the fraction of slow rotators fslow (periods greater than or equal to 30 hours), and the polarization fraction fpol(the degree to which asteroid spin poles align correctly with their position in the family's V-shape distribution due to the Yarkovsky drift [2]).
Evolution of both quantities were fit to identify characteristic transition timescales. These observables are obtained from byproducts (i.e., spin vectors) of photometric light curve analysis, which is time-consuming and usually obtained for single objects. However, they are also expected products of LSST, which will provide physical characterization for thousands of asteroids every year.
We discovered that the slow-rotator fraction increases steeply with t, saturating at fslow~0.25 around t~20 (Fig. 1). This implies a stochastic YORP timescale of τYORP,stoc~10 τYORP, in comparison with the rotational evolution models that include tumbling and weakened YORP torques [3]. The result suggests that stochastic processes, driven by evolving surface features such as craters and boulders, significantly modify rotation evolution rates.
The polarization fraction reaches a maximum of ~0.8 at t~15, indicating that YORP initially dominates by driving asteroids toward extreme obliquities and enhancing Yarkovsky drift efficiency. However, the subsequent decay toward the random limit fpol→0.5 for t>20 (Fig. 2) reveals that collisional spin reorientation progressively breaks the connection between current spin states and Yarkovsky drift history. This transition marks the limit beyond which V-shape age estimates become unreliable due to partial erasure of the Yarkovsky signature, with important implications for family age dating methods.
The rotational evolution trends of fslow and fpol can be further tested with the forthcoming LSST data release, which is expected to increase the available spin-state sample by at least an order of magnitude [4]. With such datasets, these trends could provide an additional dimension for constraining asteroid family ages, and testing thermal evolution models at unprecedented statistical precision.
References: [1] Rubincam, D. P. 2000, Icarus, 148, 2 [2] Vokrouhlický, D., et al. 2015, in Asteroids IV (University of Arizona Press) [3] Zhou, W.-H., et al. 2025, Nature Astronomy, 9, 493 [4] Ivezi´c, Ž., et al. 2019, The Astrophysical Journal, 873, 111
Figures:
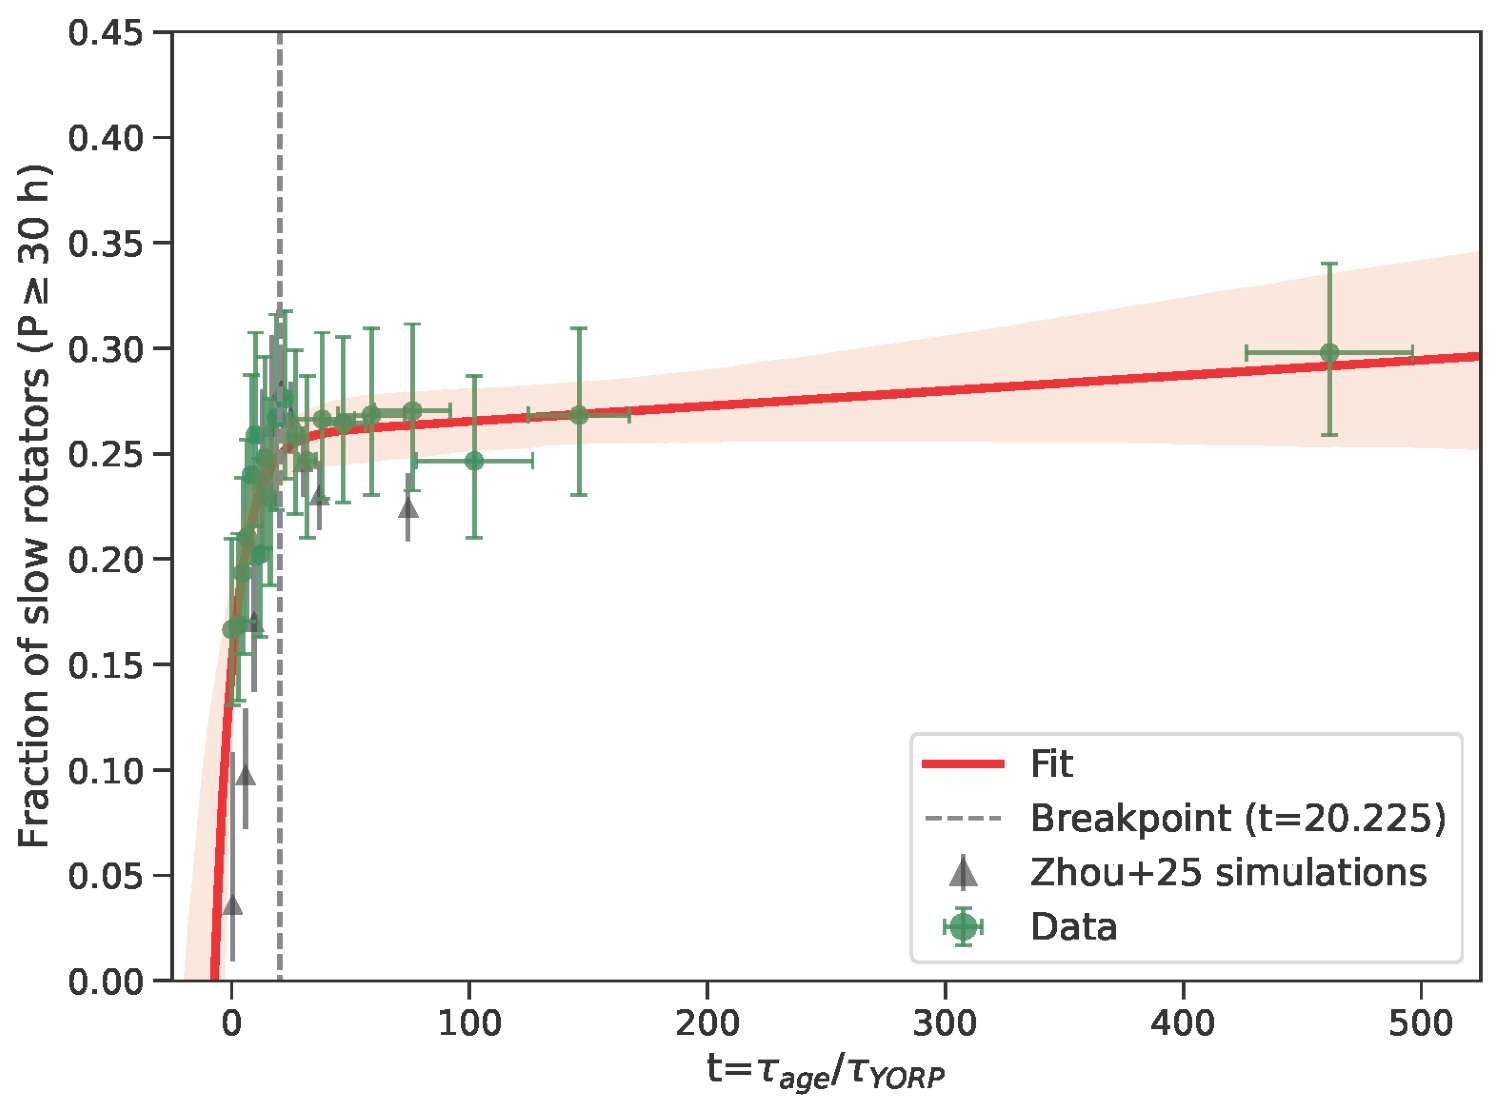
Fig. 1, Fraction of slow rotators as a function of the dimensionless time t. The green points are the binned-collected observational data. Black triangles are simulation data from the [3] model. The red line is the fit function. The shaded area is the 95% confidence interval of the fit.
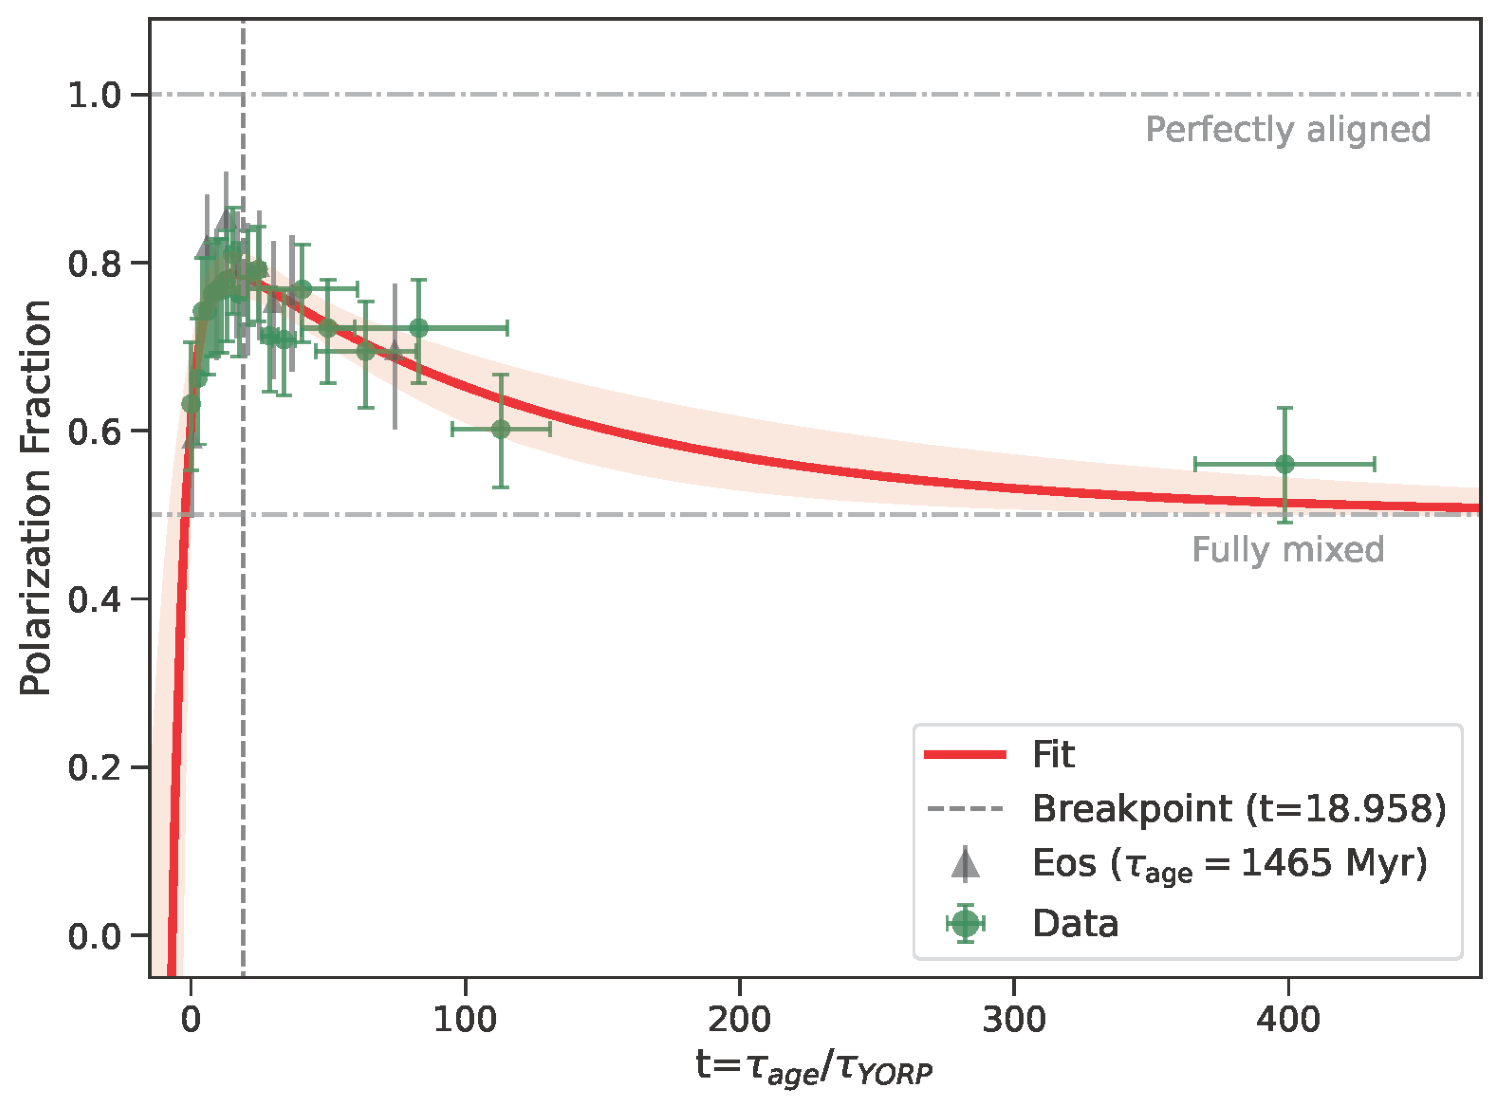
Fig. 2, Polarization fraction as a function of the dimensionless time t. The green points are the binned data; the red line is the fit function. The black triangles are the distribution of the polarization fraction for the Eos family. The general trend is visible in single asteroid families. The shaded area is the 95% confidence interval of the fit.
How to cite: Bertinelli, G., Zhou, W.-H., and Tanga, P.: Exploring rotational properties and the YORP effect in asteroid families: methodology and prospects for LSST, Europlanet Science Congress 2026, The Hague, The Netherlands, 6–11 Sep 2026, EPSC2026-91, https://doi.org/10.5194/epsc2026-91, 2026.


