
 1,2,2,3,4,
- 1NAmur Digital Institue, University of Namur - Faculty of Computer Science, Namur, Belgium (simon.lejoly@unamur.be)
- 2Royal Belgian Institute for Space Aeronomy - Planetary Atmosphere Department, Brussels, Belgium
- 3Department of Aerospace Engineering and Engineering Mechanics, University of Texas, Austin, USA
- 4SSC Space for the European Space Agency, Madrid, Spain
Introduction
The dynamics of Venus’ atmosphere around its terminator region currently remains poorly understood. The main source of temperature observations is the SOIR dataset [1], resulting from the Venus Express mission. The dataset contains 684 temperature profiles recovered through solar occultation, covering both sides of the terminator. The observations span from 2006 to 2014, amounting to an approximate 25,000 temperature points in total, observed at varying altitudes, latitudes, longitudes, and time.
Analysis of the SOIR dataset reveals a lot of variability and uncertainty in the data, both within each temperature profile and between different profiles. Identifying outliers in the dataset is a mandatory first step to extract meaningful knowledge from observations. In previous analyses, this was done manually through visual inspection. We propose a more systematic, scalable, and uncertainty-aware approach through the use of probabilistic modelling.
Probabilistic modelling of temperature profiles
As seen in Figure 1, profiles from SOIR consist of a sequence of temperature points with their respective uncertainty estimate. Therefore, each profile can be considered as an observation of a Gaussian Process (GP) at discrete altitudes. GPs are probabilistic models used for sequential data analysis, well-known for their capacity to handle uncertainty. Using a multi-task Gaussian process framework [2], we can combine multiple observed profiles to learn a single mean profile. In this experiment, we separate profiles into two groups, based on the local time of observation (either at 6 AM or 6 PM).
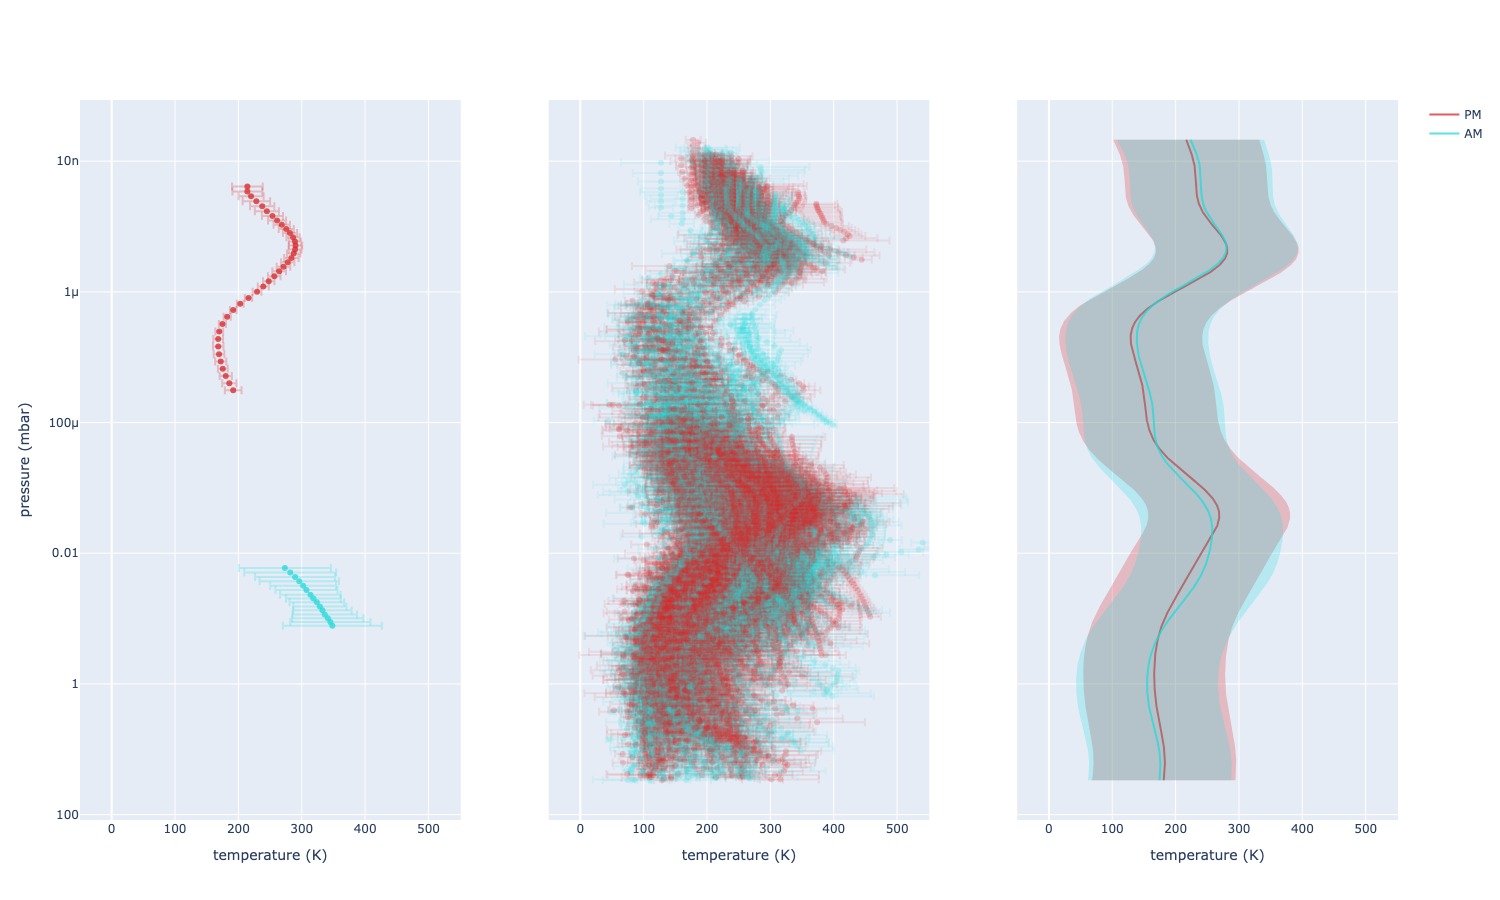
Fig. 1: Left: two profiles from the SOIR dataset, with their uncertainty estimates. Profiles from SOIR are often unaligned and have varying uncertainty estimates. Center: the whole SOIR dataset. Right: the mean profiles learnt by the multi-task GP, with 95% confidence intervals. Blue/red respectively correspond to profiles observed at 6 AM/PM local solar time.
The rationale for using GPs is that any discrete observation of a GP is a multivariate Gaussian distribution. This includes every profile from the dataset as well as our mean profiles. Therefore, we can use any probabilistic metric able to compare two Gaussian distributions to assess how each profile deviates from its corresponding mean profile. A full atmospheric profile can then be characterised by a single value corresponding to its difference with the mean profile, no matter how many temperature observations the profile contained originally. Good examples of appropriate metrics are the Gaussian negative likelihood used to train the GP, the Kullback-Leibler Divergence, and the Wasserstein distance. The more typical a profile, the lower these metrics should be. Figure 2 illustrates this with two profiles.
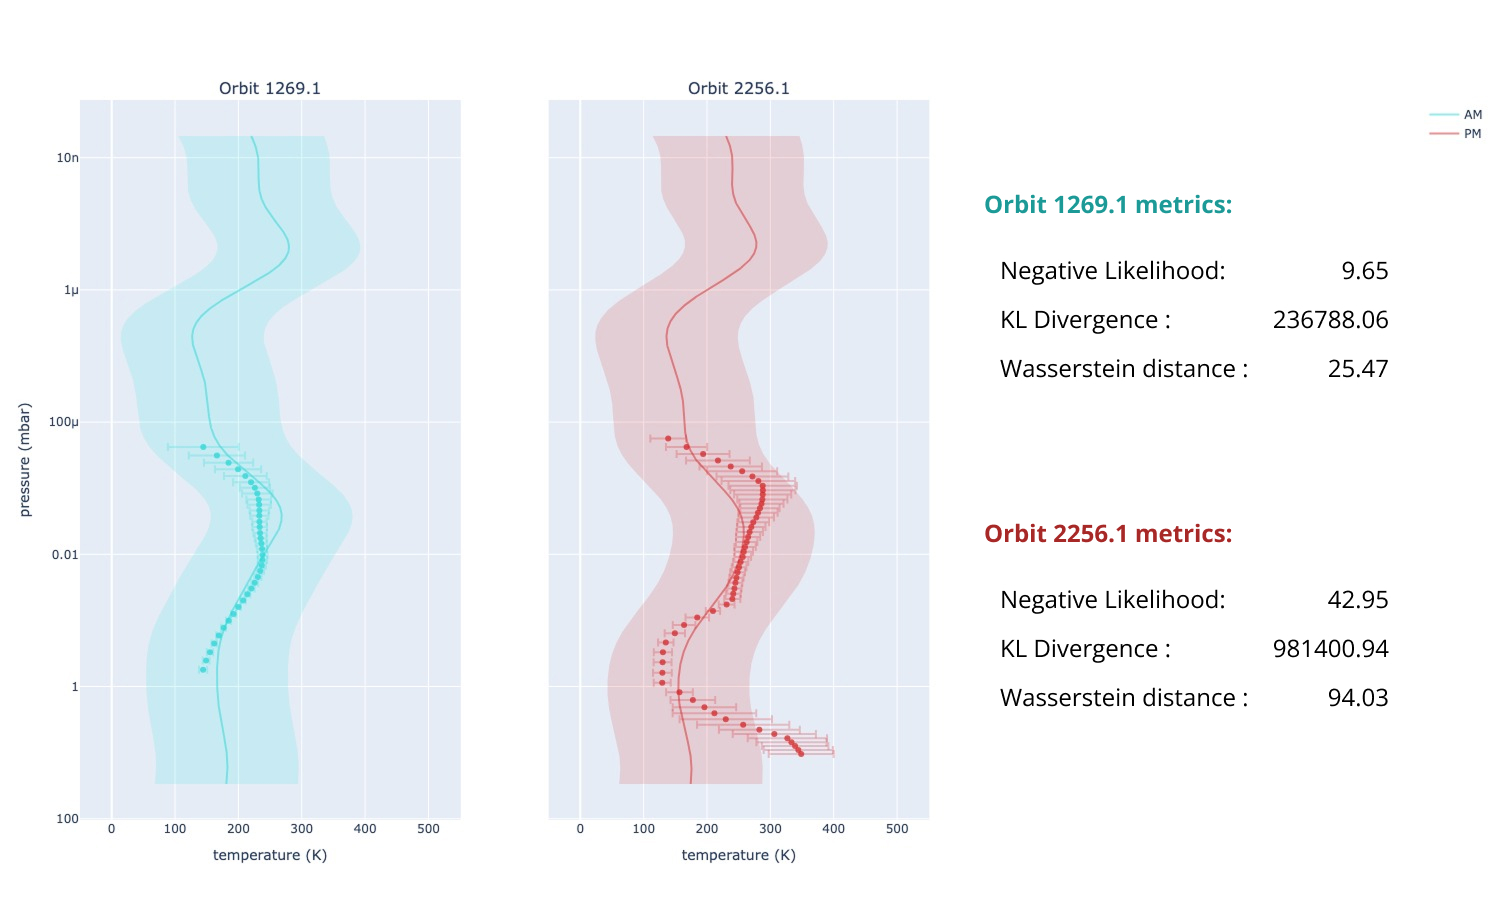
Fig. 2: Comparison of two profiles corresponding to orbits 1269.1 and 2256.1 with their corresponding mean profile. The metrics comparing each profile with its mean profile confirm that the first one is closer to the average dynamics of the atmosphere than the second one.
Identifying outliers
We can plot the whole dataset as a 3D scatter plot by using the three metrics computed for each profile, as shown in Figure 3. This representation makes it easy to identify profiles that are abnormally different from most other profiles.
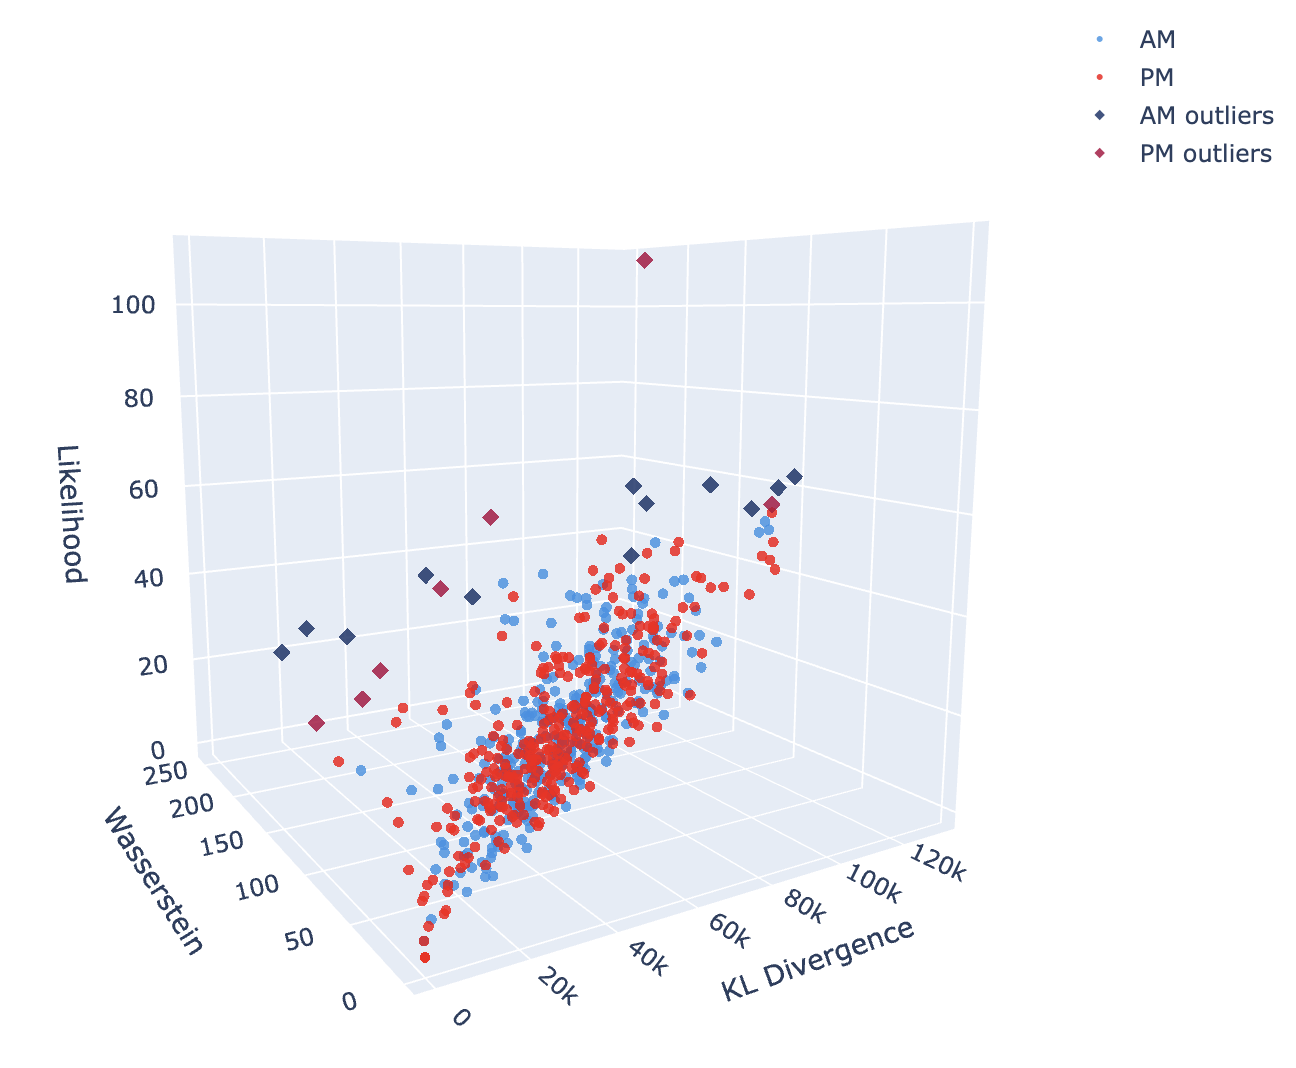
Fig. 3: Distribution of the whole SOIR dataset with respect to each metric. Each profile is represented by a single dot in 3D space. Most profiles of the dataset seem aggregated in a specific region, while outlier profiles are scattered in regions corresponding to high values of each metric.
If we remove profiles identified as outliers, we can learn a more precise estimation of the mean profiles, as shown in Figure 4. We can then iteratively alternate between phases where we compute mean profiles from the remaining profiles and phases where we identify new outliers based on the updated mean profiles.
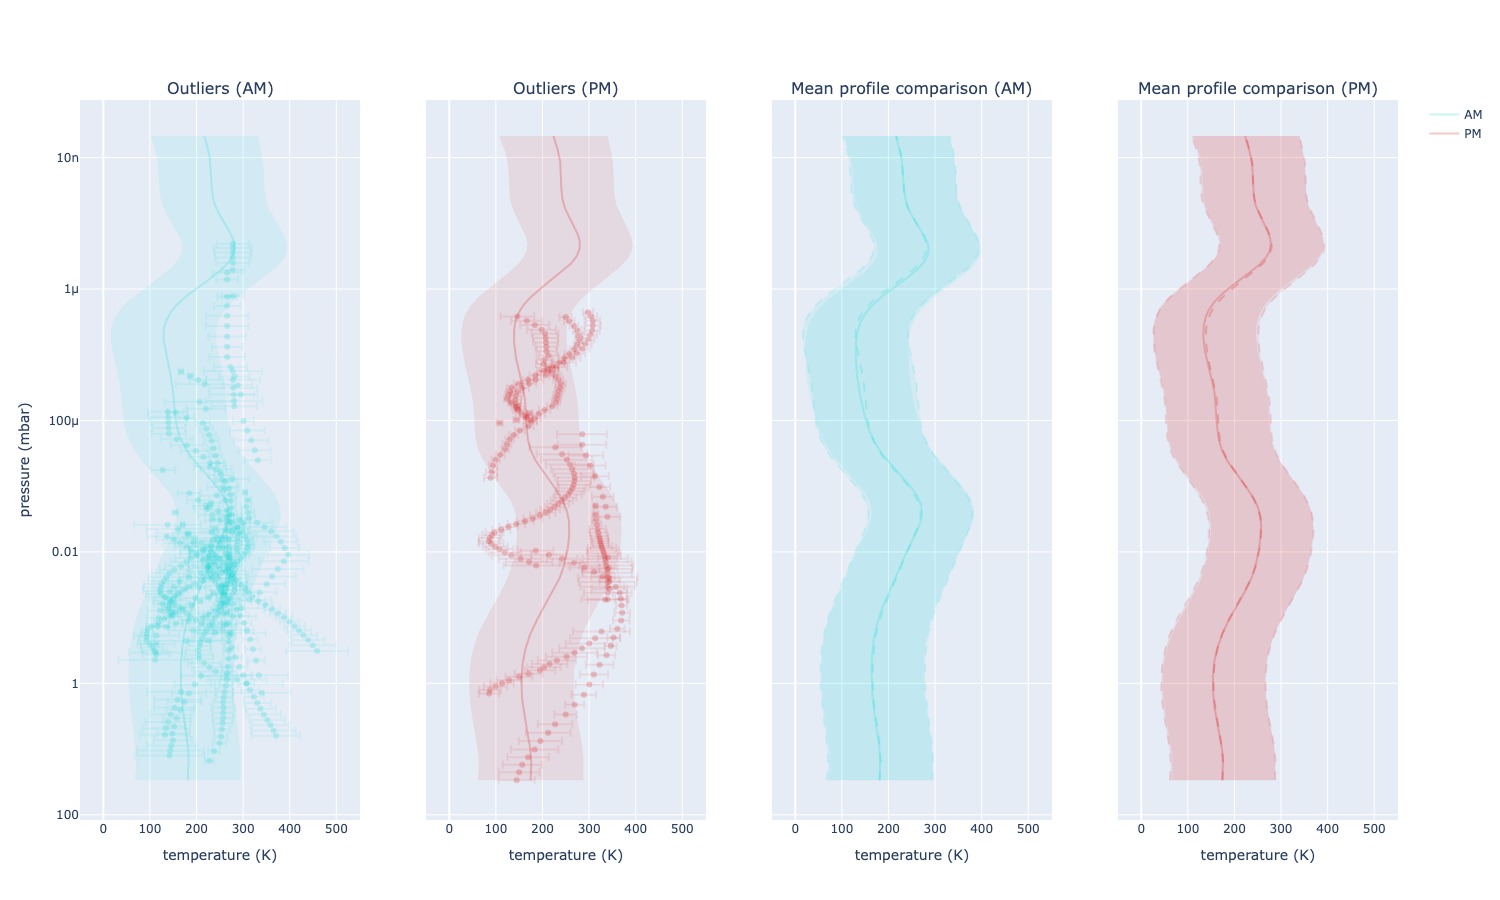
Fig. 4: Left: Outlier profiles identified for both local solar times after the first iteration of the algorithm. Right: If we remove these outliers and retrain the multi-task GP, we obtain slightly different mean profiles compared to the ones computed on the whole dataset (previous mean profiles represented with dashed lines, new mean profiles represented with full lines).
As with any framework used to identify outliers, this approach requires expert knowledge, both to identify outliers in the 3D representation of the dataset at each step and to know when to stop the procedure. However, seeing the dataset as a 3D distribution of points facilitates the process tremendously. Using metrics also eliminates possible biases and errors by providing an objective ordering of atypical profiles. E.g.: if an expert classifies a profile with neg-likelihood 50 as an outlier, then we can expect that profiles with neg-likelihood above 50 should be outliers too.
Conclusion
We propose a novel probabilistic framework to identify outliers in atmospheric profiles measured with uncertainty. By applying it to the SOIR dataset, we can both validate the methodology and provide the spatial aeronomy community with a deeper understanding of the data.
Even though we discussed the interest of removing outliers from the dataset, we must also emphasise that those outliers are not to be fully discarded. In the end, these atypical profiles may provide information about rare phenomena in the atmosphere, calibration issues in the measurement device, or regions of Venus that are under-represented in the dataset.
By providing atmospheric scientists with objective metrics and clear visualisations of the data at hand, this methodology enables easier analysis of typical profiles, as well as prioritisation of profiles worth investigating. This step is crucial to help researchers get from observation data to atmospheric knowledge.
References
- [1] Mahieux, A., Robert, S., Piccialli, A., Trompet, L., & Vandaele, A. C. (2023). The SOIR/Venus Express species concentration and temperature database: CO2, CO, H2O, HDO, H35Cl, H37Cl, HF individual and mean profiles. Icarus, 405, 115713. https://doi.org/10.1016/j.icarus.2023.115713
- [2] Leroy, A., Latouche, P., Guedj, B., & Gey, S. (2020). Cluster-Specific Predictions with Multi-Task Gaussian Processes. arXiv. https://doi.org/10.48550/ARXIV.2011.07866
How to cite: Lejoly, S., Piccialli, A., Mahieux, A., Vandaele, A. C., and Frénay, B.: Probabilistic detection of outliers in Venusian atmospheric profiles from VEx/SOIR, Europlanet Science Congress 2026, The Hague, The Netherlands, 7–11 Sep 2026, EPSC2026-913, https://doi.org/10.5194/epsc2026-913, 2026.


