
 1,2,2,
- 1Departamento de Geología, Física y Química Inorgánica, ESCET, Universidad Rey Juan Carlos, Móstoles, Madrid, Spain (alberto.jimenez.diaz@urjc.es)
- 2Departamento de Geodinámica, Estratigrafía y Paleontología, Universidad Complutense de Madrid, Madrid, Spain
- 3Departamento de Física Aplicada. Escuela Superior de Ingeniería. Universidad de Cádiz, Puerto Real, Cádiz, Spain
- 4Université Paris Cité, Institut de Physique du Globe de Paris, CNRS, Paris, France
In the absence of seismic measurements, a powerful method that can be used to probe the interior structure of Venus is the joint analysis of gravitational and topographic data (see Wieczorek, 2015a for a review). Several studies have used gravity and topography data to construct global crustal thickness maps of Venus over the past two decades (Anderson and Smrekar, 2006; James et al., 2013; Jiménez-Díaz et al., 2015; Yang et al., 2016; Zampa et al., 2018; Batov et al., 2023; Broquet et al., 2025), with differences in crustal thickness values associated with differences in the method and/or assumptions in the crustal thickness modeling. These studies found that the crustal thickness of Venus varies from 0 to >90 km. It is important to note that the assumptions in the crustal thickness modeling may lead to significant changes in the obtained results. The most important of these assumptions is the density contrast between the mantle and crust, which affects both the overall average crustal thickness as well as the amplitude of crustal variations in our model. In addition, it is required either to assume a mean crustal thickness or to anchor the inverted crustal thickness to a given value at a specific location (Wieczorek, 2015a).
For example, Jiménez-Díaz et al. (2015) constructed a global crustal thickness map assuming a mean crustal thickness of 25 km, and crust and mantle densities of 2900 and 3300 kg m-3, respectively. They found that the Venusian crust is usually 20–25 km thick with a thicker crust under the highlands. Since the crust-mantle density contrast was constrained to be 400 kg m-3 in their analysis, the assumed average crustal thickness of 25 km played an important role in the crustal thickness distribution. They found that the minimum and the maximum crustal thickness increase as the assumed average crustal thickness increases; also, the amplitude of crustal variations increases slightly with the average crustal thickness. In this study, we expand upon that work by exploring in more detail the density dependence of the crustal structure of Venus.
Global crustal thickness models were obtained from gravity and topography following the procedure described in Wieczorek and Phillips (1998) and Wieczorek (2015a). The topography and gravity data were obtained from the spherical harmonic models VenusTopo719 (Wieczorek, 2015b) and MGNP180U (Konopliv et al., 1999) respectively. The spherical harmonic coefficients have been truncated beyond degree 70 for all models.
Figure 1 shows how the assumed average crustal thickness affects the minimum and the maximum thickness of our global crustal thickness models. Furthermore, we consider the effects of the assumed density structure of the crust. Figure 2 shows the average and maximum crustal thicknesses as a function of crustal density. For each of our crustal thickness inversions, we assume a mantle density of 3300 kg m−3.
Finally, crustal plateaus, which are the largest tessera occurrences, have been proposed to be made up of differentiated crust with a continental-like composition (Romeo and Turcotte, 2008). A felsic composition for tessera terrain has been favored by infrared emissivity observations (Hashimoto et al., 2008; Helbert et al., 2008; Gilmore et al., 2015) and structural studies (Romeo & Capote, 2011; Resor et al., 2021). In order to account for lateral variations in crustal density (see Wieczorek et al., 2022), we have constructed a density model considering two densities, 2900 kg m−3 for the basaltic crust and 2800 kg m−3 for crustal plateaus considering them as felsic crust in our analysis (Figures 3 and 4). Note that we have included as differentiated crust Lakshmi Planum and the surrounding montes (including Maxwell Montes) for the purpose of discussion.
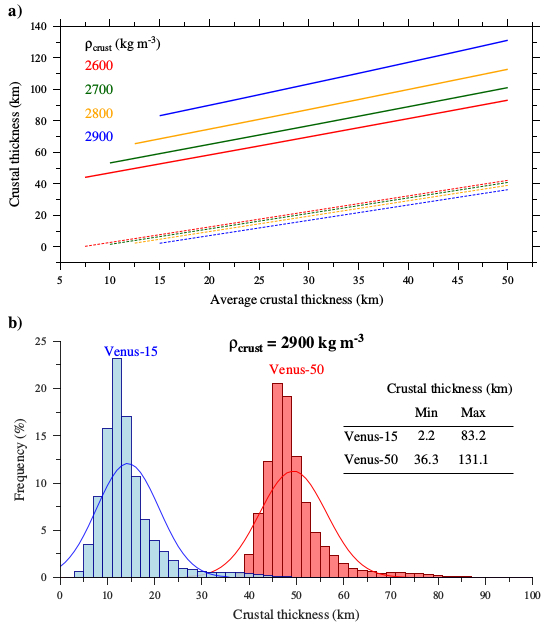
Figure 1. (a) Minimum (thin dashed lines) and maximum (thick solid lines) crustal thickness as a function of the average crustal thickness. Each colored curve corresponds to a different crustal density, ranging from 2600 to 2900 kg m−3. (b) Histograms of crustal thickness for an average crustal thickness of 15 and 50 km, respectively. For these specific models, the crustal density is 2900 kg m−3.
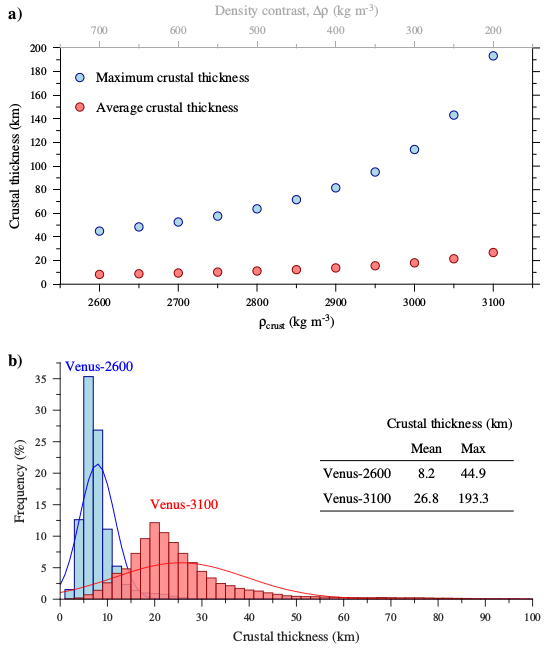
Figure 2. (a) Average and maximum crustal thickness as a function of crustal density. For this suite of models, the minimum crustal thickness is constrained to 1 km. (b) Histograms of crustal thickness for a crustal density of 2600 and 3100 kg m−3, respectively.
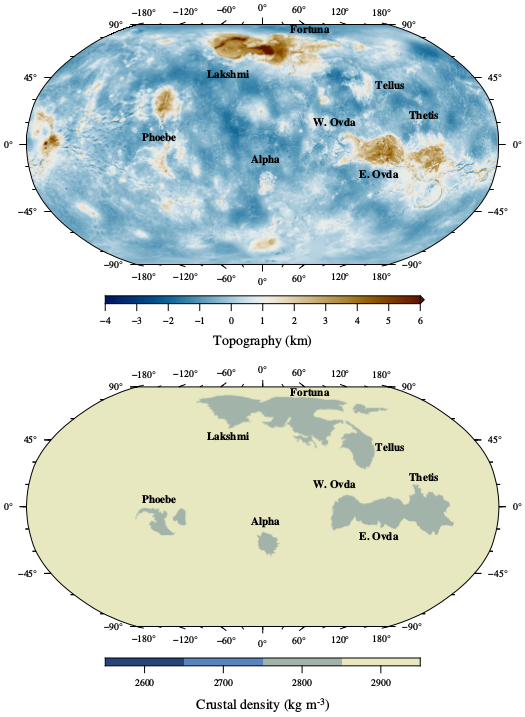
Figure 3. (a) Topography of Venus from the spherical harmonic model VenusTopo719 (Wieczorek, 2015b), referenced to the mean planetary radius. (b) Reference crustal density model.
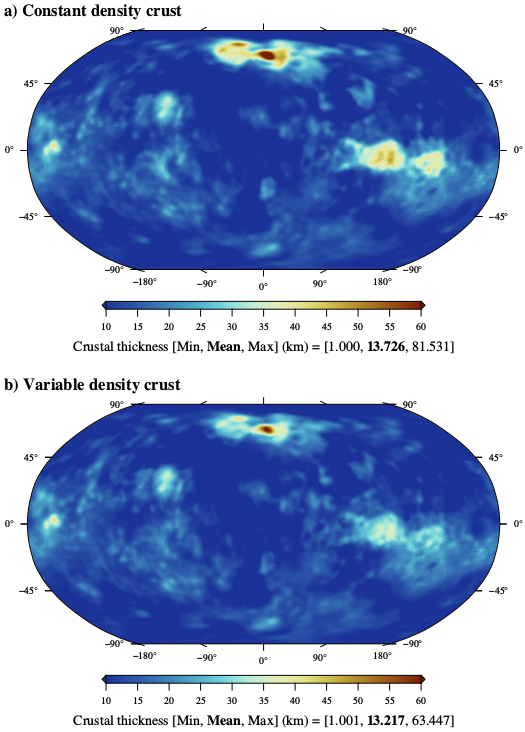
Figure 4. (a) Crustal thickness model for Venus with a constant density crust. For this specific model, the crustal density is everywhere 2900 kg m−3, the mantle density is 3300 kg m−3, and the minimum crustal thickness is constrained to 1 km. (b) Global crustal thickness model that considers a lower crustal density for the crustal plateaus (2800 kg m−3) than for the surrounding plains and lowland regions (2900 kg m−3).
References:
Anderson, F.S., & Smrekar, S.E. (2006). J. Geophys. Res., 111(E8), E08006.
Batov, A.V., et al. (2023). Sol. Syst. Res. 57, 25–34.
Broquet, A., et al. (2025). J. Geophys. Res.: Planets, 130, e2025JE009139.
Gilmore, M. S., et al. (2015). Icarus, 254, 350-361.
Hashimoto, G.L., et al. (2008). J. Geophys. Res.: Planets, 113, E00B24.
Helbert, J., et al. (2008). Geophys. Res. Lett. 35, L11201.
James, P.B., et al. (2013). J. Geophys. Res.: Planets, 118(4), 859–875.
Jiménez-Díaz, A., et al. (2015). Icarus, 260, 215–231.
Konopliv, A.S., et al. (1999). Icarus, 139(1), 3–18.
Resor, P.G., et al. (2021). J. Geophys. Res.: Planets, 126, e2020JE006642.
Romeo, I. & Turcotte, D.L. (2008). Earth Plan. Sci. Let., 276, 85-97.
Romeo, I., & Capote, R. (2011). Planet. Spa. Sci., 59, 1428-1445.
Wieczorek, M.A. (2015a). In T. Spohn & G. Schubert (Eds.) Treatise on geophysics (2nd ed.), 10, 153–193. Elsevier.
Wieczorek, M.A. (2015b). Spherical harmonic model of the planet Venus: VenusTopo719 [Dataset]. Zenodo.
Wieczorek, M.A., et al. (2022). J. Geophys. Res.: Planets, 127, e2022JE007298.
Yang, A., et al. (2016). Planet. Space. Sci., 129, 24–31.
Zampa, L.S., et al. (2018). Planet. Space Sci., 157, 48–62.
How to cite: Jiménez-Díaz, A., Álvarez-Lozano, J., Egea-González, I., Wieczorek, M. A., Romeo, I., and Ruiz, J.: Effect of crust density in global crustal thickness inversions on Venus, Europlanet Science Congress 2026, The Hague, The Netherlands, 7–11 Sep 2026, EPSC2026-953, https://doi.org/10.5194/epsc2026-953, 2026.


