
 1,2,2,4,5,
- 1IRAP, CNRS, Université de Toulouse, CNES, Toulouse, France (aurelien.stcherbinine@utoulouse.fr)
- 2LATMOS/IPSL, UVSQ Université Paris-Saclay, CNRS, Sorbonne Université, Guyancourt, France
- 3IAS, Université Paris-Saclay, CNRS, Orsay, France
- 4Space Science Institute, Boulder, CO, USA
- 5Space Research Institute (IKI), Moscow, Russia
- 6CNES, Toulouse, France
Introduction
Water ice clouds play an important role in the Martian water cycle and climate as they are a major actor in the inter-hemispheric water exchange, and impact the atmospheric structure and temperature by absorbing and scattering the incoming solar radiation [1,2 and references contained within]. Plus, we showed in [3] that the vertical structure of the clouds has a non-negligible impact on cloud optical depth retrievals performed from nadir measurements; and in [4] that the version 5 of the Planetary Climate Model (PCM) [5] tends to slightly underestimate the altitude of the water ice clouds. Thus, there is a specific need for a climatology of the vertical structure of the clouds to improve both the atmospheric models, and the nadir clouds surveys that are the main way to perform spatial and temporal surveys of water ice clouds on Mars [e.g., 6,7,8].
Data & Methods
The Atmospheric Chemistry Suite (ACS) Mid-InfraRed (MIR) channel is a high-resolution spectrometer dedicated to Solar Occultation geometry onboard the ExoMars Trace Gas Orbiter (TGO) ESA-Roscosmos spacecraft [10,11]. This observing geometry provides detailed vertical profiles of the atmospheric transmission. In this study, we use ACS-MIR observations acquired in the so-called position 12 of the secondary grating, which covers the 3.1–3.4 µm spectral range to retrieve the properties of the Martian water ice clouds from their 3 µm absorption band using the method described in [12,4].
In 2025 [9], we processed an extended dataset of ~1500 observations, and we reported on the seasonal and latitudinal variations of the Martian water ice clouds from Martian year (MY) 34 (Ls=163°) to MY 38 (Ls=72°). This dataset has now been enlarged to ~2000 observations running until the end of MY 38. The amount of data that we currently have now allows us to combine the MY to reveal the diurnal variation of the cloud’s vertical profiles between the morning and the evening terminator. Plus, we ran the version 6 of the Mars PCM up to MY 37 on the locations of our ACS-MIR observations to compare our vertical profiles with the new version of the model for several MY.
Local time monitoring
The first two columns of Figure 1 show respectively the vertical profiles of the water ice clouds reff obtained between MY 35 and MY 37, and the extinction profiles at 3.4 µm obtained with ACS-MIR during the morning (rows 1 & 3) and the afternoon (rows 2 & 4). We can see that during the first half of the year (aphelion season) the altitude of the clouds is similar between the Northern and Southern hemisphere in the midlatitudes, but in the afternoon the altitude of the clouds increases between 30°N and 60°N, while it decreases in the Southern hemisphere. Another noticeable aspect is that the extinctions are sparser during the morning hours compared to the evening around aphelion. In particular, we can see in panels d & e the presence of a 15-km thick evening layer with high extinction (kext ~ 10-2 km-1) and large water ice crystals (reff > 2 µm). This layer is located between 10°S and 40°N with an altitude ranging between 20 km and 35 km, which corresponds to the aphelion cloud belt (ACB). Then, in panel b, we can see that this layer spread within a wider range of altitude (10-40 km) in the morning.
Comparison with the Mars PCM version 6
The third column of Figure 1 shows the vertical profiles of the amount of water ice as a function of the latitude for the coordinates of the ACS-MIR profiles predicted by the Mars PCM version 6. We observe that when/where the version 5 predicted clouds at altitudes typically 10 km below where they are observed by ACS-MIR in the second half of MY 35 [4], the new version 6 now provides a much better overall agreement with the observations. It may even predict clouds a slightly higher altitude in some cases.
The new version of the model is even able to reproduce the two layers observed in the extinction for Ls > 180° between 30°N and 60°N (panels h, i, k & l). One interesting point is that the PCM predict the presence of clouds in both layers, while our algorithm only flag water ice in the upper one (panels g & j), even though their presence is clearly seen in the extinction. This can suggest that this lower layer is either composed by crystals larger than 3-4 µm which cannot been distinguish from dust in the wavelengths that we are using [12], or mixed with dust.
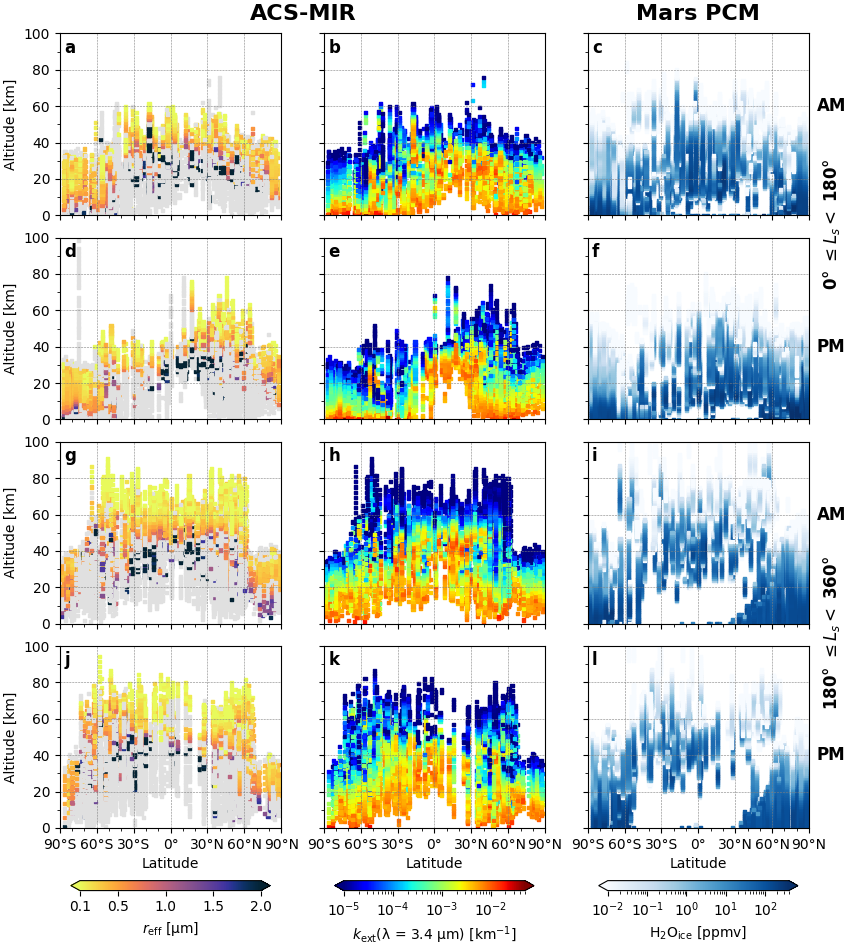
Figure 1 – Vertical profiles of water ice clouds in the Martian atmosphere (1st column) and atmospheric extinction profiles (2nd column) as observed by ACS-MIR from MY 35 to MY 37, and corresponding water ice vertical profiles from the Mars PCM version 6 (3rd column) as a function of latitude. The profiles are filtered by Ls and local time for each row.
Acknowledgments
ExoMars is a space mission of ESA and Roscosmos. The ACS experiment is led by IKI Space Research Institute in Moscow. The project acknowledges funding by Roscosmos and CNES. Science operations of ACS are funded by Roscosmos and ESA. ACS-MIR level 2B data are available on the LATMOS servers, as described at https://acs.projet.latmos.ipsl.fr/en/data.
References
[1] Clancy et al. (2017) The Atmosphere and Climate of Mars, 76–105. [2] Montmessin et al. (2017) The Atmosphere and Climate of Mars, 338–373. [3] Stcherbinine et al. (2025) Icarus, 425, 116335. [4] Stcherbinine et al. (2022) JGR: Planets, 127, e2022JE007502. [5] Forget et al. (2022) 7th MAMO workshop. [6] Wolff et al. (2022) GRL, 49, e2022GL100477. [7] Smith et al. (2022) GRL, 49, e2022GL099636. [8] Atwood et al. (2024) Icarus, 418, 116148. [9] Stcherbinine et al. (2025) EPSC-DPS 2025, abstract 1495. [10] Korablev et al. (2018) SSR, 214(1), 7. [11] Trokhimovskiy et al. (2015) SPIE, 960808. [12] Stcherbinine et al. (2020) JGR: Planets, 125, e2019JE006300
How to cite: Stcherbinine, A., Petzold, G., Montmessin, F., Baggio, L., Vincendon, M., Wolff, M., Korablev, O., Fedorova, A., Trokhimovskiy, A., and Lacombe, G.: Local time variability of water ice clouds vertical profiles with TGO/ACS-MIR and comparison with the version 6 of the Mars PCM., Europlanet Science Congress 2026, The Hague, The Netherlands, 7–11 Sep 2026, EPSC2026-967, https://doi.org/10.5194/epsc2026-967, 2026.


