
 1,1,
1,1,- 1German Aerospace Center, Planetary Physics, Berlin, Germany (nora.vandenheuvel@dlr.de)
- 2Delft University of Technology, Faculty of Aerospace Engineering (N.P.J.vandenheuvel@student.tudelft.nl)
- 3University of Nantes, Nantes, France
Jupiter’s moon Ganymede, the largest moon in the Solar System, is the main focus of the JUICE mission, which will observe its surface and measure its interior with unprecedented detail (Van Hoolst et al., 2024). In contrast with smaller moons such as Europa or Enceladus where an ocean is in contact with the silicate interior, Ganymede contains a high pressure (HP) ice layer between its ocean and the rocky core. Thus, on Ganymede, the dynamics in the high pressure ice layer control the exchange of heat and chemical species between the ocean and rocky interior.
The thickness of the HP ice layer is not well constrained, and interior structure models suggest thicknesses around 400 km, with values as low as 100 km (Kalousova et al., 2018) and as high as 700 km (Vance et al., 2018). Depending on the thickness of this layer, various high-pressure ice polymorphs might appear (Hussmann et al., 2015), such as ice V and ice VI, and for a sufficiently cold ocean also ice III (Journaux et al., 2020). Here we focus on ice V and ice VI, as they might exhibit different viscosities that in turn can substantially affect the convective behavior of the HP ice layer. Rheological experiments of ice V and ice VI are rare, but existing studies (Sotin & Poirier, 1987) indicate that ice V can be harder to deform than ice VI, and the viscosity ratio can reach up to three orders of magnitude.
Model
We investigate the dynamics of Ganymede’s HP ice layer using the geodynamical code GAIA (Hüttig et al., 2013). GAIA numerically solves the conservation equations of mass, linear momentum and thermal energy in 2D and 3D geometries. Our models use free-slip boundary conditions at the ice-ocean interface and no-slip at the boundary between the high-pressure ice layer and the silicate interior. The temperature is set at the melting temperature of water ice at the ice-ocean interface, while for the ice-silicate boundary we prescribe a heat flow that decreases with time from 20-40 mW/m2 at 4.5 Gyr ago to 5-10 mW/m2 at present day, values that have been used in previous studies (Choblet et al., 2017). Since the thickness of the high pressure ice layer on Ganymede is poorly constrained we test models with 400 km and 700 km (Fig. 1).
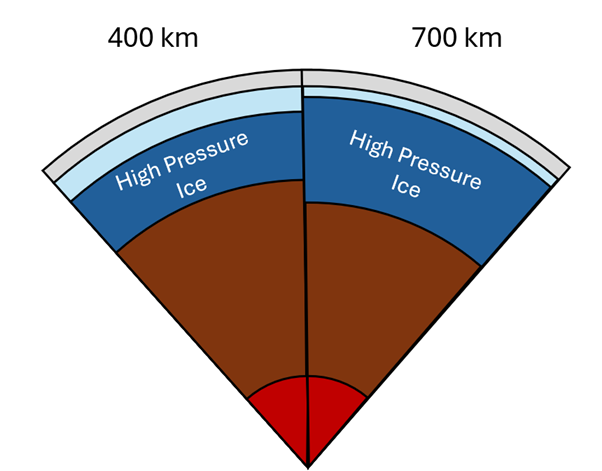
Fig. 1: Thickness and structure of the high pressure ice layer tested in this study.
Our models use the viscosity formulation of Kalousová et al. (2018) that has been derived from rheological experiments (Sotin et al., 1985; Durham et al., 1996). This Arrhenius-type relation expresses viscosity as a function of temperature difference from the local pressure-dependent melting point, such that ice has a higher viscosity when the temperature is away from the melting curve and lower as it approaches it. The melting curve is pressure-dependent and differs for the high pressure ice phases (Chizov, 1993). We test models where the HP ice layer of Ganymede is subdivided into ice V and ice VI layers. Our models vary the reference viscosity of the ice VI layer between 1015 and 1018 Pa s and apply a viscosity contrast between the ice V and ice VI layers of up to 1000. Similar to Choblet et al. (2017), we limit the temperature to the melting temperature of the HP ice layers and compute the amount of melt produced throughout the evolution.
Results and Discussion
Our models show that the ice shell dynamics substantially change with both the reference viscosity and the increase of viscosity contrast between ice V and ice VI. In the early evolution, a lower reference viscosity leads to vigorous convection in the high pressure ice layer and efficient cooling. By present day this trend reverses, with higher reference viscosity models remaining more convective and warmer. Introducing a viscosity contrast between ice V and ice VI increases the vigor of convection, both in the early evolution and at present day. A high contrast in viscosity between ice V and ice VI (i.e., two orders of magnitude or more) also leads to the development of a two-layered convection structure. Convection is concentrated in the lower ice VI layer, while the upper ice V layer acts as a stiff lid. Heat and material transport from the ice-rock interface to the ocean occurs in pulses, when convective plumes penetrate through this high-viscosity ice V layer.
Melt production is most significant during early evolution, when the temperature in the high pressure layer is high. For models with a high viscosity contrast between ice V and ice VI layers, the temperatures are higher compared to cases without a viscosity jump (Fig. 2). This is a consequence of sluggish convection in the ice V layer and, hence, less efficient cooling. As a result, more melt is produced over the full evolution when a high viscosity contrast is applied (i.e., the melt volume is three times higher for a model with a 400 km ice shell thickness and three orders of magnitude viscosity contrast compared with a model without a viscosity jump).
We note that the 400 km ice shell models are warmer than the 700 km models, given their slightly higher temperature at the ice-ocean interface (265 K vs. 248 K) and their larger ice-silicate contact area. In the absence of tidal heating, the models with an ice shell thickness of 400 km receive more heat through the bottom boundary than the 700 km models. In addition, more vigorous convection in the 700 km cases leads to stronger cooling through time. The higher ice shell temperatures also lead to a larger amount of melt (about two to four times larger) that can be produced in the 400 km cases compared to the 700 km simulations.
Future models will include the effects of tidal heating and track the redistribution of impurities, i.e., salts, through the high pressure ice layers of Ganymede.
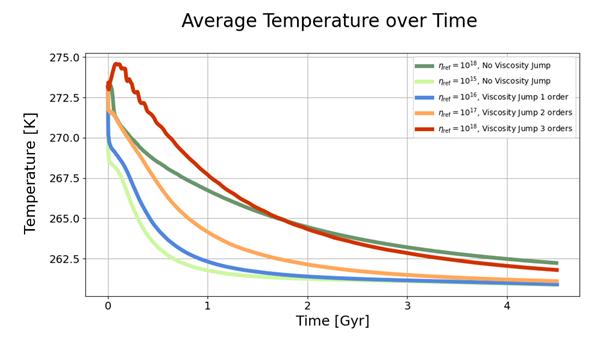
Fig. 2: Evolution of the average temperature in the high pressure ice shell of Ganymede for various rheological structures.
How to cite: van den Heuvel, N., Plesa, A.-C., Hussmann, H., and Sotin, C.: Dynamics and Evolution of the High Pressure Ice Layer on Ganymede, Europlanet Science Congress 2026, The Hague, The Netherlands, 7–11 Sep 2026, EPSC2026-980, https://doi.org/10.5194/epsc2026-980, 2026.


