
 4,4,5,7,8,3,10,
- 1Space Sciences Lab, University of California, Berkeley CA, USA (mikewong@ssl.berkeley.edu)
- 2Carl Sagan Center for Science, SETI Institute, Mountain View CA, USA
- 3Jet Propulsion Laboratory, California Institute of Technology, Pasadena CA, USA
- 4Department of Space Physics, Institute of Atmospheric Physics of the Czech Academy of Sciences, Prague, Czechia
- 5Faculty of Mathematics and Physics, Charles University, Prague, Czechia
- 6ALPO Japan, Tokyo 214-8571, Japan
- 7Center for Integrative Planetary Science, University of California, Berkeley CA, USA
- 8NASA Goddard Space Flight Center, Greenbelt MD, USA
- 9Michigan Technical University, Houghton MI, USA
- 10Climate and Space Sciences and Engineering, University of Michigan, Ann Arbor MI, USA
- 11Southwest Research Institute, Antonio TX, USA
Overview
Jovian lightning has been investigated by every spacecraft mission that visited Jupiter prior to Juno. Lightning is valued because it traces locations with active moist convection, presumably rooted in the water cloud layer. Occurrence rates of lightning are not spatially uniform, with increased activity in cyclonic belts as compared to anticyclonic zones.
The Juno spacecraft has detected lightning signals in UV (Giles et al. 2020), optical (Becker et al. 2020), and radio bandpasses (Kolmasova et al. 2018, Brown et al. 2018). We focus here on data from the Microwave Radiometer instrument (Janssen et al. 2017), which detects pulses at 600 MHz frequency (or 50 cm wavelength). Lightning is detected in the MWR dataset as pulses of anomaly high brightness temperature, spanning one (or sometimes more than one) integration period of 0.1 seconds. The actual lightning pulses are probably not temporally resolved by MWR, since Juno Waves detects dispersed pulses and whistlers implying source signal durations of 0.5 to 12 milliseconds (Imai et al. 2020, Kolmasova et al. 2023).
Stealth superstorms
In 2021, convective activity in the North Equatorial Belt (NEB) ceased, according to visible imaging. Over a period of several months, convection gradually began to recover, in form of "stealth superstorms" that took place at a single active longitude (Rogers et al. 2022, Wong et al. 2023, Brueshaber et al. 2025). Between September 2021 and December 2022, Juno passed over this active longitude and detected stealth superstorm activity (including pulses with MWR) on four occasions (perijoves 38, 39, 44, and 47). Figure 2 shows an HST map of a storm on PJ 44, with the (shifted) Juno spacecraft track and MWR boresight pointings at the time of lightning pulse detections. But the MWR beam is 21 degrees full width at half maximum, and signal can be detected at larger angles (just with greater attenuation). So we hypothesize that the source of the lightning was the stealth superstorm at 9.5 degrees N planetocentric latitude rather than the boresight locations.
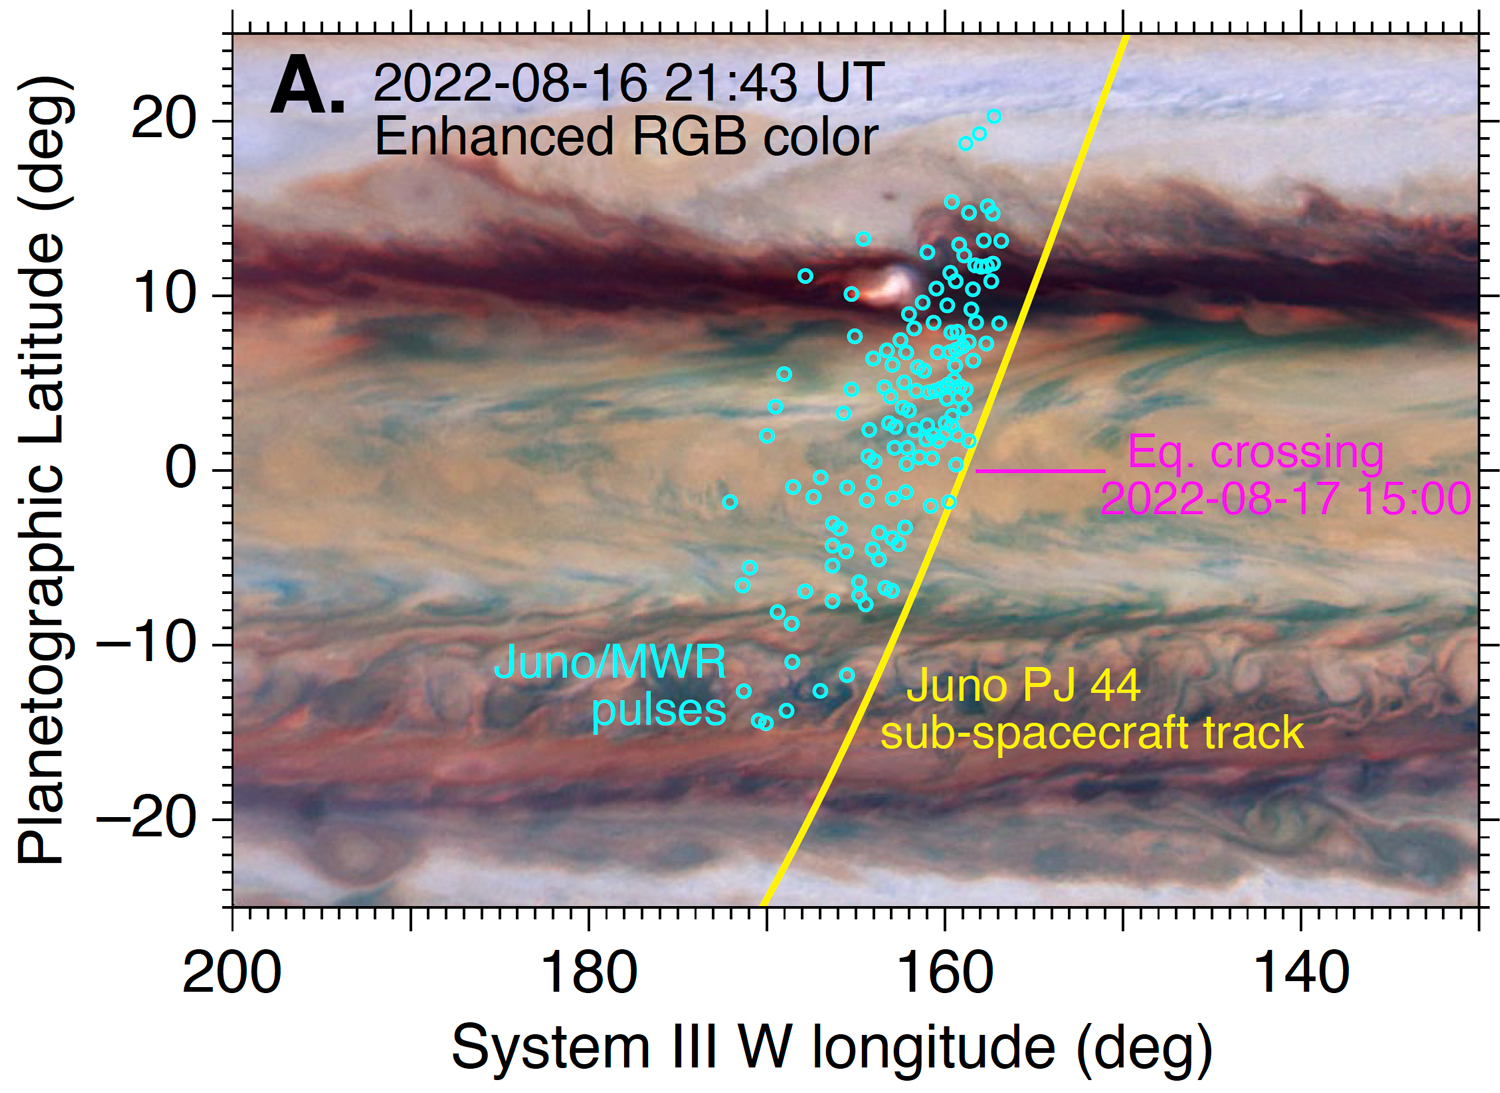
Figure 2
Juno/MWR beam/gain/sensitivity
We can use lightning signals with a known source to determine the source power of the signal, rather than only the detected power for unlocated sources. Figure 4(A) shows the MWR pointing for a single lightning detection, with contours indicating the off-boresight angle. The source power noise floor for this particular detection is shown in panel B, where the source noise floor is a function of both the off-boresight angle (and thus the antenna gain), plus the range from Jupiter's atmosphere to Juno. Using similar pointing information for all of the detections, we were able to measure the lightning source power distribution for stealth superstorms on perijoves 38, 39, 44, and 47.
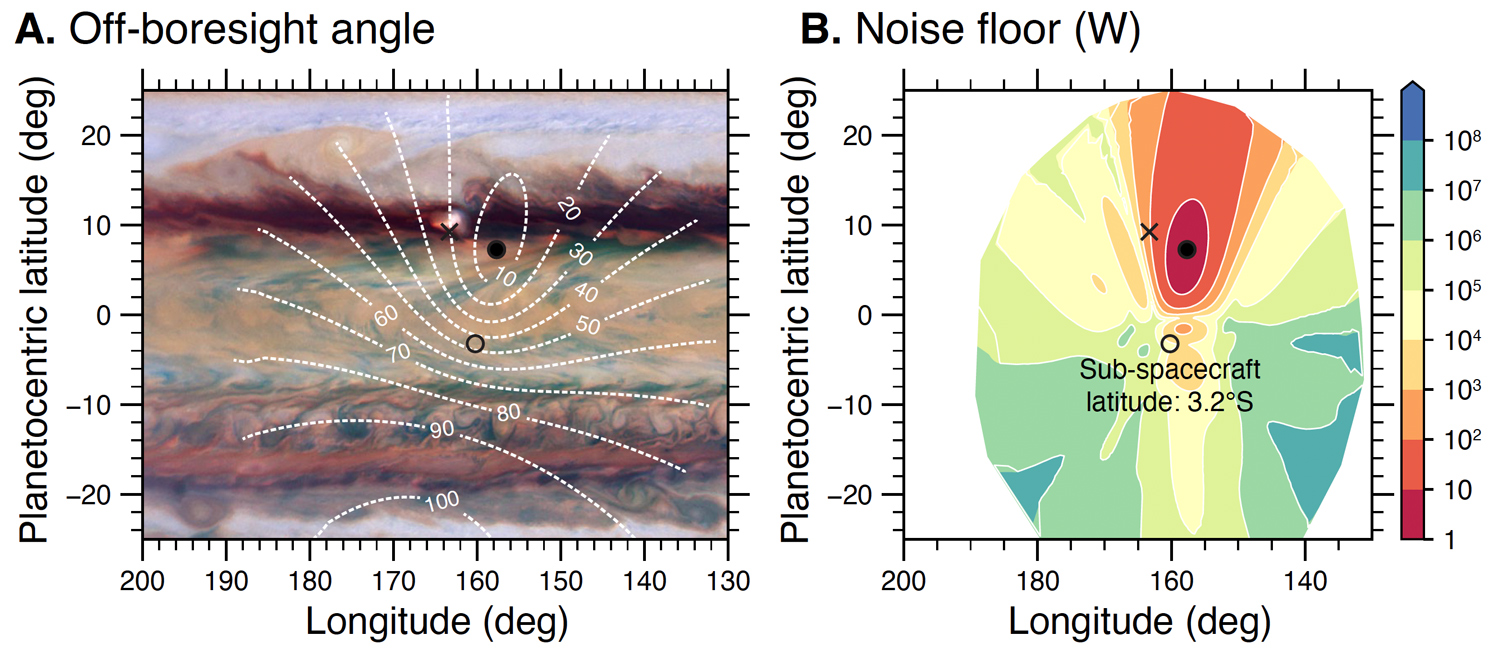
Figure 4
Comparing Jupiter and Earth Lightning power
To analyze the distribution of pulse power levels, we combined data from the four perijoves into the combined distribution shown as a blue curve in Fig. 12(A). For comparison, a shifted terrestrial lightning distribution from the FORTE satellite (Jacobson 2003) is shown in gold. In both cases, the distribution has a clear peak and shows that the median and mode of the power distribution falls within the detection range of MWR and FORTE. For the MWR data, we argue that the peaked distribution (resembling a log-normal distribution) is evidence that MWR detects typical Jovian lightning signals, rather than Jovian superbolts that are at least 1000 times stronger than the mode of the distribution. This follows from the superbolt definition of Holzworth et al. (2019) for terrestrial WWLLN lightning data in the 5-18 kHz frequency range, where superbolts had energies greater than 1 MJ, compared to a mean of about 1 kJ.
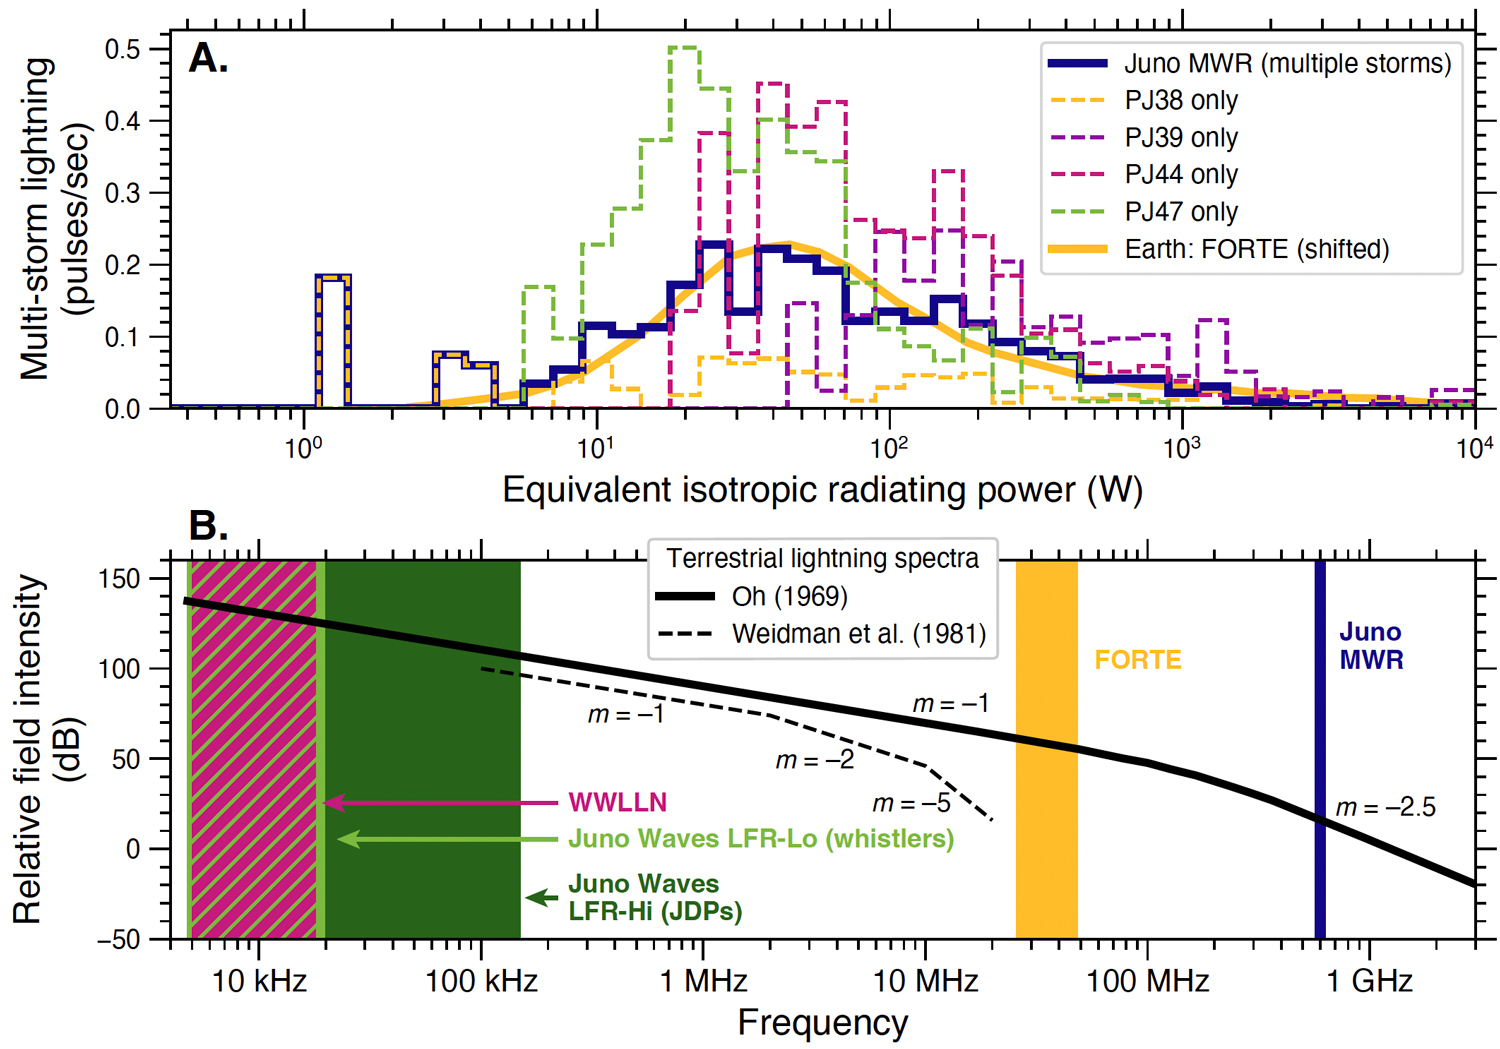
Figure 12
Comparing absolute source power between terrestrial and Jovian radio signals is challenging, partly because the relevant measurements are in very different bandpasses (Fig. 12(B)). Various power-law spectral energy distributions can be used to relate signals in terrestrial data at different frequencies, as shown for Oh (1969) and Weidman et al. (1981). If we use these spectra to extrapolate lightning modal power from WWLLN and FORTE to the 600-MHz frequency of MWR, we find that Jovian lightning is likely to be in the range of 1 to 100 times more powerful than terrestrial lightning.
Conclusions: key points
- Clustering breaks the power/location degeneracy to reveal the source power distribution of lightning signals
- Juno MWR measured an event rate of about 3 integrated pulses/sec at 600 MHz in four isolated storms
- The lightning power distribution peaks inside the MWR sensitivity range, favoring typical lightning activity (not superbolt outliers)
References
- Becker et al. 2020 - DOI: 10.1038/s41586-020-2532-1
- Brown et al. 2018 - DOI: 10.1038/s41586-018-0156-5
- Brueshaber et al. 2025 - DOI: 10.1016/j.icarus.2025.116465
- Giles et al. 2020 - DOI: 10.1029/2020JE006659
- Holzworth et al. 2019 - DOI: 10.1029/2019JD030975
- Imai et al. 2020 - DOI: 10.1029/2020GL088397
- Jacobson 2003 - DOI: 10.1029/2003JD003936
- Janssen et al. 2017 - DOI: 10.1007/s11214-017-0349-5
- Kolmasova et al. 2018 - DOI: 10.1038/s41550-018-0442-z
- Kolmasova et al. 2023 - DOI: 10.1038/s41467-023-38351-6
- Oh 1969 - DOI: 10.1109/TEMC.1969.303024
- Rogers et al. 2022 - DOI: 10.5194/epsc2022-17
- Weidman et al. 1981 - DOI: 10.1029/GL008i008p00931
- Wong et al. 2023 - DOI: 10.3390/rs15030702
How to cite: Wong, M. H., Oyafuso, F. A., Imai, M., Kolmašová, I., Mizumoto, S., Levin, S. M., Sankar, R., Simon, A. A., Brueshaber, S., Orton, G. S., Atreya, S. K., Li, C., and Bolton, S. J.: Radio pulse power distribution of lightning in Jupiter's 2021-2022 stealth superstorms, EPSC-DPS Joint Meeting 2025, Helsinki, Finland, 7–13 Sep 2025, EPSC-DPS2025-1054, https://doi.org/10.5194/epsc-dps2025-1054, 2025.