
 1,3,
1,3,- 1CNES, 18, avenue E. Belin, 31401 Toulouse Cedex 9, France
- 2Institute of Research in Astrophysics and Planetology (IRAP), CNRS, University of Toulouse Paul Sabatier, Toulouse, France
- 3LATMOS/IPSL, Sorbonne Université, UVSQ Université Paris-Saclay, CNRS, Paris, France
- 4ARES, NASA Johnson Space Center, Houston, TX 77058, USA
Motivation
The injection of materials into the Earth's atmosphere has both a natural and an anthropogenic component. Natural solid aerosols that reach the stratosphere can come from Earth—like ash from volcanic eruptions and biomass fires, pollens, spores, etc. —or from space, such as interplanetary dust, asteroids and comets. Anthropogenic stratospheric solid aerosols exclusively come from space activities, including rocket launches (alumina and black-carbon during propellant combustion) and the re-entry of space objects (rocket bodies, payloads and associated debris) into the atmosphere. Since 2000, the number of rocket launches has increased by a factor of 3 and the number of satellites launched into orbit has increased by a factor of 30 (Lasue et al., 2024). Over the same period, the mass of alumina ejected by Solid Rocket Motors is estimated to have decreased by a factor 2 without accounting for black-carbon emissions (Fig. 1). At the same time, the total mass re-entered into the atmosphere from payloads (excluding manned space flight capsules), rocket bodies, boosters and their debris has increased by more than a factor 2 (Fig. 2). Space debris accounts for only 1% of the total mass re-entered into the atmosphere, while payloads and rocket bodies (and upper stages) account for 7% and 9% respectively. Most of the re-entered mass (83%) comes from boosters and core stages in suborbital flight. Overall, an average of 3.4 kt/year of anthropogenic materials enters Earth’s atmosphere. Whereas the estimated total re-entered mass from cosmic particles ranges between 8.4 and 33.4 kt/year (Schulz et al., 2021, Fig. 1 and Tab. A.7).
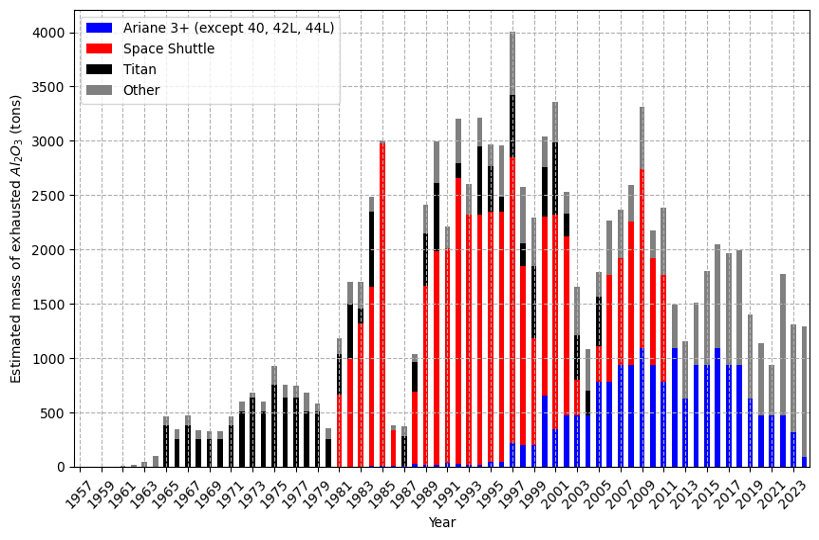
Figure 1 – Annual estimated exhausted alumina mass from Solid Rocket Motors assuming a primary emission index of 0.328 and no afterburning effects (Barker et al., 2024).
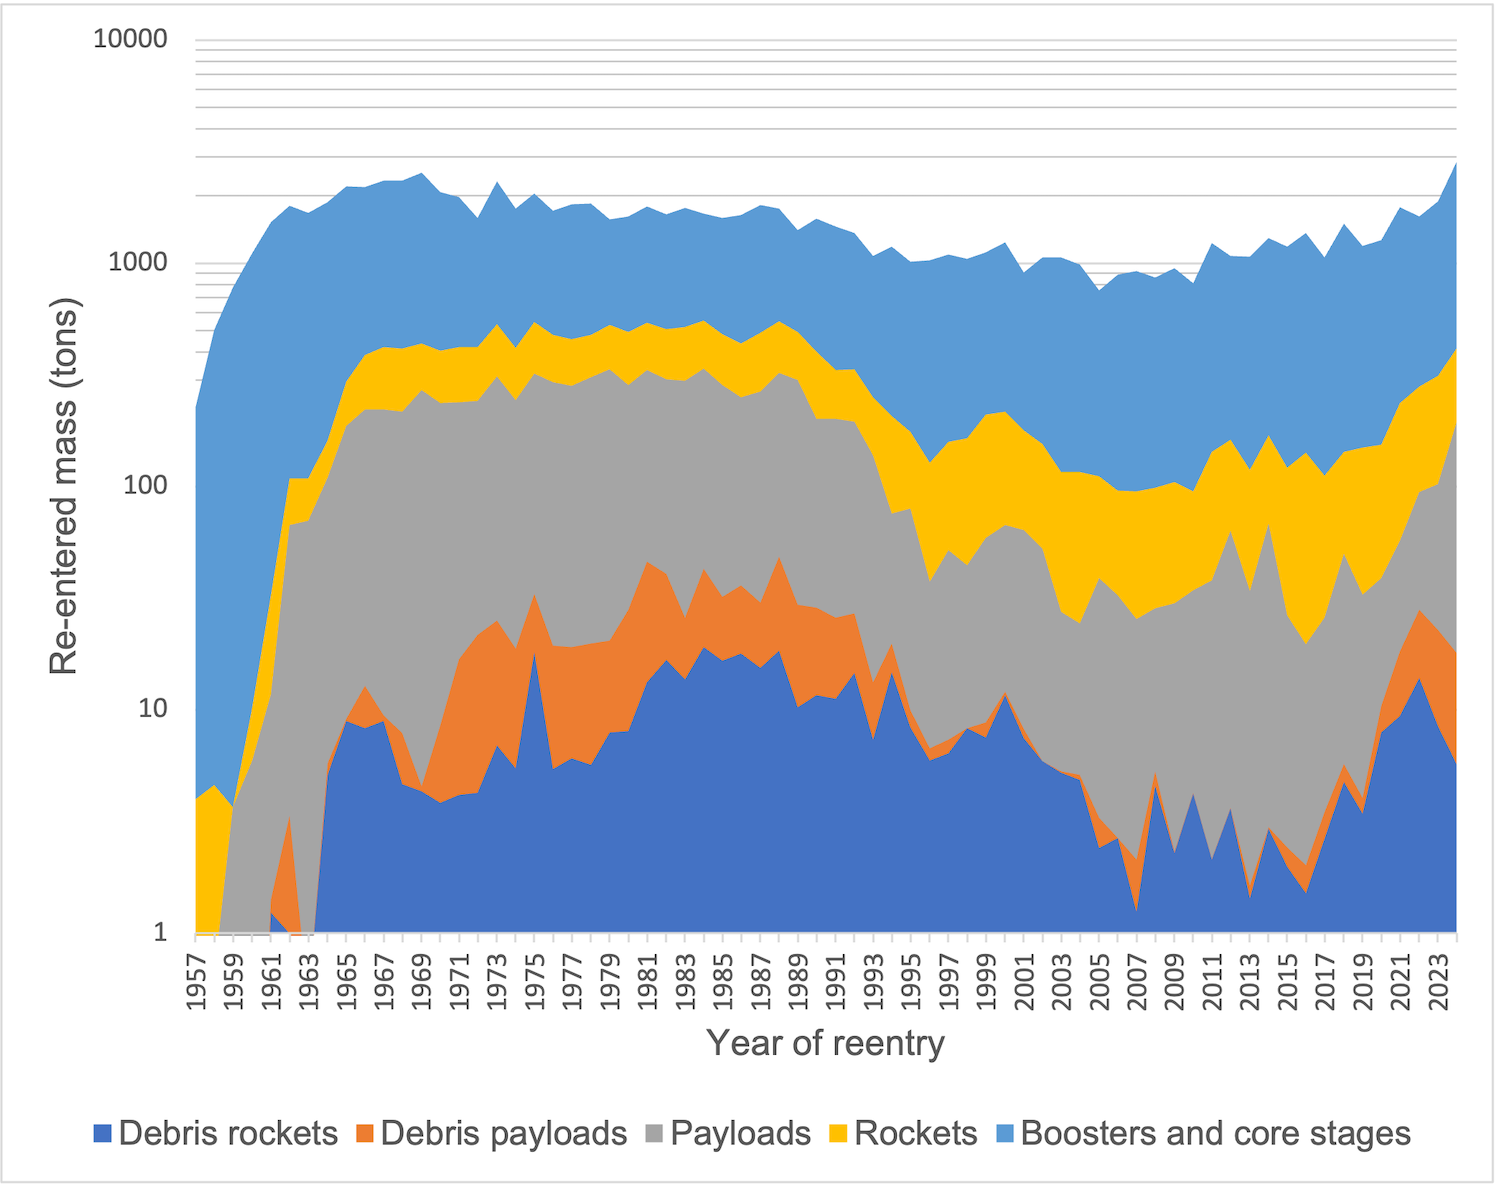
Figure 2 - Annual re-entered dry mass of space objects since 1957, excluding the human spaceflight re-entry vehicles. Only boosters and core stages re-enter in suborbital flight.
Analysis of stratospheric materials
In 1981, the NASA Cosmic Dust Program was created to collect and study cosmic dust particles in the stratosphere between 18-20 km over the US with campaigns running till present. The NASA WB-57 and ER-2 aircraft collect these particles on silicone oil covered plates at a sampling altitude of about 20km. Then, particles are manually selected from the plates and rinsed in the lab. Shape, size, luster, color and transparency of the particles are characterized under optical and Scanning Electron Microscopes (SEM). Their elemental composition is measured by Energy Dispersive X-ray Spectroscopy (EDS). Based on these data, the particles are tentatively classified into 4 groups:
- Cosmic (C): from asteroids and comets;
- Terrestrial Contaminant Natural (TCN): from stratospheric injection of ash from volcanic eruptions and biomass fires, pollens, spores, etc.
- Terrestrial Contaminant Artificial (TCA): from re-entry of space objects such as satellites, rocket bodies, and space debris;
- Aluminium Oxide Sphere (AOS): mostly from Solid Rocket Motors exhaust.
5070 particles were selected, analysed, curated and the corresponding data was published in the NASA Cosmic Dust Catalogs, covering the period 1981-2020. The population of TCA in these catalogs increased in the last 10 years although not many AOS were observed after the end of the Space Shuttle Program in 2011 (Fig. 3). In order to facilitate the micromanipulation and analysis of the particles collected on the silicone oil plates, the submicron-sized particles are not usually selected. This means that most of the analysed and published particles in the catalogs were larger than 5 microns (Fig. 4) whereas if all particles in the silicone oil were analysed, smaller particles would be found (Zolensky et al., 1985, Fig. 3).
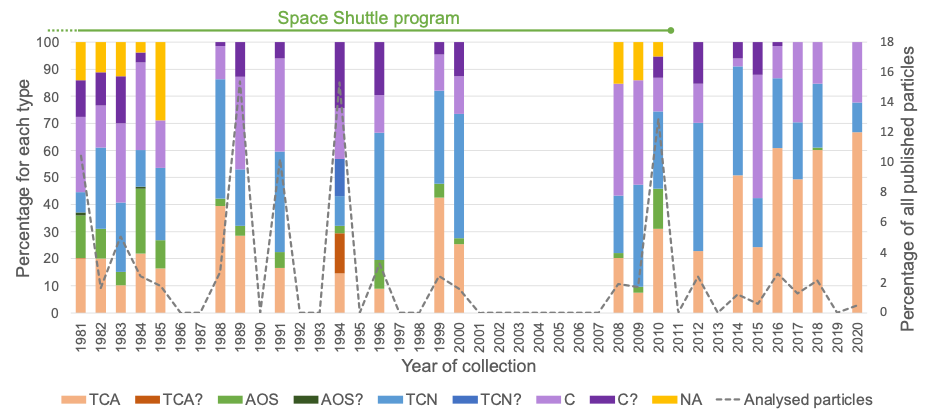
Figure 3 - Proportion of particle types per year of collection (Lasue et al., LPSC 2024).
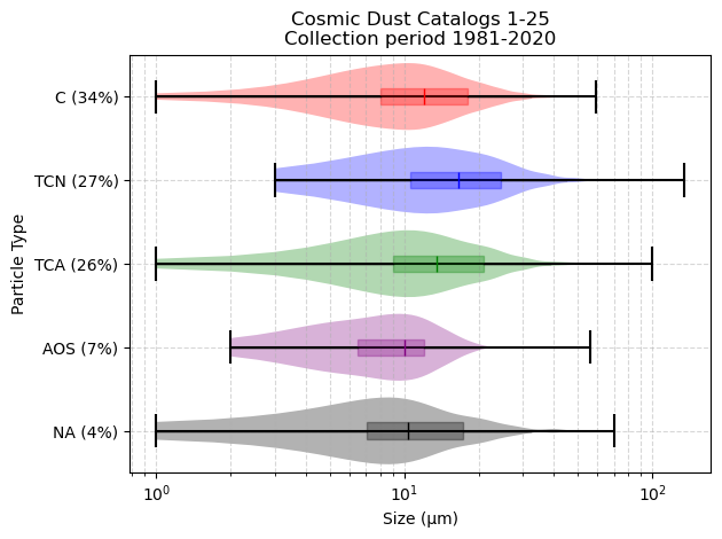
Figure 4 – Violin plot showing the size distribution of the 4 NASA types of all published particles collected over 1981-2020. The percentage of each particle type in the total population is given in brackets.
Classifications based on elemental composition
Between 1981 and 2020, EDS spectrometers with different performances and set-up were used. We developed a digitalization and pre-processing of the EDS spectra to allow intercomparison between different catalogs. We explored these digitized spectra with multivariate analysis techniques (Principal Component Analysis) and generated non-linear 2D projections of these multidimensional scatter plots. EDS spectra of natural minerals and pure elements were added as references to help in visualizing particles of similar composition (Fig. 5). Finally, an automated clustering helped to identify new compositional groups of particles. Hence, we can relate these compositional groups to the origin of the particles (Fig. 6). For example, using the ~1000 particles published in Catalog 18, we can separate volcanic ash (similar to Rhyolite glass) and S-rich volcanic ash, chondritic particles and particles coming from differentiated asteroids, from paints (Cd-rich), from electronics (Cu-rich), satellite structures (Al-rich with other metals) and alumina. These new clusters are consistent with the NASA manual classification (Fig. 5 and Fig. 6).
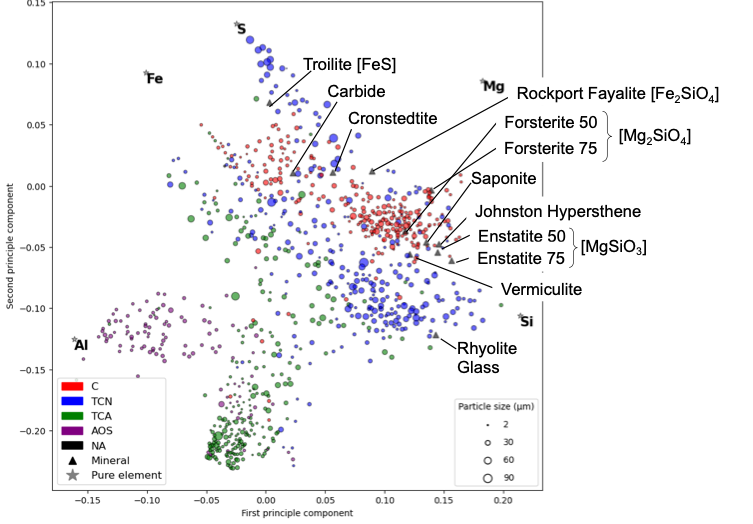
Figure 5 - Non-linear two-dimensional projection (Sammon’s map) of the elemental composition of all particles from NASA Cosmic Dust Catalog 18. Each circle represents one EDS spectrum and particle sizes can be visualized by the circle size. Some minerals formulas are indicated in square brackets.
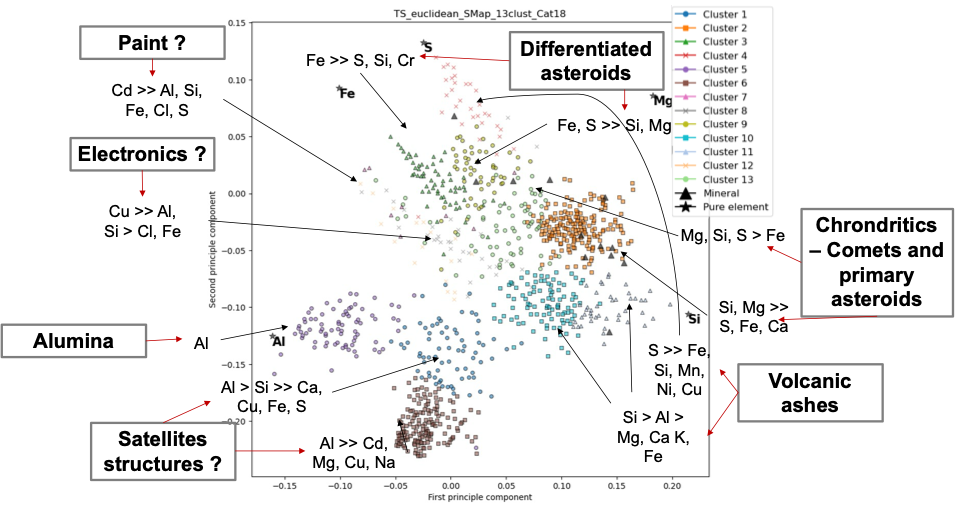
Figure 6 - Sammon's map of all particles from NASA Cosmic Dust Catalog 18 with labelled possible origins. The different colors indicate the different compositional clusters.
Perspectives
In the future, we will extend this work to all ~ 5000 stratospheric particles published in all NASA Cosmic Dust Catalogs in order to constrain their origin. Furthermore, stratospheric particle fluxes and densities will be estimated using the flight information records, collector surfaces and selection processes. These results will provide insights into the size distribution of stratospheric solid aerosols at these sampling altitudes and latitudes. Finally, complementary analyses of older and more recent samples curated at NASA’s Johnson Space Center in Houston will be performed using cutting-edge EDS spectroscopy that can detect and quantify lighter elements including carbon and oxygen. Additional Raman spectroscopy can be used to assess mineralogy, help to interpret the origin of particles.
How to cite: Taupin, Q., Lasue, J., Määttänen, A., and Zolensky, M.: Constraining the origins of terrestrial stratospheric solid aerosols over the 1981-2020 period, EPSC-DPS Joint Meeting 2025, Helsinki, Finland, 7–13 Sep 2025, EPSC-DPS2025-1899, https://doi.org/10.5194/epsc-dps2025-1899, 2025.