
 1,1,3,4,6,1,1
- 1Jet Propulsion Laboratory, California Institute of Technology, Pasadena, California, United States of America (glenn.orton@jpl.nasa.gov)
- 2California Institute of Technology, Pasadena, California, United States of America
- 3University of Leicester, Leicester, UK
- 4University of Michigan, Ann Arbor, Michigan, USA
- 5Michigan Technological University, Houghton, Michigan, USA
- 6SETI Institute, Palo Alto, California, USA
- 7Southwest Research Insitute, San Anotonio,Texas, USA
Juno’s Microwave Radiometer (MWR) is providing an unprecedented opportunity to explore the dynamical properties and composition of Jupiter’s atmosphere well below its cloud tops. Jupiter’s atmosphere is arguably the most visibly heterogeneous and time variable in the solar system. Since its arrival on 2016 August 27, the MWR has observed variability in microwave emission at wavelengths between 1.3 and 50 cm, sensing from 0.7 bar to over 100 bars of atmospheric pressure at over 69 close approaches to the atmosphere, known as “perijoves”. There has been a concerted effort to collect contextual information from other Juno instruments, as well as ground- and space-based observations to help interpret the MWR results. The space-based observations have included those from Juno’s own visible camera (JunoCam) and its Jupiter Infrared Auroral Mapper (JIRAM), as well as the Hubble Space Telescope (HST). The ground-based observations have included images and spectra from both professional and citizen-science astronomers.
We report here observations that are constrained to spatial resolutions of 2° in latitude or better, and have been subject to recent improvements in the calibration drift for all MWR’s channels with an improved relative calibration uncertainty of 0.5% or better over the entire mission. These are shown in Figure 1 for the MWR observations covering planetocentric latitudes from 40°S to 80°N. This has allowed us to evaluate zonal-mean temperatures and variability with improved confidence that these are real and not an artifact of receiver drift. The region that shows the greatest variability from a zonal mean is the North Equatorial Belt, (NEB: 12°N-16°N) with a 2% standard deviation from the mean at all levels sensed by the MWR except for the 50-cm channel that senses variability in temperature and ammonia and water composition at pressures in excess of 100 bars of pressure. Among the strongest variability associated with discrete features in the atmosphere is a major upwelling and subsequent clearing of cloud cover in the North Temperate Belt (NTB: 20°N-26°N) in August-September of 2020. In general, the microwave brightness temperature variability often but not always correlates with visible or near- to mid-infrared variability. In some regions, such as the Equatorial Zone (EZ: 3°S-6°N), substantial variability is detected not only in regions above the level of the water-condensate cloud (~10 bars) but also at great depth (>100 bars). Current work is focusing on identifying where variabilities in the zonal-mean microwave brightness are the result of zonally discrete features in the atmosphere, particularly the NEB. Future work will address observations fulfilling the same spatial resolution requirements but covering higher northern latitudes.
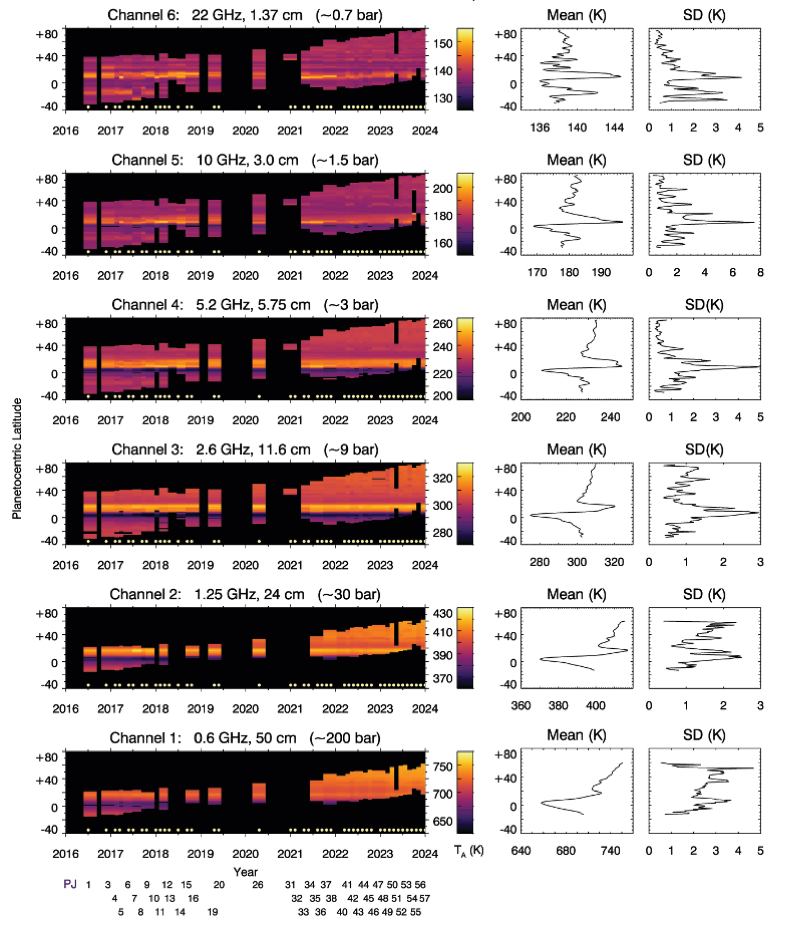
Figure 1. Composite MWR maps of observed zonal-mean antenna temperatures in all channels that cover planetocentric latitudes 40°S to 80°N with 2° meridional resolution, interpolated to a common emission angle of 47°. Maps have been expanded by 0.1 year for visibility. White circles denote the actual date of the measurements, with the responsible perijove indicated at the bottom. Rightmost panels display the zonal-mean temperatures over all perijoves, together with the associated standard deviation. Unfilled spots in the maps correspond to spacecraft attitudes that precluded MWR observations being made at the required spatial resolution. Note that Channels1 and 2 have angular resolutions (“footprints”) twice the size of Channels 3-6; keeping a 2° latitude resolution for those channels thus restricts their coverage relative to Channels 3-6.
How to cite: Orton, G., Zhang, Z., Levin, S., Fletcher, L., Oyafuso, F., Li, C., Brueshaber, S., Wong, M. H., Momary, T., Bolton, S., Baines, K., Dahl, E., and Sinclair, J.: Juno Microwave Radiometer Measurements of the Depths of Spatial and Temporal Variability in Jupiter , EPSC-DPS Joint Meeting 2025, Helsinki, Finland, 7–12 Sep 2025, EPSC-DPS2025-243, https://doi.org/10.5194/epsc-dps2025-243, 2025.