
 1,2,2,1,2,
- 1Univ. Bordeaux, CNRS, LAB, UMR 5804, F-33600 Pessac, France
- 2LIRA, Observatoire de Paris, Université PSL, CNRS, Sorbonne Université, Université Paris Cité, 5 place Jules Janssen, 92195 Meudon, France
The Infrared Space Observatory and Spitzer have detected H2O and CO2 in the stratospheres of the giant planets and Titan (Feuchtgruber et al. 1997, Coustenis et al. 1998, Burgdorf et al. 2006). Their upper tropospheres are cold and H2O and CO2 condense into ice clouds (except CO2 in Jupiter and Saturn). These detections thus imply the presence of an external source of oxygen. Such source can be: (i) local (icy rings and/or satellites), (ii) interplanetary dust particles (IDPs), (iii) large comet impacts, or (iv) a combination of them. At Uranus, H2O probably comes from IDPs (Moses & Poppe 2017, Teanby et al. 2023). And while the dominant source of CO in Jupiter, Saturn, and Neptune seems to be comet impacts (Moreno et al. 2003, Cavalié et al. 2010, Lellouch et al. 2005), its nature remains unknown in Uranus despite the Herschel disk-averaged observations of Cavalié et al. (2014). Because the different sources have specific signatures in terms of spatio-temporal distributions, mapping observations of the stratosphere can be used to disentangle them. For instance, comets are sporadic and spatially localized (Lellouch et al. 1995), IDPs are steady, latitudinally and longitudinally uniform (Moses & Poppe 2017), and ring/satellite sources are localized (Cavalié et al. 2019). These differences have been used to constrain the origin of external sources on Jupiter (Lellouch et al. 2002, Cavalié et al. 2013), Saturn (Cavalié et al. 2010, 2019), and Neptune (Lellouch et al. 2005, Moreno et al. 2017). However, even though these sources cause different vertical and horizontal distributions in Uranus, all can reproduce the Herschel spectrum at 922 GHz (see Fig. 1). Consequently, Cavalié et al. (2014) could not discriminate the sources from this single disk-averaged line.
In October 2022, the CO(3-2) emission was mapped in the stratosphere of Uranus with ALMA (Fig. 2). We have retrieved and analyzed these data to constrain the horizontal and vertical distributions of CO. In this paper, we present our findings and their implications on the source of CO in the atmosphere of Uranus.
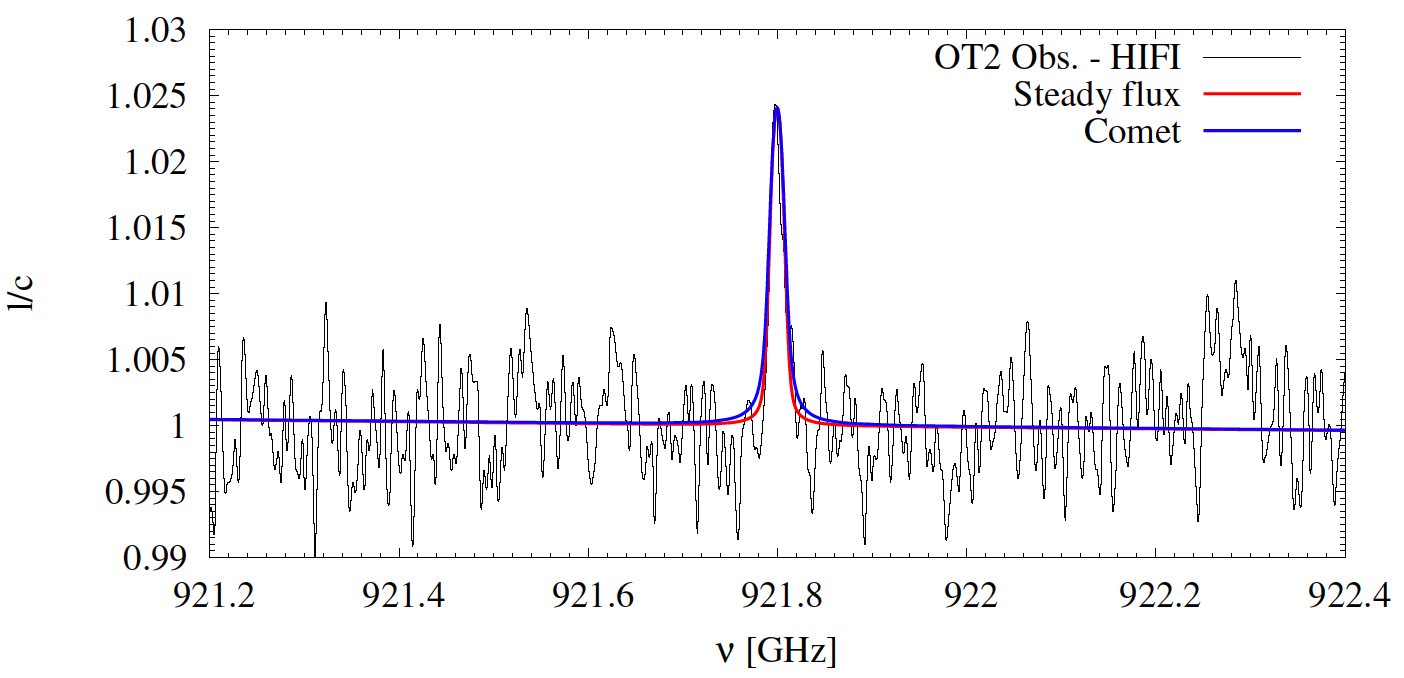
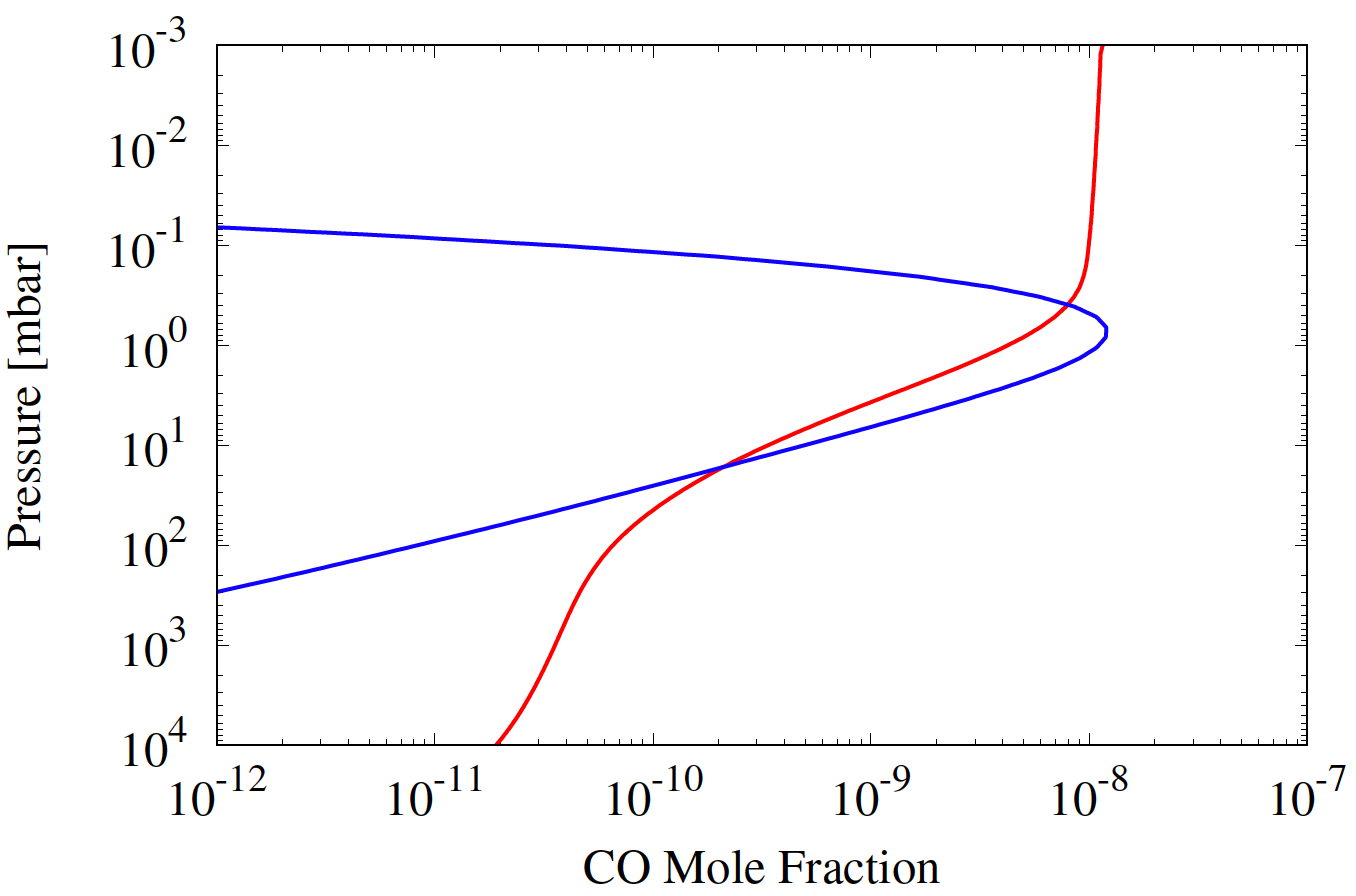
Fig. 1: (Left) Herschel observation of the CO(8-7) line in the stratosphere of Uranus at 922 GHz. The spectrum is expressed in terms of line-to-continuum ration (l/c). (Right) Vertical profiles obtained from 1D vertical diffusion modeling for a comet source (blue line) and from a steady flux of IDPs (red line). Figure adapted from Cavalié et al. (2014).
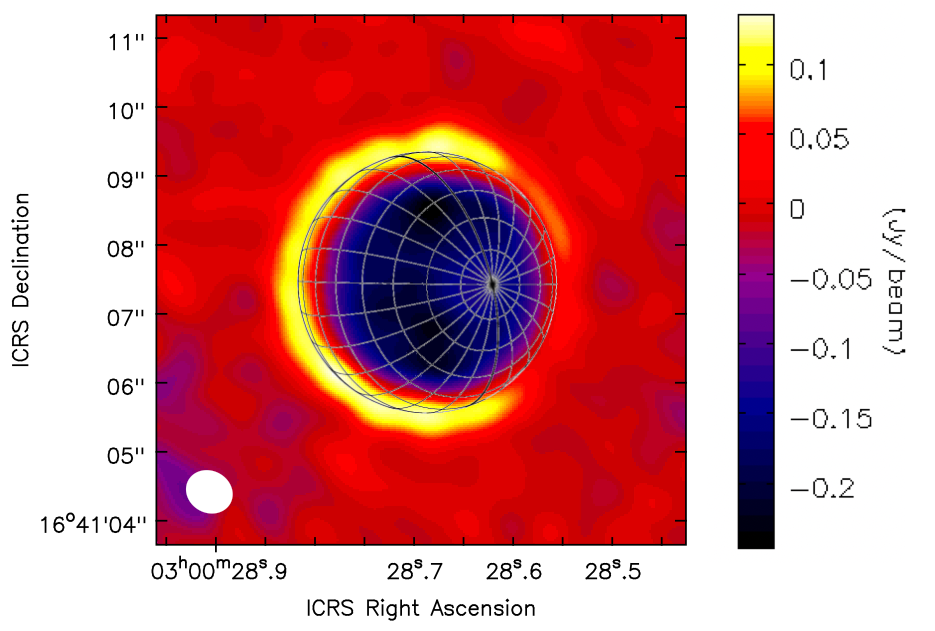
Fig. 2: Line area map of the CO(3-2) emission, as observed in the stratosphere of Uranus with ALMA in October 2022.
References:
Burgdorf et al. 2006. Icarus 184, 634
Cavalié et al. 2010. A&A 510, A88
Cavalié et al. 2013. A&A 553, A21
Cavalié et al. 2014. A&A 562, A33
Cavalié et al. 2019. A&A 630, A87
Coustenis et al. 1998. A&A 336, L85
Feuchtgruber et al. 1997. Nature 387, 159
Lellouch et al. 1995. Nature 373, 592
Lellouch et al. 2002. Icarus 159, 112
Lellouch et al. 2005. A&A 430, L37
Moreno et al. 2003. P&SS 51, 591
Moreno et al. 2017. A&A 608, L5
Moses and Poppe 2017. Icarus 297, 33
Teanby et al. 2023. Planet. Sci. J. 3, 96
How to cite: Cavalié, T., Moreno, R., Lefour, C., Fouchet, T., and Lellouch, E.: On the origin of CO in the stratosphere of Uranus, EPSC-DPS Joint Meeting 2025, Helsinki, Finland, 7–13 Sep 2025, EPSC-DPS2025-70, https://doi.org/10.5194/epsc-dps2025-70, 2025.