
 1,4,5,,6,
- 1LATMOS - SU, Paris, France (alice.legall@latmos.ipsl.fr)
- 2LIRA, Observatoire de Paris, France
- 3NRAO, New Mexico, USA
- 4LMD-IPSL, Paris, France
- 5GEOPS, Université Paris Saclay, France
- 6ISAE-Supaero, Toulouse, France
Indubitably, the most dramatic albedo hemispheric dichotomy in the Solar system occurs at Iapetus. Its leading (L) side is covered by an optically low-albedo material, contrasting with its bright trailing (T) side. This dichotomy is also visible at microwave wavelengths, which sense not only the surface but also the subsurface and can thus bring insights into the vertical extent of the dark L side deposit layer and, in general, on the variations with depth of the composition and structure of Iapetus’ subsurface. We here present all available radio maps of Iapetus and the thermal emission model we have develop to interpret them. This model combines a multi-layer thermal and radiative transfer model and its comparison to VLA and Cassini RADAR observations provide new constraints on the physico-chemical properties of both the T and L hemispheres of Iapetus.
Introduction
The origin of Iapetus two-tone coloration has long been controversial; there now seems to be a consensus toward an exogenic deposition of low-albedo materials originating from Phoebe’s vast debris ring that crosses Iapetus’ orbit [e.g., 1, 2, 3]. However, questions remain about the composition and vertical extent of Iapetus’ L hemisphere dark deposit. Measuring the thermal emission from Iapetus at different wavelengths, thus probing different depths, can help answering these questions. In particular, probing the L side of Iapetus at multiple wavelengths in the microwave domain can put a firmer number on the thickness of the dark layer thus bringing key constraints for dynamical models aiming at reproducing dust distribution on Iapetus [e.g., 4].
Iapetus radio maps
Since 2018, the Very Large Array telescope (VLA) has been used at several instances to map the thermal emission from Iapetus at wavelengths ranging from 0.9 to 6.0 cm i.e., from the Ka-band to C-band. A total of ~30 hours of observations was collected resulting in 13 radio maps (see 6 of them in Fig. 1). VLA observations only probe Iapetus dayside but with different portions of the L and T sides in the visible disk. To complete the analysis, we also consider 6 data segments collected by the Cassini RADAR acting as a radiometer during 2 targeted flybys of Iapetus (Fig. 1). These data were acquired at a wavelength of 2.2 cm, sometimes at night, and sample either the L or T hemisphere.
Both VLA and Cassini spatially-resolved maps show a clear asymmetry in the emitted flux with more flux coming from the L face of Iapetus than from the T face (e.g., May 28, 2018). Yet, the radio maps do no perfectly mimic the optical maps thus bringing complementary information
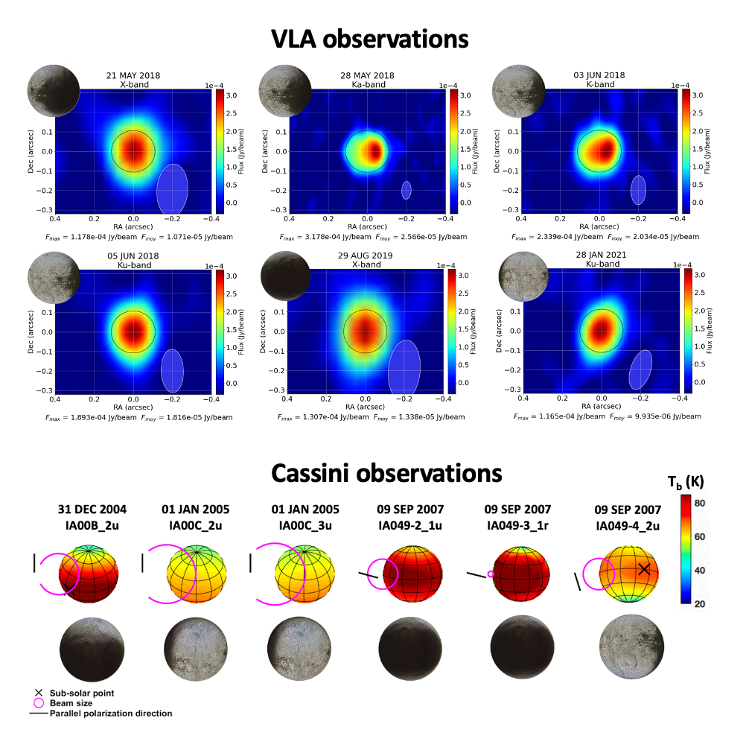
Fig. 1: Radio maps of Iapetus collected by VLA and the Cassini RADAR (Cassini deconvolved maps are from [5]). For each map, the size of the primary beam and the albedo map of the visible disk are indicated.
Thermal emission model
The interpretation of Iapetus’ radio maps requires a thermal emission model combining a thermal model and a transfer radiative model, to produce brightness temperature (in K) maps of Iapetus that can be converted into radiance (erg.cm−2.s−1/sr−1).
Model parameters: In bright terrains, Iapetus subsurface is modeled as a homogeneous column of porous water ice. On the L side, we assume a two-layer subsurface with a porous dark layer overlying the ice substrate whose characteristics are the same as those of the bright terrains. More specifically, the model parameters are: the porosity of the dark layer and of the icy substrate , the thickness of the dark layer (which should not exceed a few meters [6]), the composition of the dark material (organics, silicates or a mixture) and the degree of volume scattering in the icy substrate .
Thermal model: We adapted the “Multi-layered Implicit Heat Transfer Solver” (MultIHeaTS) [7] to the case of Iapetus. The thermal properties of the subsurface are primarily controlled by and Because the sensed subsurface temperatures are a combination of diurnal and seasonal components, the thermal model is set to provide temperature profiles down to tens of meter depths.
RT model: We used the model proposed by [8] for RT in stratified agricultural soils adding a contribution from volume scattering () in the water ice substrate. Composition, and dictate the vertical variations of the subsurface electrical properties. Silicates are more radio absorbing /emitting than organics.
Results and discussion
Each radio observation is compared to model predictions looking for the parameter combination that best reproduces it (e.g., Fig. 2). One main result is that all observations including the T side point to the need for a significant degree of volume scattering in the water ice substrate (=20-40%). In addition, in most cases, assuming a silicate dark composition provides better fits than organic one. Yet, best-fit models for observations on the L dark side generally underestimate and/or mislocate the peak emission which suggests variations in the thickness of the dust layer (Fig. 3). This will be further investigated. Future work will also focus on adjusting all data together to the model to find the best combination and in particular put a firm constrain on the thickness of the dark layer. Lastly, we will test the hypothesis that some detected cold spots could be associated with geological features such as impact craters.
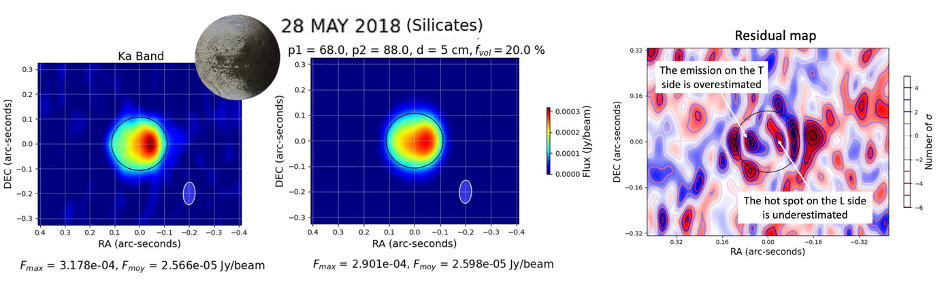
Fig. 2: VLA map of May 28 2018 (left), best-fit model (=1.55) (middle) and residual map. In the model, a uniform value is assumed on the L side.
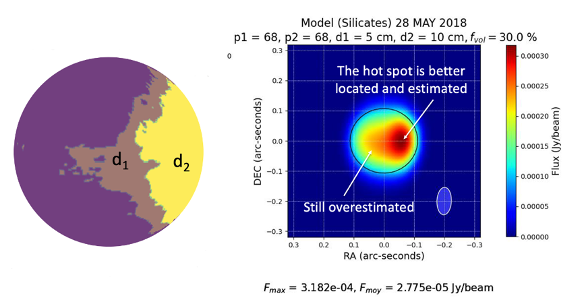
Fig. 3: Visible disk in May 28, 2018 (left) with best-fit model now assuming a thicker dust layer in the centre of the L side (right).
References:
1. Buratti et al., 2002, Icarus 155, 375–381
2. Verbiscer et al., 2009, Nature 461, 1098.
3. Dalle Ore et al., 2012, Icarus 221 (2), 735–743
4. Tamayo et al. 2011, Icarus 215, 260
5. Bonnefoy, 2020, PhD Thesis, Paris Observatory
6. Ostro et al., 2006, Icarus 183 (2), 479–490.
7. Mergny and Schmidt, 2024, Planet. Sci. J. 521
How to cite: Le Gall, A., Lellouch, E., Butler, B., Raza, S., Bonnefoy, L., Harrar, L., Leyrat, C., Schmidt, F., Mergny, C., Robin, C., and Meyer, F.-X.: Investigating Iapetus' dichotomy with multi-wavelength microwave observations, EPSC-DPS Joint Meeting 2025, Helsinki, Finland, 7–13 Sep 2025, EPSC-DPS2025-810, https://doi.org/10.5194/epsc-dps2025-810, 2025.