
 1,1,1,2,2,
- 1University of Freiburg, Institute of Earth and Environmental Sciences, Geology, Freiburg, Germany (thomas.kenkmann@geologie.uni-freiburg.de)
- 2German Aerospace Center DLR
Introduction
Ganymede, the largest moon in the solar system, has an icy crust that covers a large ocean underneath. Its surface is subdivided into Dark Terrain (DT) and Light Terrain (LT). The low-albedo DT forms about one-third of Ganymede´s surface and is roughly 4 Gya old (e.g., Schenk et al. 2004; Baby et al. 2023). The younger LT, that covers two-thirds of the surface, fills the gaps between DT and provides evidence of extension of the crust (Steinbrügge et al. 2025). Both DT and LT are fragmented. Resurfacing of Ganymede has been taken place by tectonic processes and cryovolcanism. Here we present a statistical analysis of fragmentation of the DT and LT that may shed light on the rheological properties, fragmentation mode and crustal thickness of Ganymede´s icy crust.
Methods
We used Ganymede´s global remote sensing mosaic published by Kresten et al. (2022). This mosaic is composed of Voyager, Galileo, and Juno imageries with different resolutions, ranging from <1km/pxl to 5km/pxl (Kresten et al. 2021). Collins et al. (2013) mapped the blocks of DT and LT as polygones, available in a GIS format. We used this data set and analyzed the size-frequency distribution of these blocks, separated for LT and DT. There are many small polygones, and fewer large ones, and this relationship is visualized by plotting the number of blocks larger than a given size against the area itself on a log-log scale. Using cumulative fragment area-frequency diagrams we fitted power-laws with an exponent -b, if the distributions follow linear regressions in the double logarithmic space. A power law distribution indicates a scale-invariant behavior.
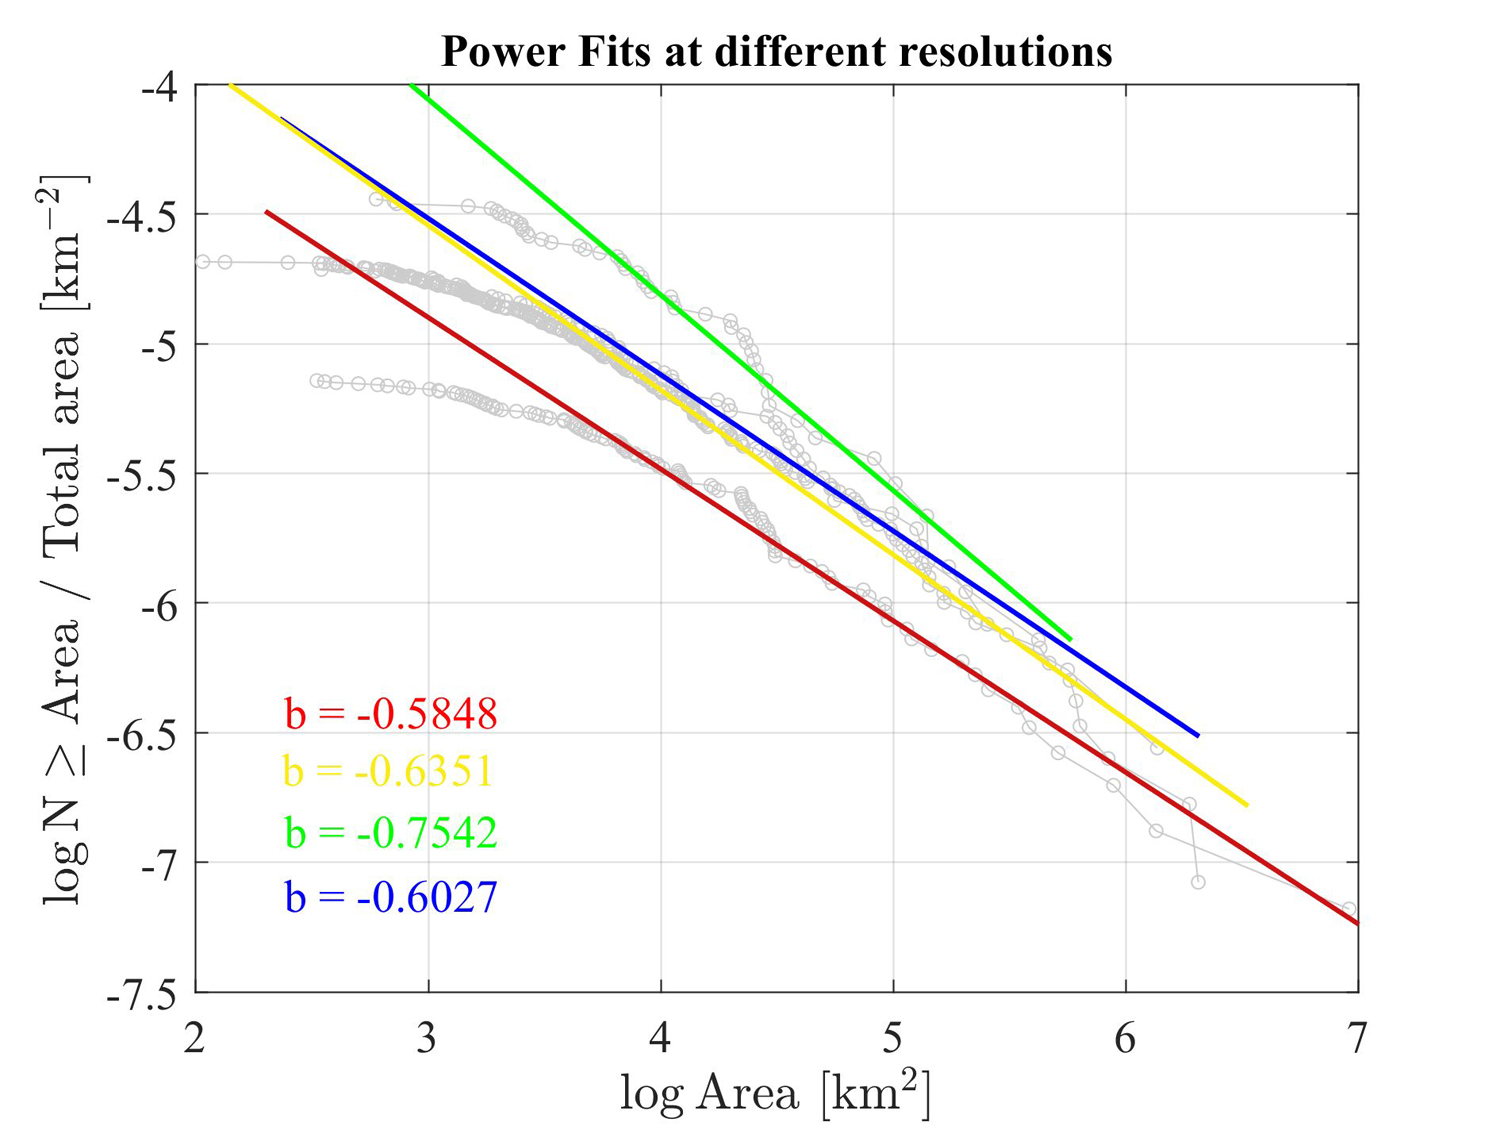
Fig. 1 Fragment size - frequency distribution of DT blocks
Results
Figure 1 shows the cumulative area-frequency distribution of DT blocks separated for the different resolutions. The negative power law slopes range between b = 0.58 and 0.75. The power law fits are robust over 2-3 orders of magnitude. To smaller block sizes a deviation from the power-law regression occurs. This cut-off is slightly affected by resolution and occurs at a threshold block size of around 3000-6000 square kilometers.
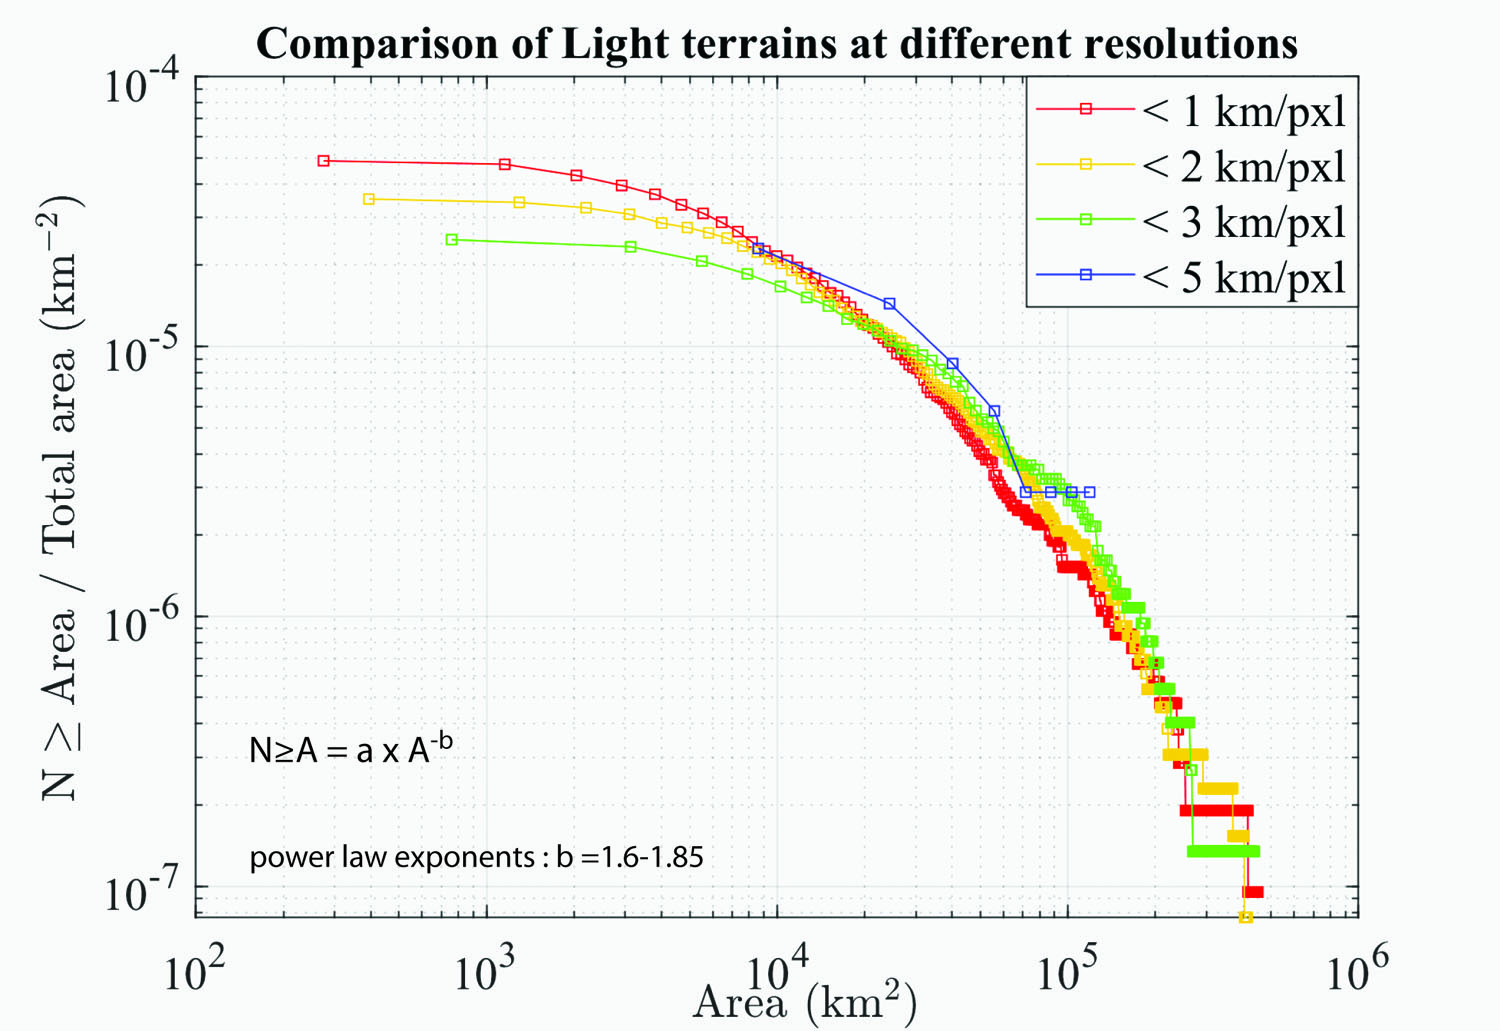
Fig. 2 Fragment size - frequency distribution of LT blocks.
The fragment size-frequency distribution of LT blocks is distinctly different from that of the DT (Fig. 2). Resolution only slightly affects the critical cut-off area, where a deviation from a power law exists. However, this cut-off is poorly defined as the slope changes gradationally and it starts at larger areas. The negative power law exponent b ranges between 1.6-1.85 for different resolutions. If all data are combined the area frequency distribution of LT blocks can be better described by an exponential function.
Discussion
The distinctly different fragment size distributions of DT and LT blocks may indicate different rheological properties of both terrain types. This means that the terrains are mechanically different as a whole and imply that the dark ice is not only a near-surface feature. The DT show a lower number of fragments in all size classes. Although these terrains are older than the LT, they are less fragmented. This suggests that they are mechanically stronger than the LT. Due to their higher strength, the deformation is localized in the area of the LT. But why should the DT have a higher strength than the LT? The concentration of dust and non-ice particles in the DT may inhibits grain growth of ice crystals, so that the DT may contain smaller grain sizes. Zhang et al. (2024) showed that the strength of ice increases with a decrease in grain size.
We also discuss whether the critical cut-off size of fragments from the power-law distribution may provide information on the thickness of the icy crust. The idea behind this is that the crustal thickness should not exceed the length of the short side of an ice fragment, otherwise there is a risk of toppling of the ice block in an extensional setting (if the block is not stabilized by adjacent blocks). Based on this simplified approach, crustal thicknesses should range between 50-130 km, which is in the range of published data (Schubert et al. 2004). Interestingly, this would imply that the thickness of the DT should be less than that of the LT.
We will compare the fragment size distributions of LT and DT with those of crushed shelf ice in Antarctica and Greenland, both showing scale invariance over many orders of magnitude (Weiss, 2001). Even the 52 lithospheric plates on Earth have a robust fractal structure and obey a power law distribution (Sornette & Pisarenko 2003).
References
Baby, N. R., et al. (2023). Stratigraphy, Crater Size–Frequency Distribution, and Chronology of Selected Areas of Ganymede’s Light and Dark Terrains. The Planetary Science Journal, 4(9), 162. https://doi.org/10.3847/PSJ/acebed
Collins, G. C., et al. (2013). Global Geologic Map of Ganymede, p. 3237 US Department of the Interior, US Geological Survey.
Kersten, E., et al. (2022) Updated Ganymede Mosaic from Juno Perijove 34 Images EPSC 2022-450, Granada, Spain. September 18–23., https://doi.org/10.5194/epsc2022-450.
Kersten, E. et al. (2021). Controlled Global Ganymede Mosaic from Voyager and Galileo Images. Planetary and Space Science 206: 105310.
Schenk, P. M., et al. (2004). Ages and interiors: the cratering record of the Galilean satellites. In: Bagenal, F., Dowling, T. E., McKinnon, W. B. (Eds.), Jupiter. The planet, satellites, and magnetosphere. Cambridge Univ. Press, Cambridge, pp. 427–456.
Sornette, D. and Pisarenko, V. (2003). Fractal Plate Tectonics. Geophysical Research Letters, 30, 1105, doi:10.1029/2002GL015043
Steinbrügge, G., et al. (2025) Tidal Deformation and tidal evolution of Ganymede. In Volwerk, M., et al. (eds.) Ganymede, 46-58, Cambridge University Press.
Weiss, J. (2001) Fracture and fragmentation of ice: a fractal analysis of scale invariance. Engineering Fracture Mechanics 68, 1975-2012.
Zhang, Y., et al. (2024). Effect of grain size on the uniaxial compressive strength of ice forming with different wind speeds in a cold laboratory. Water 16, 2049.https://doi.org/10.3390/w16142049.
How to cite: Kenkmann, T., Baby, N., Karagoz, O., Stephan, K., Hauber, E., and Wagner, R.: Statistical analysis of fragmentation of the Dark and Light Terrain on Ganymede and possible implications, EPSC-DPS Joint Meeting 2025, Helsinki, Finland, 7–12 Sep 2025, EPSC-DPS2025-954, https://doi.org/10.5194/epsc-dps2025-954, 2025.